Journal of Chemical and Pharmaceutical Research, 2014, 6(5):244-248
Research Article
CODEN(USA) : JCPRC5
ISSN : 0975-7384
Performance evaluation for engineering project management of particle
swarm optimization based on least squares support vector machines
Dong Qiao-Ting
1, Geng Li-Yan
1and Shen Ying-Ming
21
School of Economics and Management, Shijiazhuang Tiedao University, China
2Department of Science and Technology, Shijiazhuang Tiedao University, China
_____________________________________________________________________________________________
ABSTRACT
As for the limitation of using cross validation method to choose the parameters of least squares support vector machines (LSSVM), this paper proposes a new classified model which combines adaptive particle swarm optimization (APSO) algorithm with LSSVM. The new model uses APSO algorithm to select optimal parameters for LSSVM. According to the analysis of the management performance evaluation for engineering project, we conclude that LSSVM-APSO has better evaluation performance than LSSVM which bases on cross validation method. On searching for the optimal parameters of LSSVM, APSO algorithm is obviously faster than that by cross validation method.
Keywords: least squares support vector machine; particle pwarm optimization; engineering project; performance evaluation
_____________________________________________________________________________________________
INTRODUCTION
Engineering project management is a method which applies system science to managing the engineering construction project, characterized as systematization, complexity and dynamism[1]. Engineering project management performance is affected by the internal factors, such as quality, cost, schedule and safety. The interaction among these factors makes it more difficult to evaluate the performance. The common quantitative evaluation methods mainly include Key Performance Index (KPI), Analytic Hierarchy Process (AHP), Extension Theory, Fuzzy Comprehensive Evaluation and so on.
Aiming at the complex nonlinear relationship between project management performance and its evaluation index, evaluation of the neural network is introduced into the engineering project management performance, and it has achieved good results[2-3]. But the neural network bases on experiential risk minimization principle to establish model. Not only does it often encounter local minimum point and the over-fitting problems in practice, but also needs a large number of data samples for training. Support vector machine (SVM) is a new machine learning algorithm [4-5], which is theoretically based on structural risk minimization principle model. And it can solve the problems of nonlinearity, high dimension, small sample and local minimum point. LSSVM is a kind of learning algorithm based on SVM[6]. It regards the least square linear system as the loss function, which simplifies the process of calculation and increases the speed to solve. The LSSVM performance depends on its parameters, the traditional method of determining parameters —cross validation method is a trial and error method, short of certain theoretical guidance.
______________________________________________________________________________
1. LEAST SQUARES SUPPORT VECTOR MACHINES
Let L =
{
(xt, yt) |t = 1 , 2 ,L , N}
be the set of training samples,d t
x∈R as the d dimension input vector,
t
y ∈R is one-dimensional output. LSSVM uses the least square linear system as the loss function. It transforms the two programming problem of the standard support vector machine into a linear problem. Optimization problems are as follows:
2 1
1 1
min ( , )
2 2
[ ( ) ] 1
N T
t t T
t t t
J
y x b
ω ζ ω ω γ ζ ω φ ζ
= = + + = −
∑
(1)Among them, φ( ) is a nonlinear mapping function. The original input data are mapped to a high dimensional feature space, ω and b are respectively the weight vector and the error constants, γ as the regularization parameter, ζt∈R as error. To solve the above optimization problem, we introduce Lagrange multiplier αt, and
construct the corresponding Lagrange function.
( )
1
( , , , ) ( , ) { [ ] 1 }
N
T
t t t t
t
L ω ζb J ω ζ α y ω φ x b ζ
=
= −
∑
+ − + α(2)
Lagrange function respectively strives for the partial derivatives of α ω ζt, , ,b t, so the optimization problem is
transformed into solving a set of linear equations as follows:
0 0 / T b γ = + N N N 1 α Y
1 Ω I (3)
Among them, 1Nis N order column vector, the elements are 1, IN is N identity matrix,
[
1, ,]
T N y y = L Y ,
[
1, ,]
T
N
α α =
α L
,Ω is N×N matrix, the elements of
Ω , ( )T ( )
tj = (K x xj) =φ x φ xj
,
( )
, jx x
K
are kernel functions satisfying the Mercer conditions. By (3) to obtain
α
and b , the classification function can be LSSVM:(
)
1
( ) [ , ]
N
j j j
j
y x sig n α y K x x b
= =
∑
+ (4) Step function 1 0 ( ) 0 0 x s ig n xx ≥
=
<
(5)
2. ADAPTIVE PARTICLE SWARM ALGORITHM
Particle swarm optimization (PSO) algorithm is a global evolutionary algorithm proposed by Kenney and Eberhart[7,8], the algorithm is simple and adopts real coding. And it is widely used to solve complex optimization problems. Adaptive particle swarm optimization (APSO) is a kind of improved PSO algorithm[9,10]. By updating the inertia weight , APSO effectively balances the global and local search ability, and improves the convergence of the algorithm.
Assuming that in N dimensional search space, there are a group of particles, and m is the total number. Position vector of the i particles is Xi=(xi1,...,xiN). Velocity vector is Vi=(vi1, ...,viN). Each particle searches the optimal
position according to the fitness value of the optimal position of individual Pi b e s t = (xi b e s t1 , .. . ,xi N b e s t) and the particle swarm optimization, namely the global optimal position Gb e s t = (x1b e s t, . . . , xN b e s t) . The speed and position of each particle is updated according to the following formula:
1
1 1 2 2
1 1
( ) ( )
k k k k k k k k
i i ib est i b est i
k k k
i i i
V w V c r P X c r G X
X X V
+
+ +
= + × − + × −
= +
k i
X is i particles in the K iteration position; k ib e s t
P and k b e s t
G are the optimal position of individual and global in the K iteration of i particle; c1 and c2 are the study factors; 1
k
r and 2
k
r are random numbers between
[0,1]. W is inertia weight, which is used to coordinate the ability of local search and global search of particle swarm. The update formula is defined as follows:
max min min
min
min
max
( ) ( )
,
( )
,
avg avg
avg
w w f f
w f f
f f
w
w f f
− × −
− ≤
−
=
>
(7)
Among them, wm a x and wm in respectively are the maximum weight and minimum weight, f is the current
fitness value of particle. fa v g and fm i n are average fitness particle degree value and the minimum fitness value.
3. APSO OPTIMIZES THE PARAMETERS OF LSSVM
The key to apply the LSSVM is to reasonably choose kernel function and its parameters. The common Kernel functions are linear function, polynomial function, RBF function, Sigmoid function and so on. Because the RBF function is the most widely used kernel function, this paper selects RBF function. Form is as follows:
2 2
( i, j) exp ( i j / ) K x x = − x −x σ
(8)
Among them, σ 2
is nuclear parameter. As a result, LSSVM needs to determine the parameters of γ andσ 2 . In order to get the best classification performance, we need to search for the best parameter values. We often use cross validation method to determine values ofγ andσ 2
.But the cross validation method has certain blindness and randomness. The parameters are not always the optimal solution, thus affects the classification accuracy of LSSVM. And the large calculation workload will slow down the convergence speed of LSSVM.
In this paper, we use the APSO algorithm to adjust the parameters of LSSVM, and select the value of γ andσ 2 optimally (remember LSSVM - APSO). The essence of APSO algorithm selecting the LSSVM parameters is a process in which structure of LSSVM algorithm combines with APSO algorithm, and the entire process is as follows:
Step 1
Initialize the particle swarm. Set the particle population size m, learning factor
c
1 、 2c
, , maximum number ofiterations kmax, maximum speed Vmax as well as the maximum and minimum value of the inertia weightwmax、 min
w
, initialization LSSVM parameters γ and σ 2 .Step 2
Define the fitness function. Let the reciprocal of LSSVM correct classification rate as fitness function:
1 1
ˆ
1 / | ( ) ( ) | 1 0 0
N
t t
t
F y x y x
N =
=
∑
− ×(9)
Among them, yt( )x and yˆ ( )t x are respectively the target value and the output value, N is training sample.
Step 3
Search for the optimal particle location. Calculate the fitness value of each particle. According to the fitness value of particles, the individual optimal position of particles updates formin( (F Xi),F G( best)), and the global optimal position
of particles updates formin( (F Xi),F G( best)) . Use (6) to adjust the speed and location of the particles.
Step 4
______________________________________________________________________________
Step 5
Establish classification model. Calculate
α
and b through optimal parameter values ofγ
*
andσ
2*
, then substitute the results into (4) to establish APSO - LSSVM model. Meanwhile, use the test sample to check its classification performance.4. CASE ANALYSIS
Establish performance evaluation model of construction engineering project management which is based on LSSVM-APSO. The model uses the data of Literature [2] to analyze cases. Correct classification, the output of LSSVM is 1. Error classification, the output of LSSVM is 0. Ten samples of data can be divided into two groups. Use the previous seven data sample to train LSSVM - APSO and verify its classification accuracy, then reuse trained LSSVM - APSO to evaluate the performance of the remaining three. Among them, regard schedule, cost, quality and safety of four indicators as input of the model, and the target value as the output of the model. To facilitate the comparison of the effectiveness of the APSO algorithm, at the same time, use cross validation method to select LSSVM parameters for the performance evaluation (remember LSSVM - CV), and compare the two evaluation results of the model.
In the LSSVM - APSO model, the parameters of the APSO algorithm itself respectively set to: population size m = 10, the maximum number of iterations k = 30, learning factor c1 = c2 = 2, maximum and minimum inertia weight wmax=0.9,wmin=0.4. The LSSVM optimal parameter values chosen by APSO algorithm and cross validation method are shown in table 1.
Table 1 The optimal parameters chosen by APSO and cross validation method
Parameters APSO algorithm cross validation method
γ 2.7797 7.4775
σ2 0.0276 0.7053
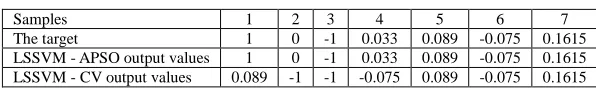
[image:4.595.156.454.555.599.2]The optimal parameters get by APSO and cross validation method are used to retrain LSSVM model respectively. Use LSSVM - APSO and LSSVM - CV to evaluate the training samples, and the results are shown in table 2. Table 2 shows that LSSVM - APSO performance evaluation results are good, LSSVM - APSO output values are in complete accord with the target, and the training samples of the correct classification rate is 100%. But LSSVM - CV for sample 3, 5, 6, 7, the output value is consistent with the target value, the correct classification rate is 57.14%. This is mainly due to the the fact that global searching ability of APSO algorithm has improved the accuracy of choosing parameters, thus improved the correct classification rate of LSSVM. Cross validation method determines parameters through many experiments, whose blindness restricts the LSSVM rate of correct classification. The time of APSO algorithm searching for the optimal parameters of LSSVM is relatively short, just 7.47 seconds. But, because of the large amount of calculation, the time of cross validation method to search the optimal parameters has increased to 28.34 seconds. This shows that optimizing parameters of LSSVM by APSO algorithm not only improves the correct classification rate, but also speeds up the model. LSSVM - APSO, therefore, can be used in the performance evaluation of construction project management.
Table 2 The evaluation result of the training samples
Samples 1 2 3 4 5 6 7
The target 1 0 -1 0.033 0.089 -0.075 0.1615 LSSVM - APSO output values 1 0 -1 0.033 0.089 -0.075 0.1615 LSSVM - CV output values 0.089 -1 -1 -0.075 0.089 -0.075 0.1615
Use LSSVM - APSO to evaluate the performance of three samples (project) management. The output values are shown in Table 3. If the output value is 0, the project management performance is normal; If the output value is less than 0, said that the poor project management performance; If the output value greater than 0, said the project management performance is good. The Table 3 shows that the management performances of projects 1 and 2 are bad, they need appropriate improvements. The management performance of the project 3 is good.
Table 3 The evaluation results of management performance
Samples 1 2 3
CONCLUSION
This paper introduces APSO algorithm to LSSVM model, establishes the LSSVM - APSO classification model. And set the performance evaluation of construction project management of the company as an example to analyze. Results show that using APSO algorithm to select LSSVM optimal parameters, not only improves performance evaluation, but also reduces the modeling time. It has certain value of popularization and application.
Acknowledgements
This work was financially sponsored by Soft Science Research Base of Hebei Province: Research Base on Project Construction and Management and the Soft Science Program of Hebei Province (No.: 12457203D-37).
REFERENCES
[1] Wang Hongzhi; Yong Jie,Journal of Shanxi Building, 2010,36 (20): 190-191.
[2] Yan Wenzhou; Xu Jing; Xu Yuanming, Journal of Xian Building University of Science and Technology (natural
science edition),2005, 37 (4) :557-560.
[3] Han Zhiguo;Wang Jiming;Chen Zhigao, Journal of Oil (Oil Processing) 2010,26 (3) :317-323. [4] VAPNIK V. N., IEEE Transactions on Neural Networks,1999,10(5) :988-999.
[5] Dilani Jayawarna; Alan W Pearson,International Journal of Technology Management, 2003,26(8):828-835. [6] Suykens J A K;Vandevalle J, Neural Processing Letters, 1999,9(3): 293-300.
[7] Wu Zhou; Tian Peng; Pan Feng. Automation Technology and Applications,2009,28 (1):6-9
[8] Shi Y; Eberhart R, Proceedings of IEEE International Conference on Evolutionary Computation. Anchorage,
Alaska,1999:69-73.
[9]P.C.Fourie;A.A.Groenwold,Structural and Multidisciplinary Optimization,2002, 23 (4):259-267.