Journal of Chemical and Pharmaceutical Research, 2015, 7(2):23-29
Research Article
CODEN(USA) : JCPRC5
ISSN : 0975-7384
Development of stability indicating RP-HPLC method for the estimation of
Fingolimod in its bulk dosages form as per ICH guideline
Somsubhra Ghosh*
1, Ashma
1and B. V. V. Ravikumar
21
Department of Pharmaceutical Analysis & Quality Assurance, Nalanda College of Pharmacy, Nalgonda, Telengana, India
2 Department of Pharmaceutical Analysis, Roland Institute of Pharmaceutical Sciences, Berhampur, Odisha, India
_____________________________________________________________________________________________
ABSTRACT
An accurate, precise, rapid & economical RP-HPLC method was developed & validated for the estimation of Fingolimod in pharmaceutical dosage forms, using UV detector. Elution was carried out using a mobile phase consisting of Buffer : Water (60 : 40) and flow rate was set on 1.2 ml / min at 319 nm wave length, retention time for Fingolimod was found to be 3.329 min. The method was found to be linear within the range of 40-120 µg/ml. In the linearity study, regression equation and correlation coefficient was found to be y=14744x and 0.999 respectively. This method was Rugged and Robust in different testing criteria, LOD and LOQ was found to be 0.005 µg / ml & 0.17 µg / ml respectively. Accuracy study was done in 3 different concentration level i.e 50, 100, 150% & % recovery of the method was found to be 99.7%, 99.8%, 99.9% respectively in 3 different levels & mean recovery was 99.8 %, so method was accurate. Results of all validation parameter were within the limits as per ICH guideline.
Key words: Fingolimod, Validation, Method development, HPLC, ICH.
_____________________________________________________________________________________________
INTRODUCTION
Figure no 1: Shows Chemical structure of Fingolimod
Fingolimod [1] Chemically designated as 2-amino-2-[2-(4-octylphenyl) ethyl] propane-1,3-diol, is a novel oral drug
used for the treatment of relapsing-re-emitting multiple sclerosis(RRMS)[2] shown in Figure no 1. [3].
According to the information collected from literature there is no method reported for the determination of
Fingolimod[4-7] in HPLC. In the present work, we have therefore focused to achieve the optimum chromatographic
EXPERIMENTAL SECTION
Chemicals and reagents: Water for HPLC-milli-Q grade (Merck), Potassium hydrogen phosphate (Merck), Hcl
(Grade LR, Finar Chemical Limited), NaOH (Grade LR, SD Fine-Chemical Limited), H2O2 (Alpha Pharma
Limited).
Apparatus: pH meter (Labindia-pH Analyser), Sonicator (Analytical Technologies Limited- Ultrasonic cleaner),
Weighing machine (Afcoset er-200A)
Instruments: HPLC - (Waters, PDA – 2695), UV/VIS spectrophotometer (LABINDIA UV 3200) Column: Phenyl
(4.6 x 250mm, 5µm, Make: Agilent), Buffer pH: 7.4, Mobile phase: Buffer : Water(60:40), Flow rate: 1.2ml per
min, Pipettes and Burettes Borosil.
Preparation of standard solution: Accurately weighed 10 mg of Fingolimod standard was transfered into a 25 ml
volumetric flask and about 10 ml of diluent was added, sonicated to dissolve it completely and made volume up to the mark with the same solvent. Further 5 ml of the above stock solution was pipetted into a 25ml volumetric flask and diluted up to the mark with diluents. Filtered through 0.45µm filter.
Preparation of sample solution: Accurately weighed 10 mg of Fingolimod sample was transferred into a 25 ml
volumetric flask. 10 ml of diluent was added and sonicated to dissolve it completely and made volume up to the mark with diluent. Further 5 ml of the above stock solution was pipetted into a 25ml volumetric flask and diluted up to the mark with diluent. Filtered through 0.45 µm filter.
Chromatographic conditions:
Column : Phenyl (4.6 x 250mm, 5µm, Make: Agilent)
Buffer pH : 7.4
Mobile phase : Buffer : Water (60:40)
Flow rate : 1.2 ml per min
λmax : 319 nm
Preparation of Phosphate buffer: Accurately weighted 1.44 grams of K2HPO4 was taken in a 1000 ml volumetric
flask, dissolved and diluted up to the mark with HPLC water and the volume was adjusted to pH 7.4 with Orthophosphoric acid.
Method Validation:
The suggested analytical method was validated according to international guidelines with respect to following parameters such as, precision, accuracy, linearity, robustness, ruggedness, LOD and LOQ.
Precision: Method precision was determined both in terms of repeatability (injection and analysis) and intermediate
precision (intra-day and inter-days reproducibility). In order to determine injection repeatability, samples spiked with 5 ml of Fingolimod were injected 6 times into HPLC system and repeatability of the retention time and peak area was determined and expressed as mean and % RSD calculated from the data obtained.
Accuracy: Accuracy was determined in terms of percent recovery Sample solution spiked with the analytes at three
different concentration levels 50,100,150 µg/ml of Fingolimod. Another set of standard mixtures at the same
concentration levels was also prepared with the diluents. Sample and standard solutions are injected into the HPLC system in triplicate. Percentage recovery of Fingolimod was calculated.
Linearity: The linearity of the method was established by spiking a series of standard of Fingolimod (40-120
µg/ml). Above solutions were injected onto the HPLC system. Calibration curves for standard solutions was
constructed by plotting their response (peak area of the analytes) against their respective concentrations. Linear regression was applied and slope (a), intercept (b), correlation coefficient (r) and standard error (Es) were determined.
Limit of detection & Limit of quantification: Detection and quantification limits were determined through
dilution method using Signal/Noise approach by injecting a 10µl sample. LOD was considered as the minimum
Robustness: The robustness of the developed method was investigated by evaluating the influence of small
deliberate variations in procedure variables like flow rate (±5%) and change in organic composition.
Ruggedness: The ruggedness of the method was investigated by evaluating the influence of different analyst,
different time intervals.
Degradation studies: The International Conference on Harmonization (ICH) guideline entitled stability testing of
new drug substances and products requires that stress testing be carried out to elucidate the inherent stability characteristics of the active substance. The aim of this work was to perform the stress degradation studies on the Fingolimod using the proposed method.
Stock Solution Preparation: Accurately weighed and transferred 10 mg Fingolimod sample into a 25ml dry
volumetric flask, diluent was added and sonicated to dissolve it completely and made volume up to the mark with the same solvent.
Hydrolytic degradation under acidic condition: 5ml of the above stock solution, 3 ml of 0.1N HCl were added in
25 ml volumetric flask. Then, the above solution was sonicated for 30min and then neutralized with 0.1 N NaOH and made the volume to 25ml with diluent and the solution was filtered with 0.45 microns syringe and placed in vials.
Hydrolytic degradation under alkaline condition: 5ml of the above stock solution, 3 ml of 0.1N NaOH were
added in 25 ml of volumetric flask. Then, the above solution was sonicated for 30min and then neutralized with 0.1 N HCL and made the volume up to 25ml with diluent and the solution was filtered with 0.45 microns syringe filters and placed in vials.
Oxidative degradation: 5 ml of the above stock solution, 1 ml of 3 % w/v of hydrogen peroxide added in 25 ml of
volumetric flask. Then above solution was sonicated for 30minutes and the volume was made up to the mark with diluents and the solution was filtered with 0.45 microns syringe filters and placed in vials.
Heat induced degradation: 10mg of the Fingolimod standard was weighed and placed in an oven at 1050c for 6hrs. Then it is taken in a 25ml volumetric flask and the volume was made up to the mark with the diluents. 5ml of the above stock solution was pipetted in a 25ml volumetric flask and the volume was made with diluent and the solution was filtered with 0.45 microns syringe filters and placed in vials.
Sunlight induced degradation: 10mg of the Fingolimod standard was weighed and is exposed to sunlight for about
55hrs and transferred in to 25ml volumetric flask and the volume was made up to the mark with the diluent. Further 5ml of the above solution was pipetted into a 25ml volumetric flask and the volume was made with diluent. The solution was filtered with 0.45 microns syringe filters and placed in vials.
RESULTS AND DISCUSSION
Mobile Phase Preparation: Initially the mobile phase tried was Methanol: Water. Then tried with Water:
Phosphate buffer in varying proportions. Finally, the mobile phase was tried with di potassium hydrogen orthophosphate buffer (pH 7.4) and water in proportion 60:40v/v respectively and then it was optimized shown in Figure 2.
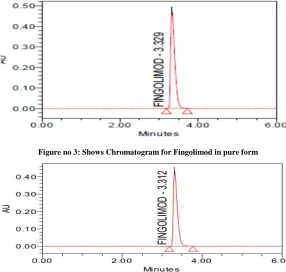
Figure no 3: Shows Chromatogram for Fingolimod in pure form
Figure no 4: Shows Sample Chromatogram for Fingolimod
Table no 1: Shows Results for Chromatogram for Fingolimod in pure form
Retention Time Area Height USP Tailing USP Plate Count 3.329 1464631 231124 1.53 6638
Method validation:
Precision: Precision data representing both repeatability (injection and analysis) and intermediate precision
(different analyst) are summarized in Table no. 2, 3, 4 respectively.
[image:4.595.220.389.524.639.2]The %RSD values for both Precession & ID Precision were less than 2.0%, which indicates that the proposed method is precise.
Table no 2: Shows Results of Method precision for Fingolimod
S.no Sample name RT Area
1 Precision 1 3.291 1472093 2 Precision 2 3.287 1475017 3 Precision 3 3.288 1473196 4 Precision 4 3.290 1476368 5 Precision 5 3.290 1477460 6 Precision 6 3.291 1470611
Mean 1474124
S.D 2618.748
[image:4.595.225.389.663.766.2]%R.S.D 0.18
Table no 3: Shows Results of System precision for Fingolimod:
S.no Sample Name RT Area
1 Precision 1 3.359 1460340 2 Precision 2 3.353 1466503 3 Precision 3 3.343 1466796 4 Precision 4 3.335 1462377 5 Precision 5 3.332 1463497 6 Precision 6 3.329 1464631
Mean 1464024
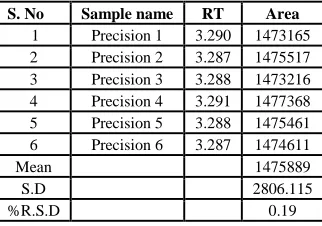
Table no: 4 Shows Results of Intermediate precision for Fingolimod
S. No Sample name RT Area
1 Precision 1 3.290 1473165 2 Precision 2 3.287 1475517 3 Precision 3 3.288 1473216 4 Precision 4 3.291 1477368 5 Precision 5 3.288 1475461 6 Precision 6 3.287 1474611
Mean 1475889
S.D 2806.115
%R.S.D 0.19
Accuracy: Average recoveries of Fingolimod are 100.03%, 99.8%, 99.3%, at 50%,100% & 150% concentrations
[image:5.595.162.452.273.434.2]level respectively. The percentage recoveries of the drug is within the limits 99-101%. So the method is accurate, accuracy data for Fingolimod are presented in Table no. 5.
Table no 5: Shows Accuracy (recovery) data for Fingolimod
% level Sample Area µg/ml added µg/ml found %Recovery %mean
50% 730548 40 39.92 99.8
99.7 50% 731463 40 39.97 99.9
50% 730232 40 39.87 99.7 50% 730548 40 39.92 99.8 50% 731829 40 39.98 99.5 50% 731646 40 39.98 99.6 100% 1461279 80 79.85 99.8
99.8 100% 1462743 80 79.93 99.9
100% 1460181 80 79.79 99.7 150% 2194023 120 119.89 99.6
99.9 150% 2198781 120 119.98 99.9
150% 2194572 120 119.96 99.6 150% 2196585 120 119.95 99.8 150% 2195121 120 119.95 99.8 150% 2197500 120 119.97 99.9
Linearity:
The response was found linear over a concentration range of 40-120 µg/mL of Fingolimod.
The correlation co-efficient were found to be 0.998 for Fingolimod So the method is linear, data is presented in
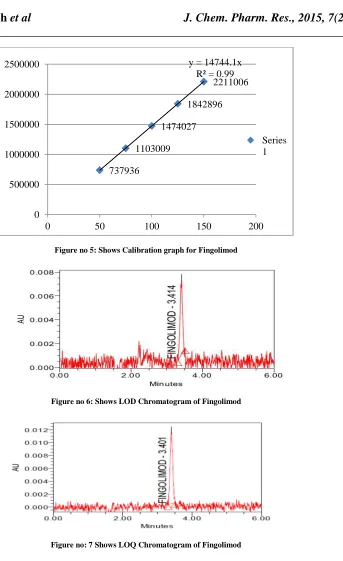
[image:5.595.200.415.523.596.2]Table no. 6, Linearity graph of Fingolimod is given in Figure no. 5
Table no 6: Shows Linearity results for Fingolimod
s.no Sample Name Concentration
in µg/ml RT Area
1 Linearity50% 40 3.370 737936 2 Linearity75% 60 3.349 1103009 3 Linearity100% 80 3.335 1474027 4 Linearity125% 100 3.322 1842896 5 Linearity150% 120 3.307 2211006
Limit of detection: The LOD for Fingolimod standard solutions were found to be 0.26 µg/ml given in Figure no. 6.
Figure no 5: Shows Calibration graph for Fingolimod
[image:6.595.157.467.70.262.2]Figure no 6: Shows LOD Chromatogram of Fingolimod
Figure no: 7 Shows LOQ Chromatogram of Fingolimod
Robustness: Minor deliberate changes in different experimental parameters such as flow rate (±5%) and wavelength
(±5units) did not significantly affect the retention time & peak area of Rilpivirine indicating that the proposed method is robust which is mentioned in Table no. 7 & 8.
Table no 7: Shows Results of effect of flow rate
Flow RT Area USP Tailing USP Plate count
1ml/min 4.178 1843975 1.613 7039 1.4ml/min 2.805 1188838 1.550 6289
Table no 8: Shows Results of effect of temperature
Temperature RT Area USP Tailing USP Plate count
Temperature 1 3.343 1743825 1.528 6680 Temperature 2 3.323 1448613 1.576 6686
737936 1103009
1474027 1842896
2211006 y = 14744.1x
R² = 0.99
0 500000 1000000 1500000 2000000 2500000
0 50 100 150 200
[image:6.595.178.443.292.410.2] [image:6.595.169.432.444.557.2]Forced degradation studies
Table no 9: Shows results of forced degradation studies
Degradation studies Sample area % Assay Acid degradation 1305909 89.2 Base degradation 1368862 93.5 Peroxide degradation 1266381 86.5 Temperature degradation 1405756 96.02 Sunlight degradation 1428887 97.6
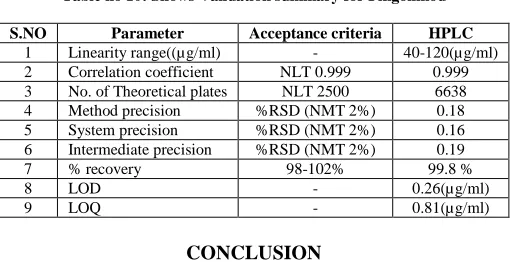
Table no 10: Shows Validation summary for Fingolimod
S.NO Parameter Acceptance criteria HPLC
1 Linearity range((µg/ml) - 40-120(µg/ml) 2 Correlation coefficient NLT 0.999 0.999 3 No. of Theoretical plates NLT 2500 6638 4 Method precision %RSD (NMT 2%) 0.18 5 System precision %RSD (NMT 2%) 0.16 6 Intermediate precision %RSD (NMT 2%) 0.19 7 % recovery 98-102% 99.8 %
8 LOD - 0.26(µg/ml)
9 LOQ - 0.81(µg/ml)
CONCLUSION
Method development & validation of Fingolimod was done by RP-HPLC method. The estimation was done by
using Phenyl C18 (4.6 x 150 mm, 5µm, Make: Aligant). Mobile phase was used as Buffer & Water in (60:40) ratio at
a flow rate 1.2 ml/min, retaintion time was 3.329 min. at λmax 319 nm. The linearity range of Fingolimod was found
to be within 40-120 µg/ml. Mean recovery was 99.8 %, which is within 98-102%. Correlation coefficient value was 0.999, % RSD was 0.18 % which is within the limit. These results show the method is accurate, precise, sensitive, economic & rugged. The HPLC method is more rapid. The proposed method can be successfully applied to estimate bulk drug & Tablet dosage form. The method was found to be having suitable application in routine laboratory analysis with high degree of accuracy and precision.
Acknowledgement
We are very thankful to authorities of Nalanda College of Pharmacy for providing the facilities to complete this research work.
REFERENCES
[1]Available at: http://www.drugbank.ca/search?utf8=%E2%9C%93&query=fingolimod&commit=Search,
retrieved on 4th February 2013.
[2]Jerold C, Hans-Peter H. Clin Neuropharmacol. 33 (2) 2010 91-101.
[3]Available at: http://www.chemspider.com/Chemical-Structure.97087.html, retrieved on 4th February 2013
[4]C Emotte, F Deglave, O Heudi, F Picard, O Kret, J. of Pharm. Biomed. Anal., 58 2012, 102-112.
[5]K Kathiresan, MB Kumar Reddy, C Moorthi, NA Dawood Sha, K Krishnan, R Manavalan, Int. J. of Pharm. and
Pharm. Sci. 4 (1) (2012) 289-292.
[6]SN Razzaq, IU Khan, I Mariam, SS Razzaq, Chem. Cen. J. 6 (94) (2012) 1-10.
[7]HO Kaila, MA Ambasana, RS Thakkar, HT Saravaia, AK Shah, Indian. J. of Pharm. Sci. 72 (5) (2010) 592-598.
[8]Validation of analytical procedures: text and methodology, in: International Conference on Harmonization
[image:7.595.179.434.186.317.2]