Journal of Chemical and Pharmaceutical Research, 2015, 7(3):1204-1209
Research Article
CODEN(USA) : JCPRC5ISSN : 0975-7384A calculation model of coal mine safety management based on
Kalman filter algorithm
Qi Lixia
School of Management and Economics, North China University of Water Resources and Electric Power Zhengzhou, China
_____________________________________________________________________________________________
ABSTRACT
A reasonable coal mine safety control model is very important for coal mine safety management. In this paper, a calculation model of coal mine safety management is researches based on Kalman filtering algorithm. Unlike traditional regression analysis, this model is based on state equation. The model design and parameter identification method are discussed in details. An example of actual coal production is given out and analyzed with this method. The calculation results show that the average prediction error rate of this model is less compared with traditional linear regression and exponential one. Regression parameters such as H and C in this model can be explained with practical safety management factors.
Key words: Coal Mine, Safety Management, Control Model, Kalman Filter
_____________________________________________________________________________________________
INTRODUCTION
It is one of the important tasks for the coal production enterprises management to obtain a reasonable safety goal. An effective way to solve this problem is to establish a safety production model and predict its next phase safety management objectives base on it [1]. However, the result is very bad because of the theoretical disadvantages. The actual production safety management goal often comes out of wishes managers’. It is adopted by last-year-data directly, or derived in accordance with linear regression. This makes the safety management objectives ridiculous and will not play their proper role. In this paper, a coal production safety control math model is calculated here.
_____________________________________________________________________________
China's security control theory. In this paper, the modern control theory is applied to coal mine safety control, and the coal mine production safety control model is inspired by Mr. Zhang’s ideas.
MATHEMATICAL MODELS
Accidents are of great chanciness in terms of mine production. Thus, it is impossible to work with absolute control to ensure the safety of each person all the time. However, in the viewpoint of control theory, mine safety system is a multivariate stochastic control. As a result, the overall consequences of the accident have a rule to abide by in the large-scale production systems. In coal mine safety production, a common indicator of the accident consequences is mortality rate / (million ton*year). Serious injury rate/ (million ton*year), injury rate per thousand workers are often referred also. Mortality rate / (million ton*year) is used as an example in this analysis. Other indicators can be calculated in the same way.
Mortality rate can be seen as the output of the mine safety production system. But, it is very difficult to establish the mathematical models of its input in accordance with the classical cybernetics. According to materialist dialectics, all systems are in motion, which is the contradiction result in the system. Coal mine production system can also be seen as the opposite result of the two basic contradiction "dangerous" and "anti-risk". These can be summed into two indicators- H (k) and C (k). Then, the safety state of coal mine production system can be regarded as a differential equation such as equation (1).
) ( ) 1 ( )] ( 1 [ ) 1 ( ) ( ) ( k H k Y k C k Y k Y k Y + − − = − − = ∆ (1)
In this formula, k is time factor, Y(k) is the death rate /( million ton *year), H (k) is dangerous index, and C (k) is anti-risk index.
The opposite signs of H (k) and C (k) explain that their relationship is antagonistic. It should be noted that the data Y (k) can be collected according to its observed value Z(k). Moreover, the statistical variable Y (k) also is related to the random error variable W(k). Mine safety control system is generally considered as a one-dimensional linear time-invariant one. That is, the H (k) and C (k) are constants. So the actual coal mine safety model is controlled by the composition of equation (2) and (3).
,... 2 , 1 ), ( ] ) 1 ( )[ 1 ( ) ( = + − − − = − k k W C H k Y C C H k
Y (2)
L
,
2
,
1
),
(
)
(
)
(
k
=
Y
k
+
V
k
k
=
Z
(3)W(k) is an n-dimensional vector that acting on the system in the k moments, which is an random disturbance. W(k) usually is a Gaussian white noise sequence and is equal to 0.
V(k) is the observation noise out of a m-dimensional vector. It is a Gaussian white noise sequence as the same as W(k). The meaning of V(k) is 0 also.
Equation (4) is the general solution of equation (2) and (3). It is the presentation of mine safety control model.
k C C H Y C H k
Y( )= +[ 0− ](1− ) (4)
PARAMETERS IDENTIFICATION ALGORITHMS
The common method used in the calculation of statistics is a multiple regression analysis. However, there are many factors involved in this mine safety, which lead the statistics to be disturbed in a large extent. For these reasons, Kalman filter model [7] is used to solve this problem.
Hypothesis: C H k Y k
X( )= ( )− (5)
C
−
=
1
C H k Z k
F( )= ( )− (7)
On equations (2) (3) for substitution:
,...
2
,
1
),
(
)
1
(
)
(
k
=
X
k
−
+
W
k
k
=
X
α
(8),...
2
,
1
),
(
)
(
)
(
k
=
X
k
+
V
k
k
=
F
(9)Then, the following recurrence formulas (10)-(13) can be attained according to Kalman filter theory:
) ( ) ( ) ( ) ( k R k P k P k G +
= (10)
)] 1 ( ~ )[ ( ) 1 ( ~ ) ( ~ = − + − − k X F k G k X k
X α α (11)
) ( )) ( 1 ( )
(k G k P k
B = − (12)
) ( ) ( ) 1 ( 2 k Q k B k
P + =
α
+ (13)In the above formula, G(k) is the gain matrix of the observation noise in k moment, X~(k) is the filtered estimated value of K-times, B(k) is the estimation error covariance matrix(n*n), P(k) is the covariance matrix in k moment, Q (k) is Covariance matrix of W(k), and R (k) is Covariance matrix of V(k).
Because coal mine production system is considered one-dimensional linear system, and then Q (k) and R (k) can be regarded as another constant. On the other hand, it is can be known according to equation (8) and (9):
D(X(k)-αX(k-1))=Q (14)
D(F(k)-X(k))=R (15)
Based on the above formula, if the pre-estimated values of H and C are out of a set estimations of P(0), Q and R to ensure recursive formula effects, X (k) can be obtained. Recovery helps to calculate Y(k), P(k), Q and R. Calculated H and C means least squares identification. Repeat iterations within the two calculated results of Y (k) could satisfy the error margin. The H and C values are the parameters we want to get.
APPLICATIONS
A. MODEL CALCULATIONS
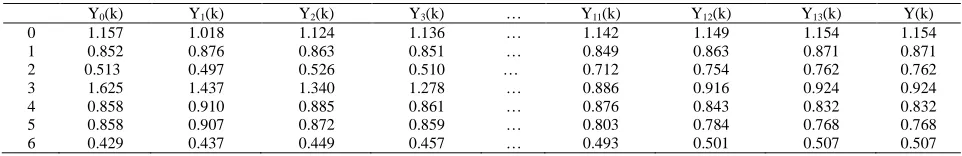
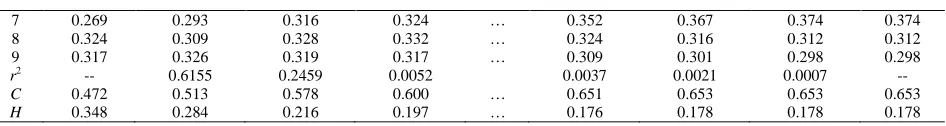
[image:3.595.69.489.84.325.2]The mortality statistics of a coal industry group is shown out in Table 1. The state equation was established and solved through Kalman filter. The square of the difference between two adjacent calculated values Y(k) -expressed as r2 -is used as an index to evaluate the error. Iteration is terminated when r2 <0.1. The initial parameter values are assumed to be C=0.472,H=0.348. And the final result for the equation while iteration are C=0.653,H=0.178. The results are shown in Tab 2.
TABLE 1 The mortality statistics of a coal industry group (1997-2006)
Project Year
1997 1998 1999 2000 2001 2002 2003 2004 2005 2006 Mortality/(million ton*year) 1.157 0.852 0.513 1.625 0.858 0.858 0.429 0.269 0.324 0.317
(Source: Statistical Yearbook of a Coal Industry Group Company)
TABLE 2 Iterative calculations of the case
Y0(k) Y1(k) Y2(k) Y3(k) … Y11(k) Y12(k) Y13(k) Y(k)
0 1.157 1.018 1.124 1.136 … 1.142 1.149 1.154 1.154
1 0.852 0.876 0.863 0.851 … 0.849 0.863 0.871 0.871
2 0.513 0.497 0.526 0.510 … 0.712 0.754 0.762 0.762
3 1.625 1.437 1.340 1.278 … 0.886 0.916 0.924 0.924
4 0.858 0.910 0.885 0.861 … 0.876 0.843 0.832 0.832
5 0.858 0.907 0.872 0.859 … 0.803 0.784 0.768 0.768
[image:3.595.65.546.691.769.2]_____________________________________________________________________________
7 0.269 0.293 0.316 0.324 … 0.352 0.367 0.374 0.374
8 0.324 0.309 0.328 0.332 … 0.324 0.316 0.312 0.312
9 0.317 0.326 0.319 0.317 … 0.309 0.301 0.298 0.298
r2 -- 0.6155 0.2459 0.0052 0.0037 0.0021 0.0007 --
C 0.472 0.513 0.578 0.600 … 0.651 0.653 0.653 0.653
H 0.348 0.284 0.216 0.197 … 0.176 0.178 0.178 0.178
The security control state equation of the coal industry group should be:
178
.
0
)
1
(
)
653
.
0
1
(
)
(
k
=
−
Y
k
−
+
Y
(16)B. THE APPLICATION OF SECURITY CONTROL MODEL
It is very difficult to understand if the model will be directly applied to the coal mine production safety target management. Because the annual production of medium-sized coal enterprises is generally not more than 3 million tons, the result will be much less than 1 if the safety management objective is still measured with the mortality rate per million ton. The formation of the calculated model should be changed to adapt to the actual production. It is appropriate to use the average time of no fatal accidents as the security management goal. Assuming that the annual production capacity of P million tons, safety management objective is calculated according to the model M, the average time of no fatal accidents should be T = 365/MP days. To the coal enterprises, for example, the annual production is about 2.6 million tons, then the average of no fatal accidents time T = 365/0.273 * 2.6 = 515 days. This indicator is easy to understand than the above model.
C. COMPARISON WITH REGRESSION ANALYSIS
[image:4.595.73.546.67.130.2]In the existing production management, many people like to use a simple linear regression or exponential one to make out security control objectives in the next phase. The exponential and linear regression is also done with the data in this case, whose results are shown in Table 3.
TABLE 3 Comparison with linear and exponential regression
Original data
Linear regression
Exponential regression
State equation
1 1.157 1.158 1.435 1.154
2 0.852 1.061 1.228 0.871
3 0.513 0.964 1.051 0.762
4 1.625 0.866 0.900 0.924
5 0.858 0.769 0.770 0.832
6 0.858 0.671 0.659 0.768
7 0.429 0.574 0.564 0.507
8 0.269 0.477 0.483 0.374
9 0.324 0.379 0.413 0.312
10 0.317 0.282 0.354 0.298
r2 -- 0.934 1.155 0.580
The linear regression model and the exponential regression model are built by using the same raw data. Form is listed as equation (17) and (18).
Linear regression model:
2557
.
1
0974
.
0
+
−
=
x
y
(17)Exponential regression model:
x
e
y
=
1
.
4348
−0.1554 (18)D. FACTORS AFFECT H AND C
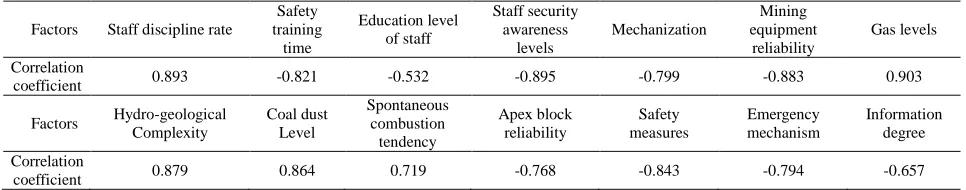
[image:5.595.65.548.241.336.2]In order to understand the impact of coal mine safety production, 14 factors were used for gray relational analysis associated with mortality per million ton. The results were shown in Tab 4. From the associated polarity, it can be seen that eight factors such as staff security awareness levels, mining equipment reliability, safety training time are negative correlations with mortality. These can be seen as the controlling factors of mortality, that is, the impact factors are C. The other six factors have a positive correlation with mortality per million ton. They affect the value of index H. From the coefficient correlation it also can be seen:The more complex hydro-geological environment, the greater probability of a fatal accident will be. On the other hand, the staff security awareness level has the largest association with mortality in the control factors. This is because rising the level of safety awareness among employees will help to discover and eliminate potential safety problems timely, then employees can protect themselves effectively in advent of danger. It can be effective in reducing the rate discipline and suppressing the occurrence of unsafe behavior at the same time.These all help to reduce mortality.
TABLE 4 The results of gray relational analysis
Factors Staff discipline rate
Safety training
time
Education level of staff
Staff security awareness
levels
Mechanization
Mining equipment
reliability
Gas levels
Correlation
coefficient 0.893 -0.821 -0.532 -0.895 -0.799 -0.883 0.903
Factors Hydro-geological Complexity
Coal dust Level
Spontaneous combustion
tendency
Apex block reliability
Safety measures
Emergency mechanism
Information degree
Correlation
coefficient 0.879 0.864 0.719 -0.768 -0.843 -0.794 -0.657
CONCLUSION
Mine safety is a big issue to restrict the development of China's coal mines and institutionalized. A reasonable goal of coal mine safety management is very important to coal industries. This paper discusses the safety production modeling method based on state equation with the help of Cybernetics theory. The parameter identification method is discussed also. An actual case of coal mine enterprises is used to analyze and the following conclusions can be drawn:
(1) It is more effective to construct the mine safety model based on differential equation. Compared with traditional regression analysis, this model is more precise and more consistent with actual production.
(2) Kalman filter is an effective way to exclude the interference of statistical noise in the model of parameter identification.
(3) Coal mine safety control, in essence, is the result of the contradiction between risk factors and anti-risk ones. Improving identification and monitoring capability of the production environment hazard, and raising the level of employee safety awareness will be helpful to reduce coal mine casualty.
(4) Mine safety control model is designed to help managers develop a more realistic security control goal. We can use the transformation form of the model, for example, the average time of no fatal accidents, to define the safety goals. This will make the model understood in an easier way.
REFERENCES
[1]Mahdevari,Satar;Shahriar, Kourosh;Esfahanipour, Akbar, Science of the Total Environment, 2013,48 (1), p 85-99.
[2]Wang, Shuang-Ying,Wu, Chao,Zuo, Hong-Yan, Zhongnan Daxue Xuebao (Ziran Kexue Ban)/Journal of Central South University (Science and Technology), 2010,41(5), p 1918-1922
[3]Sun Jianxian,Li Jiang, Energy Technology& Management, 2009,12(3), 140-142+145
[4]Yang, Xue, Li, WenSheng Communications in Computer and Information Science, in: 2011 Innovative Computing and Information International Conference,Proceedings, Wu Han,China,pp 101-108, September 23-25, 2011
[5]CAO Qinggui, CHENG Weimin,.Industrial Safety and Environmental Protection, 1999,16(2), p25-29. [6]CHEN Qingji, WANG Dianxuan, Systems Engineering Theory & Practice, 1997,23(12),p38-43