Journal of Chemical and Pharmaceutical Research, 2014, 6(6):1212-1217
Research Article
ISSN : 0975-7384
CODEN(USA) : JCPRC5
Development and validation of analytical method for simultaneous estimation
of amoxycillin trihydrate and probenecid in combined dosage form
Hiren Jani
1, Mayank Bapna*
1, Jigisha Patel
1, Reena Paghadal
1, Bhavik Jani
21Department of Quality Assurance, Shivam Pharmaceutical Studies and Research Centre, Valasan-Anand, Gujarat,
India
2School of Pharmacy, RK University, Kasturbadham, Rajkot, Gujarat, India
_____________________________________________________________________________________________
ABSTRACT
A simple, fast and precise reverse phase high performance liquid chromatographic method was developed for the simultaneous estimation of Amoxycillin trihydrate and Probenecid in combined dosage form. The chromatographic separation was achieved on Zorbax RX-C18 (150x4.6) mm; 5µm column with an isocratic mixture of 0.05M potassium dihydrogen phosphatebuffer pH 5.6 adjusted with a mixture of trifluoro acetic acid and tetrahydrofuran (0.5%): acetonitrile in the ratio of 86:14 v/v. The mobile phase was kept at a flow rate of 0.8ml/min with injection
volume of 20µl and wavelength of detection 227nm at room temperature. The retention times for AMOX and PRO
was found to be 1.85±0.1min and 6.90±0.1min, respectively. The linearity was obtained in the range of 50-250µg/ml for both Amoxycillin trihydrate and Probenecid with correlation coefficient 0.999 for both. On carrying out degradation studies it was found that products did not interfere with the detection of AMOX and PRO. The proposed method was found to be linear, accurate, precise, stable, robust and specific and was successfully applied for the determination of investigated drugs in combined dosage form.
Keywords: Amoxicillin, Probenecid, RP-HPLC, Stability, Validation.
_____________________________________________________________________________________________
INTRODUCTION
Amoxycillin (AMOX) is chemically (2S.5R.6R)-6-{[(2R)-2-amino-2-(4-hydroxyphenyl)-acetyl] amino}-3, 3-dimethyl-7-oxo-4-thia-l-azabicyclo [3.2.0] heptane-2-carboxylic acid [1]. Amoxycillin is amino Penicillin with spectrum similar to that of Ampicillin [2]. AMOX is a moderate-spectrum bacteriolytic β-lactum antibiotic used to treat bacterial infections caused by susceptible microorganisms. It is usually the drug of choice within the class because it is better absorbed following oral administration. AMOX acts by inhibiting the synthesis of bacterial cell wall. Probenecid (PRO) decreases the renal tubular secretion of amoxicillin. Concurrent use of amoxicillin and probenecid may result in increased and prolonged blood levels of Amoxycillin [3].
Rationale
______________________________________________________________________________
In the proposed method forced degradation studies for the drug substances and drug product will also be carried out under different stress conditions like acidic, basic, oxidative, thermal, and UV exposure and the stressed samples will be analyzed by the developed and validated method.
EXPERIMENTAL SECTION
The tablet MOXYLONG DT of AMOX and PRO, (label claim: AMOX 500mg and PRO 500mg), manufactured by American remedies ltd. and API were procured from Astron Research Limited, Ahmadabad. All the chemicals used which are analytical grade purchased from MERCK Chem. Ltd., Mumbai. HPLC instruments (Shimadzu) LC2010CHT with SPDM20A diode detector was used for estimation of AMOX and PRO in combined dosage form. LC solution software was applied for data collecting and processing. Other instruments used were FTIR Spectrophotometer (Brukeroptics), digital balance (Sartorius) (0.1 mg – 205 gm) and pH meter (ELICO).
METHOD DEVELOPMENT
The chromatographic separation was performed with isocratic elution on a Zorbax RX-C18 (150x 4.6) mm; 5µm as a stationary phase with mobile phase which is a mixture of 0.05M KH2PO4 buffer (pH 5.6) adjusted with TFA +
THF 0.5%: acetonitrile (86:14 v/v) pumped at a flow rate of 1ml/min. The samples were analyzed by a PDA detector at 227 nm with the injection volume of 20µL.
Preparation of working standard solution for AMOX and PRO
Accurately weighed 100mg of standard AMOX and PRO and was transferred to a 100ml volumetric flask separately and dissolved in 100ml of solvent (methanol: acetonitrile in the ratio of 80:20 v/v). The flask was shaken and volume was made up to the mark with solvent to give a solution containing 1000µg/ml AMOX and PRO. From this solution 5ml solution was taken and diluted up to 10 ml with solvent in a volumetric flask to give solution of 500µg/ml of AMOX and PRO. Further, 2ml of this solution was taken out and diluted up to 10ml with solvent to give working standard solution containing 100µg/ml of AMOX and PRO.
Preparation sample solution
Twenty tablets were weighed and triturated and weight-equivalent of powder containing 20 mg of AMOX and 20 mg of PRO was weighed accurately and transferred to a 20 ml volumetric flask and diluted up to 20 ml with methanol: acetonitrile (80:20 v/v). After this the solution was sonicated for 15min to dissolve compounds and further diluted similarly, same as working standard, to prepare a solution containing 100 µg/ml of AMOX and 100µg/mL of PRO, respectively.
Method optimization
The chromatographic separation was achieved with conditions shown in Table-1 and the chromatogram obtained is shown in Figure 1.
Calibration curve
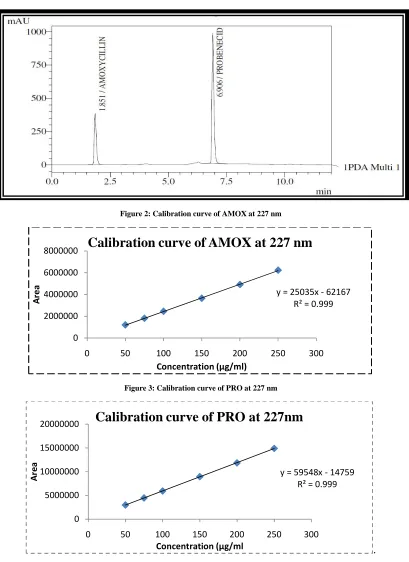
Six different concentrations of AMOX and PRO i.e., 50µg/ml, 75µg/ml, 100µg/ml, 150µg/ml, 200µg/ml, 250µg/ml, were prepared from working standard solution of AMOX and PRO, respectively. Calibration curves constructed were linear over the prepared concentration of 50-250µg/ml for both AMOX and PRO. Calibration curves were prepared using ratio of analyte peak area to internal standard peak versus concentration of analyte. The calibration curves are shown in Figure 2 and 3.
METHOD VALIDATION [20]
The proposed method was validated in accordance with ICH guidelines. It was validated in terms of linearity, accuracy, precision, LOD, LOQ and % recovery.
Linearity
______________________________________________________________________________
Accuracy
The accuracy of the method was assessed by recovery studies of AMOX and PRO in combined dosage form at three concentration levels. A fixed amount of pre-analyzed sample was taken and standard drug was added at 80%, 100% and 120% levels. The samples were then analysed and each level was repeated for three times. The percentage recovery of AMOX and PRO was found to be 100.03% and 99.60%, respectively. The results are shown in Table 2.
Precision
The precision for the developed method was determined in terms of intraday and inter-day precision. For intraday precision evaluation, a standard solution of fixed concentration was injected at various time intervals on a particular day and %RSD for AMOX and PRO were found to be1.12% and 0.54%, respectively (limit %RSD <2.0%). In addition, the inter-day precision was studied by injecting the same concentration of standard solution on consecutive days and the %RSD for AMOX and PRO were 1.75% and 0.89%, respectively (limit %RSD < 2.0%).The results are shown in Table 3 and 4.
Limit of detection and limit of quantification
The LOD and LOQ were determined by injecting progressively low concentration of the standard solutions using the developed HPLC method. The LOD for AMOX and PRO were found to be 4.54µg/ml and 2.01µg/ml, respectively. The LOQ for AMOX and PRO were found to be 13.77µg/ml and 6.09µg/ml, respectively.
Assay
Sample solution (20 µl) was injected and analysed. The peak area of AMOX and PRO and the amount of each drug in samples was computed. The results of the assay show presence of 99.66% and 99.47% of AMOX and PRO, respectively. The results of the assay are shown in Table 5.
STABILITY INDICATING STUDY [21] Force degradation studies
The stability indicating RP-HPLC assay method for simultaneous determination of AMOX and PRO were performed using above developed method. In order to establish stability-indicating nature of the method, drug product and solvent were subjected to various stress conditions to conduct force degradation studies. Stress studies were carried out under the conditions of acidic, basic, oxidative, thermal and UV exposure. Several trials with different severity of each stressed condition were conducted. Results are shown in Table 6.
RESULTS AND DISCUSSION
A new RP-HPLC method was developed for estimation of AMOX and PRO in combined dosage form. The HPLC method was optimized with a view to develop an accurate assay method for estimation of AMOX and PRO in combined dosage form. The samples were analyzed by a PDA detector at 227 nm with the injection volume of 20µL resulted in peak with good shape and resolution. The method was found to be linear in the range of 50-250µg/ml for both AMOX and PRO. The percentage recoveries of AMOX and PRO were 100.03% and 99.60%, respectively which shows that there is no interference from excipients and the lower values of RSD of assay indicate the method is accurate. The %RSD of AMOX and PRO for intraday precision studies were found to be 0.43%and 0.60%, respectively (limit %RSD< 2.0%) and % RSD of AMOX and PRO for inter-day precision studies were found to be 0.69% and 0.75%, respectively (limit %RSD < 2.0%).
______________________________________________________________________________
Figure 1: Typical chromatogram of standard for AMOX and PRO
Figure 2: Calibration curve of AMOX at 227 nm
Figure 3: Calibration curve of PRO at 227 nm
.
y = 25035x - 62167 R² = 0.999
0 2000000 4000000 6000000 8000000
0 50 100 150 200 250 300
A
re
a
Concentration (µg/ml)
Calibration curve of AMOX at 227 nm
y = 59548x - 14759 R² = 0.999
0 5000000 10000000 15000000 20000000
0 50 100 150 200 250 300
A
re
a
Concentration (µg/ml
______________________________________________________________________________
Table-1: Optimized chromatographic conditions
Sr. No. Parameters Condition
1 Instrument Shimadzu LC 2010 CHT
2 Stationary phase Zorbax RX C18 (250mm X 4.6 mm, 5 µm)
3 Mobile phase 0.05 M KH2PO4 Buffer pH 5.6 +THF 0.5%: Acetonitrile (86:14v/v) pH 5.6
4 Pump mode Isocratic 5 Flow rate (mL/min) 0.8 6 Run time (min) 12 7 Volume of injection (µl) 20 8 Detector UV 9 Detection wavelength (nm) 227 10 Column temperature 30˚ C
11 Retention time (min) AMOX: 1.851 ± 0.1 min PRO: 6.906 ± 0.1 min
Table-2: Accuracy studies for the proposed method
Spiked level Amount added (µg/ml) Amount Found (µg/ml) %Recovery AMOX PRO AMOX PRO AMOX PRO
80% 80 80 80.16 79.56 100.21% 99.45% 100% 100 100 99.66 99.47 99.66% 99.47% 120% 120 120 120.16 119.87 100.14% 99.89%
Table-3: Intraday precision for the analysis of AMOX and PRO
Sr. No. Drug(µg/ml) Peak Area Mean SD %RSD AMOX 1. 2. 3.
1. 75 1819521 1819543 1821349 1820138 1049.103 0.0576 2. 100 2551490 2541219 2497824 2530178 28485.84 1.1258 3. 125 3100820 3095895 3092593 3096436 4140.096 0.1337
Average %RSD 0.4390
Sr no. PRO 1. 2. 3. Mean SD %RSD 1. 75 4454120 4421051 4398259 4424477 28087.62 0.6348 2. 100 5924075 5928201 5982511 5944929 32612.28 0.5485 3. 125 7487490 7438215 7394398 7440034 46572.66 0.6259
Average %RSD 0.6031
Table-4: Inter-day precision for the analysis of AMOX and PRO
Sr. No. Drug(µg/ml) Peak Area Mean SD %RSD AMOX 1. 2. 3.
1. 75 1803289 1802351 1801892 1802511 712.055 0.0395 2. 100 2495831 2432925 2413598 2447451 42997.99 1.7568 3. 125 3045902 3038512 3037970 3037970 8216.934 0.2704
Average %RSD 0.6889
Sr. No. PRO 1. 2. 3. Mean SD %RSD
1. 75 4454120 4392581 4428647 4425116 30921.08 0.6987 2. 100 5924075 5822195 5853148 5866473 52230.68 0.8903 3. 125 7487490 7397299 7407450 7430746 49402.87 0.6648
Average %RSD 0.7513
Table-5: Assay results of proposed methods
Sr. No. Label claim Amount taken Amount Found % Assay AMOX PRO AMOX PRO AMOX PRO AMOX PRO
1
500mg 500mg 500mg 500mg
498.32 497.37 99.66% 99.47%
2 495.51 498.32 99.10% 99.66%
3 497.94 497.2 99.58% 99.44%
4 497.9 499.71 99.58% 99.94%
5 498.59 498.37 99.71% 99.85%
6 498.43 499.29 99.68% 99.67%
______________________________________________________________________________
Table-6: Force degradation study of AMOX and PRO
Degradation Condition % ASSAY % DEGRADATION AMOX PRO AMOX PRO
Acid Degradation 87.96% 89.97% 12.04% 10.30% Base Degradation 82.43% 85.08% 17.57% 14.92% Oxidative Degradation 70.75% 71.38% 29.25% 28.62% Photo Degradation 96.91% 99.92% 3.09% 0.08% Thermal Degradation 88.29% 90.05% 11.71% 9.95%
CONCLUSION
The developed RP-HPLC method is simple, specific, accurate and precise for the simultaneous estimation of AMOX and PRO in combined dosage form. The developed method provides good resolution between AMOX and PRO. It was successfully validated in terms of linearity, accuracy, precision, LOD, LOQ and recovery in accordance with ICH guidelines. Thus the described method is suitable for routine analysis and quality control of pharmaceutical preparations containing these drugs in combination.
Acknowledgement
The author is grateful to Dr. Harish Kakrani, Principal, Shivam Pharmaceutical Studies and Research Centre, Valasan, Assistant Professor Mr. Mayank Bapna and Miss Jigisha Patel for continuous support and guidance.
REFERENCES
[1]British pharmacopoeia, 7th Edition, British pharmacopoeia commission, 2013, 361. [2]Drug Profile for Amoxycillin Trihydrate. http://www.drugbank.ca/drugs/DB01060 [3]Amoxycillin Tablets, http://www.drugs.com/pro/amoxicillin-tablets.html
[4]A Manzoor; G Sureshbabu; AS Sathishkumar. International Journal of ChemTech Research, 2011, 3(3), 1037-1041.
[5]S Beg; MS Hasnain; S Swain; K Kohli. International journal of pharmaceutical sciences and nanotechnology,
2011, 4(2), 1423-1427.
[6]B Sarwar; KA Kohli; S Suryakanta; MH Saquib. Journal of liquid chromatography and related technologies,
2012, 35(3) 393-406.
[7]K Rajesh; NK Gill; D Gagan; N Sharma; SG Subrahmanya. International journal of universal pharmacy and life
science, 2012, 2(4), 19-28.
[8]R Solanki; BP Nagori; MK Naval; J Banerjee. Asian Pharma press, 2013, 3(2), 66-71. [9]AC Vispute; VA Patil; DA Patil. Scholars research library, 2013, 5(1), 327-323.
[10]DS Nikam; CG Bonde; SJ Surana; G Venkateshwarlu; PG Dekate. International Journal of PharmTech
Research, 2009, 1(3), 935-939.
[11]SS Chitlange; SR Tawargeri; RP Bhole. Pharmaceutica Analytica Acta, 2013, 4(7), 2153-2435. [12]RV Rele; RN Mali. Der Pharma Chemica, 2013, 5(1), 273-278.
[13]SS Chitlange; SR Tawargeri; KK Chaturvedi. Indian Journals.com, 2011, 4(6), 1025-1030. [14]V Bojaraju; D Sireesha; VVLN Prasad; PV Diwan. World Journal of Chemistry, 2012, 7(2), 47-52. [15]DT Giang; VD Hoang. Journal of Young Pharmacists, 2010, 2(2), 190-195.
[16]T Kurian; J Kurien; H William; C Bijumol. Hygeia:: journal for drugs and medicines, 2012 , 4(2), 65-69. [17]MH Zhou. Journal of Pharmaceutical Analysis, 2003,0(3), 186-188.
[18]VM Shinde; BS Desai; NM Tendolkar. Indian Journal of Pharmaceutical Sciences, 1994, 56(2), 58-60. [19]D Jain; DK Jain; P Trivedi. Indian Journal of Pharmaceutical Sciences, 1998, 60(5), 318-320.