International Conference on Mechanical Engineering Research (ICMER2013), 1-3 July 2013 Bukit Gambang Resort City, Kuantan, Pahang, Malaysia Organized by Faculty of Mechanical Engineering, Universiti Malaysia Pahang Paper ID: P124
INVESTMENT CASTING USING MULTI-JET MODELING PATTERNS: THE THERMOGRAVIMETRIC ANALYSIS OF VISIJET® SR200 UV CURABLE
ACRYLATE PLASTIC
M.N. Hafsa1, M. Ibrahim2 and S. Sharif3
1,2
Faculty of Mechanical and Manufacturing Engineering, Universiti Tun Hussein Onn Malaysia, Batu Pahat, Johor, Malaysia.
3
Faculty of Mechanical Engineering, Universiti Teknologi Malaysia, Skudai, Johor, Malaysia.
Email: 1hafsa.mpputhm@gmail.com, 2mustaffa@uthm.edu.my, 3safian@fkm.utm.my
ABSTRACT
Rapid Prototyping (RP) technology is actively studied to be implemented in Investment Casting (IC) process. Nowadays RP techniques were studied for the feasibility as IC master pattern, in terms of pattern collapsibility and drainage during burnout. The purpose of study is to determine the characteristic of Visijet® SR200 acrylate material during burnout process. Traditional IC patterns made from wax have properties that limit their application, in precision casting especially for parts with thin geometries that readily break or deform conventional when handled or dipped in the refractory slurry. Furthermore,it is not economical when producing small number of parts. Non wax pattern fabricated for IC process, revealed that ceramic shell cracking due to excessive thermal expansions, incomplete collapsibility of pattern during burnout, residual ash and poor surface finish. Thermogravimetric analysis (TGA) was used to measured the weight loss of acrylate material as the temperature was increased. TGA measured the change of material’s mass as it is heated. It represents the decomposition temperature after being subjected to varying temperatures, as well as the amount of residual ash. In this experiment, the temperature range was from 20ºC to 700ºC with 5ºC increment. Experiment results shows the values of material’s optimum reaction temperature and decomposing temperature of Visijet® SR200 acrylate. The percentages of remaining materials were also monitored throughout the process to obtain the amount of residual ash. All of the temperature value obtained is a resemblance for the actual burnout process and can be used as references.
Keywords: Rapid Prototyping; Multi-Jet Modeling; Investment Casting; Acrylate;
Thermogravimetric.
INTRODUCTION
when it comes to high precision process (Marwah et al., 2012; Chhabra and Singh, 2011).
One of the common RP process for IC implementations is Selective Laser Sintering (SLS) technique (Hague and Dickens, 1995; Wirtz and Freyer, 2000; Wuis et al., 2000; Zhao, 2000; Dimov et al., 2001; Ferreira and Mateus, 2003; Norouzi et al., 2009; Yang et al., 2009). Usually wax is used to make IC pattern among the other SLS material because it’s thermal properties do compliments IC burn out process requirement. Pattern material should burn out completely without leaving any residue during the dewaxing process. Unfortunately, wax product may distort if it’s to be made using SLS process, affecting the final IC product. Plus, one of the serious problems of SLS is that since the solidified part is cooled rapidly, the model tends to be deformed and cracked due to the thermal stress (Matsumoto et al., 2002).
The RP polymer pattern materials have a higher melting temperature and higher-melting viscosity thus it is very difficult to dewax (Dickens et al., 1995; Yang et al., 2009). To replace wax, it is necessary to use other material that is also easy to shape but have greater strength. Furthermore, the RP patterns need to have an excellent surface finish and must precisely recreate fine details with minimal burnout residue (Ferreira and Mateus, 2003). Besides SLS, other RP systems, such as Stereolithography (SLA) and Laminated Object Manufacturing (LOM) were tested for IC applications. However, since the epoxy material used in the SLA is a thermoset material, it does not melt like wax. It would expand and creates thermal stresses to the ceramic shell causing it to crack (Hague and Dickens, 1995; Rosochowski and Matuszak, 2000; Yao and Leu, 2000). For the LOM application in IC, the paper which is the main material of the system would create very high amount of residual ashes during the burn out process (Rosochowski and Matuszak, 2000).
Recent studies have shown the capabilities of pattern built from ABS using FDM technique. ABS pattern are capable to produce a clean burn out, it is robust and could be handled without damage, it also easy to be prepared and has good dimensional stability. However, the surface conditions are quite rough due to its surface layer and built condition, thus requiring surface finishing of the pattern before it could proceed with IC as the quality of final IC product are highly dependent to the quality of the pattern (Gouldsen and Blake, 1998; Omar et al., 2012).
Another technique to produce the IC pattern is by using MJM. MJM technique could produce better surface finish compared to FDM (Omar et al., 2012). MJM also be implemented in building part with internal structure as sacrificial IC pattern (Hafsa et al., 2013). During burnout process, the main purpose is to completely remove the master pattern, leaving the vacant space for metal to be poured in. The temperature for burn out process depends on the type of pattern material. This paper will be focused on MJM part based on acrylate material. Thermal decomposition and weight loss are measure by using Thermogravimetric instrument. TGA is a technique in which, upon heating a material measure whether the weight increases or decreases.
METHODOLOGY
ceramic shell a perfect vacant for metal pouring. In this process, the acrylic material being heated and will start to decompose leaving just residual ashes. This part of the process is important as it is the last step before metal is being poured into a mould.
Since the materials reacts differently as it is subjected to heating, using Thermogravimetric (TG) will help to predict and understand how a material weight changes as temperature changes. It is a technique which the mass of the sample is monitored against time or temperature while the temperature of the sample, in a specified atmosphere is programmed.
Thermal analysis was carried out using Linesis Thermobalance TGA equipment. The samples were prepared in form of tiny flakes. For the testing, 70.0 mg of MJM Visijet® SR200 acrylate flakes sample was used. The sample was put into the crucible before it was inserted into the measuring system. In a thermobalance equipment system, a schematic diagram of the specific balance and furnace assembly is shown in Figure 1. The sample was burnt under air atmosphere with the heating rate of 5ºC/min. The scale has to be balance with the least possible percentage of tolerance using the potentiometer. It is very desirable to get the 0% of balance tolerance. The sample was heated to slightly 700ºC with 5ºC increment. The machine was left to run for 2 hours and 20 minutes.
Figure 1. Schematic diagram of a typical balance and furnace assembly.
to calibrate the system is Alumina Oxide (Al2O3) burnout under air atmosphere. The
X-axis value will be corrected according to the weight absolute 1x10⁻⁴. For the Y-axis value, the value will be smoothed according to the weight absolute 1x10⁻⁴. The smoothing process should be done accordingly as the data that was too smooth will not resemble the actual character of the whole burning process. The data could then be derived into thermogravimetric data to obtain the decomposition value.
RESULTS AND DISCUSSION
Thermal Decomposition
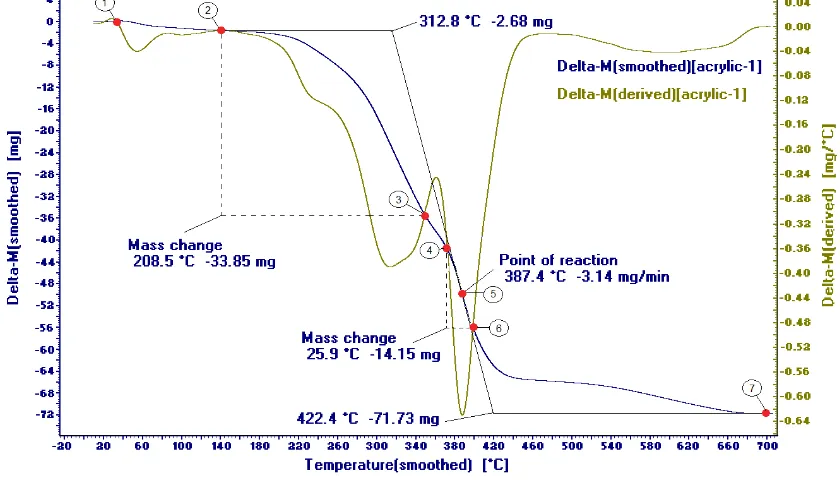
A derivative thermogravimetric (DTG) curve presents the rate of mass change (dm/dT) as a function of temperature against temperature (T) on the x-axis. Figure 2 shows typical DTG analysis curves for a sample of Visijet® SR200 acrylate heated in air atmosphere at a rate of 5ºC/min. In this figure, the derivative of the curve is shown by brown line. A TG curve which is blue line represents the variation in the mass (m) of the sample with the temperature.
[image:4.595.90.510.478.718.2]Within the graph, the line descends to resemble the lost of mass along the process. The material decomposition occurs in three stages. It could be seen from the graph by identifying the three curves from the DTG that was derived from the initial TG curve. The first stage of decomposition (point 2-3) is the initial degradation in primary of the decomposition of the hard segment. During this stage, the rate of the temperature change is as much as 208.5ºC, with the total weight loss of -33.85 mg. The second stage (point 4-5) is the polycondensation and poly of degradation mechanism and effected by the soft segment content (Rau et al., 2013). For this stage, the rate of the temperature change is by 25.9ºC with total mass lost of -14.15 mg. The third stage (point 6-7) is only attributing to the ash formation (Sepe, 1997; Gouldsen and Blake, 1998).
In the early stage (point 1-2) of the decomposition, the material was not in stable conditions due to the presence of some volatile components (Salmoria et al., 2005; Rau et al., 2013). The graph shows that there are two step of reaction which occurs at 312.8 and 422.4ºC. At 312.8 ºC, the rate of mass loss is 2.68 mg/min while at 422.4 ºC the rate was -71.73mg/min. The crossing point between the both reactions created a point (point 5) which called the point of reaction which is at 387.4 ºC with the rate of mass loss of -3.14 mg/min. This particular point is where the maximum point of Visijet® SR200 acrylate material significantly decomposes. It caused by the break of polymer chain and polymer thermal decomposition (Salmoria, et al., 2005; Wang et al., 2013).
Residual Ash
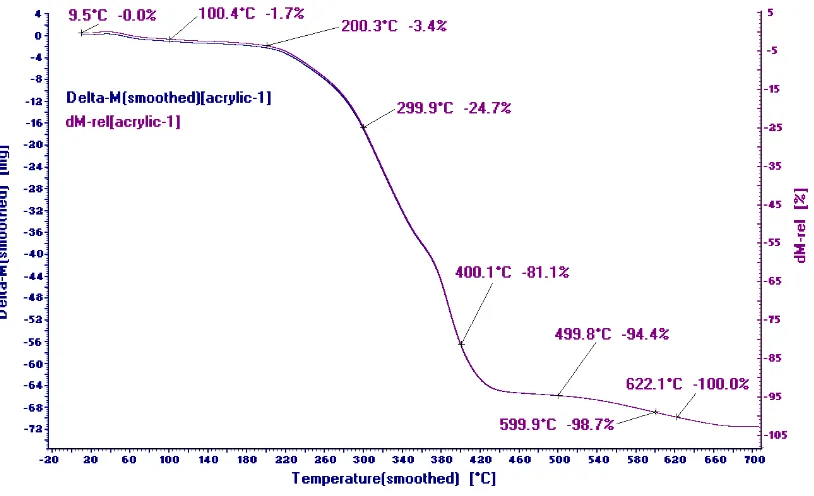
[image:5.595.97.504.390.638.2]TG curves represent the variation in the mass (m) of the sample with the temperature as shown in Figure 3. From the graph, the early stage of the experiment shows little changes by only -3.4% from the 70 mg sample. The line pose very small gradient up to around 200oC. From there towards 500oC, nearly -95% of the 70 mg sample has already decomposed which were resembled by a huge gradient in the graph within 200oC to 500oC and during this stage, only 3.9 mg of the sample remains. Further temperature increase completely burn the sample without leaving any residue. Though it took up to 622.1oC for the material to be completely burnt out, it is still well below the expected temperature of 700oC.
Figure 3. Thermogravimetric (TG) curves for Visijet® SR200 acrylate material.
will be placed as near as possible without touching the sample, thus it leads to source of error due to the thermal lag and partly due to the finite time taken to cause detectable mass change. If the composition of the sample contains is such that it reacts either with the sample, or product formed or the evolved gases then this will cause error in recording the mass change of the sample.
Other than that, the particle size of the sample could also vary the result of TGA (Gouldsen and Blake, 1998). The smaller the particle size, the greater the extent of decomposition at any given temperature could occur, and the use of large crystal may result in apparent vary rapid mass loss during heating due to mechanical loss of part of the sample.
CONCLUSION
By using TGA, the burn out temperature to be used during IC for pattern made from Visijet® SR200 acrylate material could be determined. It also gives an idea how the material characteristic during the actual burn out process. It was found out from the TGA curves that the material would be able to decompose within the temperature of 700oC without leaving any residual ash which is exactly at 622.1oC. The material significantly decomposes at 387.4oC when the polymer chain breaks and the polymer thermal decompositions occur. As TGA could resemble the actual burn out process in IC, it shows the suitability of this material to be used as the pattern for IC. The material are able to be completely burnt out to make sure the quality of the casting will not be affected.
ACKNOWLEDGEMENTS
The authors would like to thank the Faculty of Mechanical & Manufacturing Engineering in Universiti Tun Hussein Onn Malaysia (UTHM) and the Faculty of Mechanical Engineering in Universiti Teknologi Malaysia (UTM) for their financial support and facilitating in this research programme.
REFERENCES
Cheah, C.M., Chua, C.K., Lee, C.W., Feng, C. and Totong, K. 2005. Rapid prototyping and tooling techniques: a review of applications for rapid investment casting. International Journal Advance Manufacturing Technology. 25: 308-320. doi: 10. 1007/s00170-003-1840-6
Chhabra, M. and Singh, R. 2011. Rapid casting solutions: a review. Rapid Prototyping Journal. 17 (5): 328-350. doi: 10.1108/13552541111156469
Dickens, P.M. 1993. Rapid prototyping techniques provide new tool for investment casters. Foundry International. 16 (3): 6.
Dickens, P.M., Stangroom, R., Greul, M., Holmer, B., Hon, K.K.B., Hovtun, R. Neumann, R., Noeken, S. and Wimpenny, D. 1995. Conversion of RP models to investment castings. Rapid Prototyping Journal. 1 (4): 4-11. ISSN: 1355-2546 Dimov S.S., Pham, D.T. Lacan, F., Dotchev, K.D. 2001. Rapid tooling application of
Ferreira, J.C. and Mateus, A. 2003. A numerical and experimental study of fracture in RP stereolithography patterns and ceramic shells for investment casting. Journal of Materials Processing Technology. 134:135-144. PII: S0924-0136(02)01034-8 Gouldsen, C. and Blake, P. 1998. Investment casting using FDM/ABS rapid prototype
patterns. http://www.stratasys.com, accessed on 3 February 2012.
Hafsa, M.N., Ibrahim, M., Sharif, S., Omar, M.F.M. and Zainol, M.A. 2013. Evaluation of different internal structure and build orientation for multijet modeling process. Applied Mechanics and Materials. 315: 587-591. doi: 10.4028/www. scientific.net/AMM.315.587
Hague, R. and Dickens, P.M. 1995. Stresses created in ceramic shells using QuickCastTM models. Proceedings of the Solid Freeform Fabrication Symposium. H. Marcus. University of Texas at Austin, Austin. 242-252.
Marwah, O.M.F., Sharif, S. and Ibrahim, M. 2012. Direct fabrication of IC sacrificial patterns via rapid prototyping approaches. International Journal of Automation Technology. 6 (5): 570-575.
Matsumoto, M., Shiomi, M., Osakada, K. and Abe, F. 2002. Finite element analysis of single forming on metallic powder bed in rapid prototyping by selective laser processing. International Journal of Machine Tools and Manufacture. 42: 61-67. PII: S0890-6955(01)00093-1
Norouzi, Y., Rahmati, S. and Hojjat, Y. 2009. A novel lattice structure for SL investment casting patterns. Rapid Prototyping Journal. 15(4): 255-263. doi: 10. 1108/13552540910979776
Omar, M.F.M, Sharif, S., Ibrahim, M., Hehsan, H., Busari, M.N.M. and Hafsa, M.N. 2012. Evaluation of direct RP pattern for investment casting. Advanced Materials Research. 463-464: 226-233. doi: 10.4028/www.scientific.net/AMR. 463-464.226
Rau, S.R., Vengadaesvaran, B., Naziron, N.N. and Arof, A.K. 2013. Strength and adhesion properties polyol-epoxy polyol resin protective coating on mild substrate. Pigment and Resin Technology. 42 (2): 111-116. doi: 10.1108/036994 21311301098
Rosochowski, A. and Matuszak, A. 2000. Rapid tooling: the state of the art. Journal of Materials Processing Technology. 106: 191-198. PII: S0924-0136(00)00613-0 Salmoria, G.V., Gonzalez, V.J., Ahrens, C.H., Soldi, V. and Pires, A.T.N. 2005.
Stereolithography somos 7110 photosensitive resin: study of curing kinetic and thermal degradation. Journal of Materials Processing Technology. 168: 164-171. doi: 10.1016/j/jmatprotec.2004.11.012
Sepe, M.P. 1997. Expert overviews covering the science and technology of rubber and plastics. RAPRA technology Ltd. 8 (11): 13-18. ISSN: 0889-3144
Wang, Y., Liu, F. and Xue, X. 2013. Synthesis and characterization on UV-cured epoxy acrylate/POSS nanocomposites. Progress in Organic Coating. 76: 863-869. Wirtz, H and Freyer, C. 2000. Investment casting shell in 1 day using selective laser
sintering (SLS). Foundryman. 93 (1): 63-65.
Wu, M., Schadlich, S.J., Wagner, I. and Sahm, P.R. 2000. Using numerical simulation with rapid prototyping and investment casting. Journal of Manufacturing. 52 (8): 45-47. ISSN: 1047-4838
Yao, W.L. and Leu, M.C. 2000. Analysis and design of internal web structure of laser stereolithography patterns for investment casting. Material and Design. 21: 101-109. PII: S0261-3069(99)00061-8