Journal of Chemical and Pharmaceutical Research, 2015, 7(12):950-960
Research Article
CODEN(USA) : JCPRC5
ISSN : 0975-7384
Development and validation of rapid RP HPLC-PDA method for the
analysis of Pazopanib hydrochloride in bulk, dosage forms and in
in vitro
dissolution samples
G. Chaitanya, K. Prasanna Kumar, U. Harini, M. Lingam, and A. K. M. Pawar*
Department of Pharmaceutical Analysis and Quality Assurance, University College of Pharmaceutical Sciences, Andhra University, AP, India
_____________________________________________________________________________________________
ABSTRACT
The prime objective of the current work is to develop a simple, rapid, efficient, economical and LC-MS compatible RP HPLC-PDA method for the analysis of Pazopanib hydrochloride in bulk, dosage forms and in dissolution samples. Samples were chromatographed on Agilent Zorbax Eclipse plus C18 column (150 x 4.6mm, 5μm) with a mobile phase composed of 10mM Ammonium acetate: methanol (40:60 v/v) in isocratic mode at a detection wavelength was fixed at 268nm. The retention time of PAZ was 2.2 minutes and the method showed a good linearity in the concentration range of 20μg/mL to 300μg/mL with linear regression equation y = 9987x + 19893 and correlation coefficient 0.999. The limit of detection (LOD) and limit of quantitation (LOQ) were found to be 0.396 and 1.200 µg/mL respectively. The method was validated for accuracy, specificity, linearity, limit of detection, limit of quantification, precision, robustness and stability. All the validation parameters were within the compendial requirements. The proposed method was successfully adopted for the analysis of Pazopanib Hydrochloride (PAZ) in bulk, pharmaceutical dosage forms and in dissolution samples.
Keywords: Pazopanib hydrochloride, RP HPLC-PDA Method Validation, Dissolution Studies, Agilent Zorbax Eclipse plus C18 column, LC-MS compatibility.
_____________________________________________________________________________________________
INTRODUCTION
Pazopanib is a multityrosine kinase inhibitor that blocks tumour growth and inhibits angiogenesis. It inhibits vascular endothelial growth factor receptor (VEGFR)1, VEGFR2, VEGFR3, platelet derived growth factor receptor (PDGFR) α and β , fibroblast growth factor receptor (FGFR) 1 and 3,cytokine receptor (Kit), interleukin 2 receptor,inducible Tcell kinase (Itk), leukocyte specific protein tyrosine kinase (Lck) and transmembrane glycoprotein receptor tyrosine kinase (cFms). It is approved by numerous regulatory administrations worldwide like FDA, EMA, MHRA and TGA for use as a treatment for advanced/metastatic renal cell carcinoma and advanced soft tissue sarcomas in patients who have been treated with chemotherapy. Also it is found to be therapeutically active against ovarian and non-small cell lung cancer 3, 4. Due to the rarity of advanced or metastatic RCC, pazopanib has been designated as an orphan Drug on 24 March 2009 by Therapeutic Goods Administration (TGA),Australia5. Literature review reveals one visible spectrophotometric method and very few liquid chromatographic methods have been reported for quantitative estimation of PAZ in tablet dosage forms and biological fluids 6,7,8,9,10,11,12. However, no validated LCMS compatible reversed-phase high-pressure liquid chromatographic method equipped with photodiode array detector was reported so far for the estimation of PAZ in bulk, pharmaceutical dosage forms and in in vitro dissolution samples. Hence, the present paper aimed at the development of a new rapid, sensitive and validated RP HPLC-PDA method for the analysis of PAZ in bulk, pharmaceutical dosage forms and in in vitro dissolution samples which are LC-MS compatible and economical.
EXPERIMENTAL SECTION
Chemicals
Pazopanib reference sample was a gift from MSN Labs Ltd, Hyderabad. HPLC grade chemicals and reagents include Glacial acetic acid, Ammonium acetate, Acetonitrile, water and methanol were purchased from E. Merck, Mumbai, India. Pazopanib Hcl is commercially available as Votrient® marketed by GSK Rx India with a labeled claim of 200 mg per tablet.
Equipment
An Agilent Infinity 1260 HPLC system equipped with quaternary pumps G1311C, degasser G4225A, auto sampler G1329B, thermostated column compartment G1316A and PDA detector G4212B was used. The software used for data acquisition was OpenLAB CDS EZChrom A.04.05 .The chromatographic analysis was performed on Agilent Zorbax Eclipse plus C18 column (150 x 4.6mm, 3.5μm).
Chromatographic Conditions
Mobile phase composition is 40:60 v/v 10mM ammonium acetate: methanol was used in isocratic mode at 1 mL/min flow rate and the mobile phase was filtered through 0.45μm Nylon disc filter of (Millipore) and sonicated for 10 min before use. Injection volume was 20μL and detection was performed at 268nm at 40oc temperature.
Preparation of Stock Solution and calibration standards: An accurately weighed quantity of PAZ (25 mg) was transferred to a 25 ml volumetric flask, dissolved and diluted to the mark with mobile phase to obtain a standard stock solution of 1mg/mL. The resulting 1mg/mL solution was filtered through 0.2 micron filter and sonicated for about 10 minutes. Aliquots of 0.2, 0.4, 1, 1.5, 2, 2.5, 3 ml standard stock solution was transferred to 10 ml of volumetric flasks and made up to the mark with mobile phase to get concentration of 20, 40, 100, 150,200,250,300μg/ml. An aliquot (20μl) of each solution was injected under the operating chromatographic conditions and responses were recorded. Calibration curve was constructed by plotting the peak areas versus the concentration and the regression equation was calculated. The standard solution was prepared by transferring 2 ml of 1mg/mL to the 10 ml of volumetric flask and made up to the mark with mobile phase to get 200μg/ml.
Method validation
The optimized chromatographic method was completely validated according to ICH guidelines Q2 (R1) for the validation of analytical methods (ICH, 2005).
System suitability test
Linearity
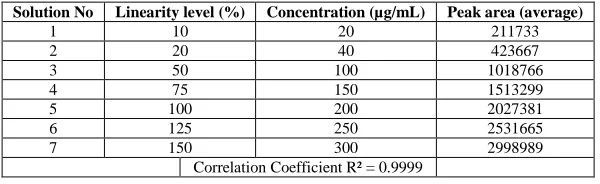
Standard calibration solutions (20 to 300 μg mL−1) for the assessment of linearity were prepared from stock solution using the mobile phase. The solutions were filtered through a 0.45-μm nylon disc filter and then injected in triplicate into the HPLC system. Linearity was evaluated by plotting peak areas as function of analyte concentration, and the test results were evaluated by statistical methods where in slope, intercept, regression coefficient (R2) and correlation coefficient (R) were calculated by method of linear least squares. The data was given in Table 3.
Precision
Precision of the method is expressed in terms of the closeness of the data values to each other for a number of measurements under the same analytical conditions. Repeatability was assessed by using a minimum of six determinations at 100% of the test concentration. The standard deviation and the relative standard deviation were reported for precision. Less than 2% RSD for peak areas indicate the precision of the developed method and the data was presented in Table 4.
Specificity
Specificity of the HPLC method was demonstrated by the separation of the analysts from other potential components such as impurities, degradants or excipients. It was demonstrated by comparing representative chromatograms of diluent, placebo, drug substance and sample. Specificity is indicated by the absence of interference of excipients in the tablet with the retention time of the drug.
Accuracy
For the accuracy of the proposed method, recovery studies were performed by the standard addition method at three different levels (80%, 100% and 120% of final concentration). A known amount of standard pure drug was added to preanalyzed tablet powder and the sample was then analyzed by the proposed method. Results of recovery studies were found to be satisfactory and reported in Table 5.
Limit of detection and Limit of quantification
Limit of detection (LOD) and Limit of Quantification (LOQ) were determined by using the formula based on the standard deviation of the response and the slope. LOD=3.3*SD/S and LOQ=10*SD/S, where SD = standard deviation, S= slope of the calibration curve from the regression equation
Robustness
The robustness of the method was evaluated by analyzing the chromatographic parameters after varying the flow rate (± 0.1 ml/min) and pH of the mobile phase (± 0.2), organic solvent content (± 2.5% v/v). The percentage of the relative standard deviation (%RSD) of the experiment was calculated to assess the robustness of the method. Although the changes in the retention time were significant, yet quantitation was possible. The results were represented in Table 6.
Assay
Ten tablets (Votrient®- GSK Rx India) were accurately weighed and then powdered. Tablet powder equivalent to 200mg of Pazopanib was transferred into a 100ml volumetric flask small amount of the mobile phase is added to dissolve and then the volume is made up to the mark. Then it was sonicated with intermediate shaking. Centrifuge the resulting solution at 4000 rpm for 10 minutes. Pipette out 1 ml of the solution and made up to 10 ml with diluent to get the 200µg/mL concentration of pazopanib. After filtering the sample through 0.2 micron filter and the filtrate was analyzed in triplicate. The amount present in the each tablet was quantified by comparing the area of standard with that of the sample. The results were represented in Table 7.
Dissolution Analysis
RESULTS AND DISCUSSION
Method Development
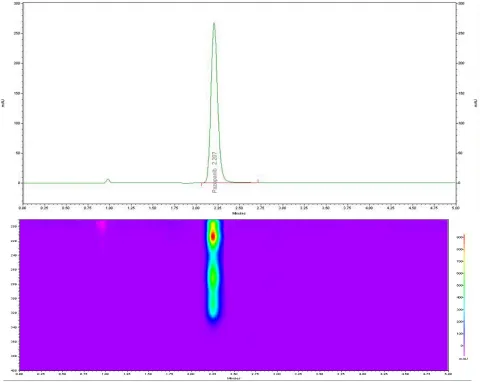
[image:4.612.70.550.276.658.2]The present study was aimed at developing a new, rapid, sensitive and accurate RP HPLC method for the analysis of PAZ in bulk drug and in dosage formsand in in vitrodissolution samples. Initially, several different binary elution systems were tried. It was observed that the peak of PAZ was unsatisfactory with tailing factors >2 either with acetonitrile : water or methanol : water on Phenomenex C18 column (150 x 4.6 mm, 5μm). For developing LC-MS friendly method, mobile phase consisting mixture of LC-MS compatible binary mixture, 10 mill molar Ammonium acetate: methanol (40:60 v/v) in isocratic elution mode was used. When the pH of the 10mM Ammonium acetate was adjusted to 4 using glacial acetic acid and used with methanol in the ratio of (40:60 v/v), it produced a sharp and symmetric peak with and mean retention time 2.2 min.
Figure 1: Chromatogram of Pazopanib standard -100 μg/mL.
Reproducibility is achieved on Agilent Zorbax Eclipse plus (100*46mm*3.5µm) column when analyzed at 268nm. The peak purity curve at the elution time indicated that there was no interference with the peak of PAZ as the peak purity of the PAZ was one unit Figure 5. This optimized method was validated as per ICH guidelines. The system suitability parameters observed by using this optimized conditions were reported in Table 1.
Figure 3: Three dimensional view of chromatogram of Pazopanib standard -100 μg/mL
Figure 4: UV spectrum of of Pazopanib standard at retention time 2.2 min
Method validation
Table 1 Optimized Chromatographic Conditions
Chromatographic mode RP-HPLC
Detector PDA detector
Stationary phase Agilent Zorbax Eclipse plus C18 (100*46mm*3.5µm).
Mobile phase Methanol: 10mM Ammonium Acetate buffer pH 4 adjusted with glacial acetic acid in the ratio 60:40
Detection wavelength 268.0 nm
Flow rate 1.0 mL/min
Injection volume 20 µl
Column temperature 40oc
System suitability
System suitability is an integral part of the validation of analytical procedures. System suitability studies were carried out by injecting six times a 100 μg/ml standard concentration of pazopanib hcl at 20µl injection volume. The RSD values for system suitability test parameters like retention time [Rt = 2.209 (0.03)], tailing factor [Tf = 1.11 (0.88)] and theoretical plate number [3952 (0.80)] were less than 2% indicating the present conditions were suitable for the analysis of pazopanib hcl. The data was given in Table 2.
Table 2: System suitability testing of Pazopanib
Injection Rt Peak Area USP Plate count USP Tailing
1 2.207 10187083 3944 1.12
2 2.205 10187147 3899 1.11
3 2.208 10188450 3950 1.13
4 2.209 10186099 3897 1.11
5 2.210 10188708 3920 1.11
6 2.207 10186289 3867 1.13
Mean 2.207 10187296 3912 1.11
SD 0.00 1080.73 31.45 0.00
% RSD 0.03 0.52 0.80 0.88
Linearity
Linearity was evaluated by analyzing different concentrations of the standard solutions of the pazopanib hcl. The response was a linear function of concentration over the range 20 to 300μg/ml which was used as the working range of the method. 20µl of each solution was injected in triplicate, peak area and concentration were subjected to linear least-squares regression analysis to calculate the calibration equation and correlation coefficient (Table 3). The linearity of the calibration plots was confirmed by the high value of correlation coefficients (R2 = 0.9999).
Table 3: Linearity testing of Pazopanib
Solution No Linearity level (%) Concentration (µg/mL) Peak area (average)
1 10 20 211733
2 20 40 423667
3 50 100 1018766
4 75 150 1513299
5 100 200 2027381
6 125 250 2531665
7 150 300 2998989
Correlation Coefficient R² = 0.9999
Precision
[image:6.612.157.457.509.601.2].
[image:7.612.196.420.311.420.2]Figure 6: Calibration curve of Pazopanib standard
Table 4: System precision of PAZ standard and Method precision of PAZ sample
System precision Method precision
Injection no. Peak area Sample no. Assay percent
1 2030515 1 98.4
2. 2027401 2. 99.5
3 2029836 3 100.7
4 2029348 4 102.1
5 2027997 5 100.8
6 2028110 6 99.5
Mean 2028867.83 Mean 100.16
SD 1213.69 SD 1.29
%RSD 0.06% %RSD 1.30
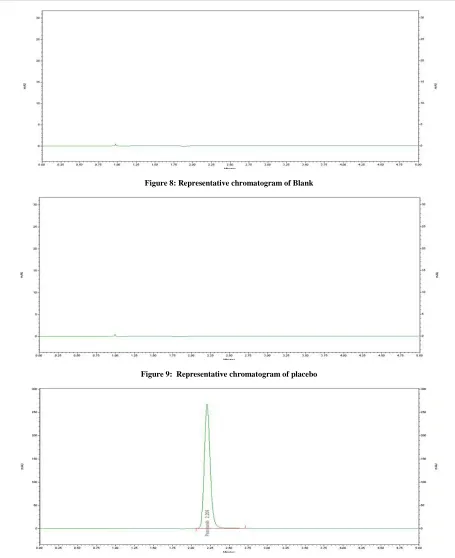
Specificity
[image:7.612.96.521.507.676.2]The specificity of the analytical method was established by injecting the 20µl solutions of diluent, placebo, standard, sample individually to investigate interference from the representative chromatograms in figures 7,8,9 and 10. It can be inferred that there were no co-eluting peaks at the retention time of pazopanib, this shows that peak of analyte was pure and the excipients in the formulation did not interfere with the analysis and the peak purity indices for the sample and standard was found to be greater than 0.9999 and this confirms the specificity of the method.
Figure 7: Representative chromatogram of Pazopanib standard
y = 9987x + 19893
R² = 0.9999
0
500000
1000000
1500000
2000000
2500000
3000000
3500000
0
100
200
300
400
P
eak
ar
ea
Figure 8: Representative chromatogram of Blank
Figure 9: Representative chromatogram of placebo
Figure 10: Representative chromatogram of Pazopanib sample
Accuracy
are displayed in Table 5. The mean percentage recovery values, close to 100%, and their low %RSD values indicated the high accuracy of the analytical method.
Table 5: Recovery studies of pazopanib
% RecoveryLevel % Recovery (n=3) Mean Recovery ± SD, ± %RSD Overall Mean Recovery± SD, ± %RSD
80 99.67 100.14 100.33 100.04±0.339,±0.34
100.03±0.565, ±0.56
100 98.89 99.13 99.40 99.47±0.385,±0.39
120 100.11 100.2 100.5 100.60±0.463, ±0.46
Limit of detection (LOD)and Limit of Quantification (LOQ)
These were determined by using the formula based on the standard deviation of the response and the slope. LOD and LOQ were calculated by using equations, LOD=3.3*SD/S and LOQ=10*SD/S, where SD = standard deviation, S= slope of the calibration curve. From the regression equation, it was calculated that the LOD is 0.396 µg/mL, the drug peak could be detected without any base line disturbances at this concentrationand LOQ is 1.200 µg/mL.
Robustness
The method remained unaffected by deliberate small changes in parameters like flow rate, pH and mobile phase composition. Below tabulated percent RSD values of percent assays and retention times were within the tolerance limits and indicate that the method is robust in terms of changed flow rate, mobile phase and pH. The data was presented in the Table 6.
Table 6: Robustness studies of pazopanib
Parameter Study condition Percent assay mean ± SD %RSD of
% Assay Rt ± SD % RSD of R
t
Original Used Level
Mobile phase ratio (Methanol:buffer) 60:40
57.5:42.5 −1
95.45 ± 0.616 0.65 2.221 ± 0.032 1.47
60:40 0
62.5:37.5 +1
Flow rate (mL min−1) 1.0
0.9 −1
101.05±0.743 0.74 2.210 ± 0.027 1..23
1.0 0
1.1 +1
pH 4.0
3.8 −1
95.52±1.000 1.05 2.212 ± 0.024 1.10
4.0 0
4.2 +1
Assay
Analysis of PAZ tablets was performed by the proposed method and the percent assay of the formulation was calculated in triplicate, which was about 101.08 ± 1.23. These results indicate that the present HPLC method can be successfully used for the assay of PAZ in bulk and dosage forms.
Stock Solution stability
The solution stability study was conducted at different time intervals for stock solution. It was concluded that the stock solution was found stable up to 48 hr at refrigerated temperature (8±1°C). The percent variation in assay values at different time intervals were found to be less than 2 of the initial zero time interval solution, thus indicating that the solutions were stable for a period of 48hrs when stored at 8°C.
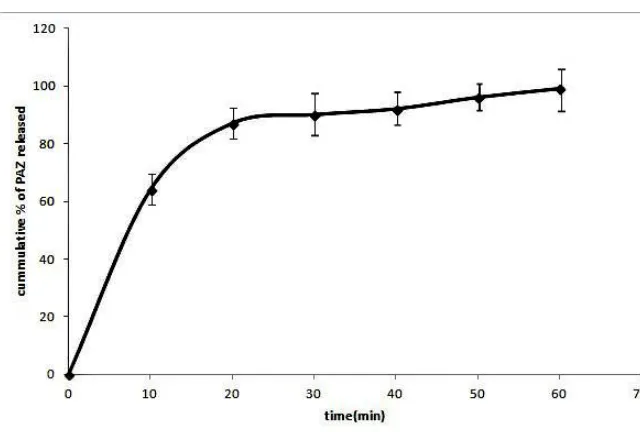
Dissolution analysis of marketed product
Figure 11: In vitro dissolution profile of marketed pazopanib tablets
CONCLUSION
The present analytical method was a simple, quick and efficient RP HPLC-PDA method and was developed for the analysis of PAZ in bulk, dosage forms and in dissolution samples. The method was validated as per International Conference on Harmonization (ICH) guidelines, and found to be applicable for routine quality control analysis for the estimation of PAZ in marketed tablets and in dissolution samples using reverse phased isocratic binary mode of elution. The results of linearity, precision, accuracy and specificity proved to be within the limits. The method provides exclusive estimation of PAZ without interference from diluents and placebo. By this method, it is possible to study the dissolution profile of PAZ without any additional pre-treatment.
Acknowledgements
The authors are thankful to MSN Laboratories Pvt. Ltd, Hyderabad for providing gift sample of drug, University College of Pharmaceutical Sciences, Andhra University, Visakhapatnam for its facilities and Science and Engineering Research Board (SERB), Government of India for its research funding.
REFERENCES
[1]US Food and Drug Administration. Center for Drug Evaluation and Research. Application number: 24-465: Summary review. From FDA website. Retrieved May 31, 2015.
[2]GlaxoSmithKline.Votrient (pazopanib hydrochloride) tablets prescribing information. Research Triangle Park, N. p., 2015. Web. 3 June 2015.
[3] FierceBiotech,. 'Pazopanib Shows Encouraging Activity In Several Tumour Types, Including Soft Tissue Sarcoma And Ovarian Cancer'. N. p., 2015. Web. 3 June 2015.
[4] Sleijfer S; Ray-Coquard I; Papai Z; Le Cesne A; Scurr M; Schoffski P; Collin F; Pandite L. et al. J.of Clinical Oncology., 2009, 27(19), 3126-3132.
[5] Therapeutic Goods Administration (TGA),. 'Auspar: Pazopanib Hydrochloride'. N. p., 2015. Web. 3 June 2015. [6] Asadulla Khan; J.Venkateswara Rao; Ravi Pratap Pulla; Suresh Kumar Sudam; K.Sujana. Int. J.of Advances in Pharmaceutical Analysis., 2013,3(1), 24-29.
[7]S.Susena; K.Vanitha Prakash; P.Ravi Pratap; B.Umashankar; E.Manasa. Int.J.of Pharmaceutical, Chemical and Biological Sciences., 2013, 3(3), 533-537.
[8] Escudero-Ortiz V; Pérez-Ruixo JJ; Valenzuela B; J.of Therapeutic Drug Monitoring. 2015, 37(2), 172-9. [9] S. Karmarkar; R. Garber; Y. Genchanok; S. George; X. Yang, and R. Hammond. J.of Chromatographic Science.,
2011, 49, 439-446.
[11] Lutz Götze; Axel Hegele; Stephan Klaus Metzelder; Harald Renz; Wolfgang Andreas Nockher. J.of Clinica Chimica Acta., 2012, 413(1-2), 143–149.