Journal of Chemical and Pharmaceutical Research, 2016, 8(2):324-329
Research Article
CODEN(USA) : JCPRC5
ISSN : 0975-7384
Development and validation of analysis method for tablet ibuprofen by thin
layer chromatography-densitometry
Harrizul Rivai
1*, Widya Kardela
2and Anita Kartanti
21
Faculty of Pharmacy, Andalas University, Padang, West Sumatra, Indonesia
2School of Pharmaceutical Sciences, Padang, West Sumatra, Indonesia
_____________________________________________________________________________________________
ABSTRACT
A simple, selective and accurate thin layer chromatography (TLC)-densitometry method has been developed and validated for analysis of ibuprofen in pharmaceutical preparations. Ibuprofen assay was performed by TLC-densitometry using silica gel 60 F254 plates as the stationary phase and a mixture of chloroform: methanol (10: 1) as
the best mobile phase. Standard solution of ibuprofen in the range of 2-10 mg/mL resulted in a regression equation y = 14293.868 + 4201.72x with r = 0.9973. Ibuprofen detection limit was 0.88 mg/mL and the limit of quantification of ibuprofen was 2.70 mg/mL. Accuracy in generic ibuprofen tablets of PT Indo Farma and ibuprofen tablets under the trade name Proris® of PT Pharos had percent recovery range which meets 80-110 %. Precision intraday and interday had good repeatability as RSD ≤ 2 %. The analysis showed levels of ibuprofen on a generic tablet of 97.56 % ± 0.59 % and ibuprofen tablets under the trade name Proris® of 101.76 % ± 2.02 %. The levels ibuprofen obtained have suitably qualified Indonesian Pharmacopoeia edition V i.e. 90-110 %.
Keywords: ibuprofen, thin layer chromatography, densitometry, validation
_____________________________________________________________________________________________
INTRODUCTION
Ibuprofen is a simple derivative of phenylpropionic acid with the chemical formula (±)-2-(p- isobutyl phenyl) propionic acid (Fig. 1), the molecular formula C13H18O2 and a molecular weight of 206.28 [1]. This drug is more
than 99 % protein bound and has a half-life of one to two hours. Ibuprofen thoroughly metabolized in the liver, and less is excreted unchanged form [2].
Fig. 1: Chemical structure of ibuprofen
The assay of ibuprofen in tablets is usually carried out by high performance liquid chromatography as Indonesian Pharmacopoeia [1]. Literature survey revealed that several methods were used to analysis of ibuprofen in tablets. These methods include ultraviolet-visible spectrophotometer [5, 6, 7], thin layer chromatographic–densitometry assay [8], high performance liquid chromatography [9, 10], and derivative ultraviolet spectrophotometer [11].
The aim of this study is performing very simple method in terms of mobile phase and program to analysis ibuprofen in tablet, and validation of method in according to ICH guideline [12].
EXPERIMENTAL SECTION
Materials, chemicals and equipment
The materials used in this study were the Ibuprofen raw material obtained from Hubei Pharmaceutical Co. Ltd. Generic tablet containing ibuprofen 200 mg of PT Indo Farma (No. Batch CD3F023) and ibuprofen tablets under the trade name Proris® containing ibuprofen 200 mg of PT Pharos (No. batch C4G580B BN) were procured from local market. Methanol, chloroform, acetone and ethyl acetate were procured from Merck Indonesia. The tools used in this research were the UV lamp 254 and 366 (Camag), TLC Scanner 4 with software Wincat (Camag), Capillary Pipette 5 µL size (Camag), Twin Chamber size 20 x 20 cm (Camag), silica gel plate 60 F254 250 µm (Merck) size 20
x 20 cm, sonicator, vacuum desiccators, digital analytical balance (ABJ 220-4M type), and a filter paper (Whatman No. 41).
Preparation of standard solution
A total of 1,000 mg of ibuprofen was weighed carefully and put in a 100 mL volumetric flask, then dissolved in methanol while stirring and add methanol to the mark. The ibuprofen solution contains 10 mg/mL or 10,000 ppm.
Method Development
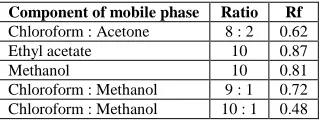
[image:2.595.227.387.446.507.2]Ibuprofen solution was prepared using chloroform as solvent. The TLC plates were pre washed with methanol and activated by keeping at 115 °C for about 30 minutes. Solutions of 5.0 µL were applied on the TLC plates as using Camag Nanomat 4. Application positions were at least 10 mm from the sides and 10 mm from the bottom of the plates. Mobile phase components were mixed prior to use and the development chamber was left to saturate with mobile phase vapor for 15 minutes before each run. Mobile phase components were listed in Table 1.
Table 1: Component of mobile phase used in TLC of ibuprofen analysis
Component of mobile phase Ratio Rf
Chloroform : Acetone 8 : 2 0.62
Ethyl acetate 10 0.87
Methanol 10 0.81
Chloroform : Methanol 9 : 1 0.72
Chloroform : Methanol 10 : 1 0.48
Development of the plates was carried out by the ascending technique to a migration distance of 8 cm. The plates were dried by hair dryer. Densitometry scanning was done in absorbance mode at 320 nm using a deuterium lamp. The slit dimensions were set at 6 x 0.30 mm, the scanning speed at 20 mm/s and data resolution at 100 m/step. Single wavelength detection was performed because we are dealing with main component analysis and not impurities determinations where scanning at the individual λ values would be preferred. These conditions were transferred to the TLC system and the results were evaluated with the aim of achieving an optimum separation between spots (Rs ≥ 2) and a migration of spots with Rf values between 0.32 and 0.55 in order to ensure separation reproducibility [13].
Sample Preparation
Generic ibuprofen tablets containing 200 mg ibuprofen and ibuprofen tablets under the trade name Proris® containing ibuprofen 200 mg weighed as much as twenty tablets from each of them and the calculated average weight. The tablets were then crushed and an amount equivalent to the weight of the tablet dissolved in 50 mL of methanol. The solution tablet generic ibuprofen and ibuprofen tablets under the trade name Proris® contains 4 mg/mL, or 4000 ppm. These samples were dissolved with the aid of sonicator and then filtered through a filter paper Whatman No. 41.
Qualitative analysis of sample solution
that had been saturated with mobile phase. Chamber was closed and left so that the mobile phase moves until it reaches the top line. Chamber was opened, the TLC plate was taken and the wind dried then determined the value of Rf.
Quantitative analysis of sample solution
Test solution with a concentration of 4 mg/mL of each sample was spotted as many as three spots with a volume of 5 µL at the start line with a spot distance of 1 cm from each other. The plates were put in a chamber that has been saturated with mobile phase. The chamber was closed and left so that the mobile phase moves until it reaches the top line. The chamber was opened; the TLC plate was taken and dried. Spotting was observed under 254 nm UV lamps. Then spotting was scanned with tools Camag TLC Scanner 4 with a wavelength of 222 nm in order to get the data area under curve of the test compound. The area was included in the regression equation, and then obtained compound content.
Method Validation Linearity
The ibuprofen standard solution was pipette sequentially respectively 2, 4, 6, 8, and 10 mL in 10 mL volumetric flask and added methanol to mark boundaries in order to obtain a concentration of 2, 4, 6, 8, 10 mg/mL. Ibuprofen solutions were applied as much as 5 µL on a TLC plate silica gel 60 F254, then eluted with an eluent to mark
boundaries above and dried at room temperature. The plates were analyzed using a densitometer, so that would be obtained area under curve (AUC) for each concentration. The limits of detection and limits of quantization were calculated from a calibration curve statistically through linear line of the standard curve.
Precision
Testing was done by testing the repeatability as a variation in a day. The levels used in testing precision were 6, 8, 10 mg/mL spotted on silica gel 60 F254 plates with a volume of 5 µL and eluted with eluent and dried. Spotting the
silica plate and then analyzed by a densitometer. AUC data obtained were then calculated the average value, standard deviation (SD) and the relative standard deviation (RSD). The precision was tested with intraday precision for one day in the morning, noon and afternoon, while the precision interday was checked by repeating the research for three consecutive days. Ibuprofen concentration in the sample was calculated by regression equation obtained from the calibration curve.
Accuracy
Recovery studies were performed to check the accuracy of this method. This sample contained 4 mg/mL ibuprofen. Recovery experiments were performed by adding three different amounts of ibuprofen, i.e. 80, 100 and 120 %. These levels were expected to represent the lowest and highest levels of standard curve used. Samples were spotted on a silica gel 60 F254 plates each 3 times application with application volume 5 µL and eluted with the eluent.
Spotting the silica plate was then analyzed by densitometry and the data will be obtained in the form of AUC values of samples that have been added to the standard.
RESULTS AND DISCUSSION
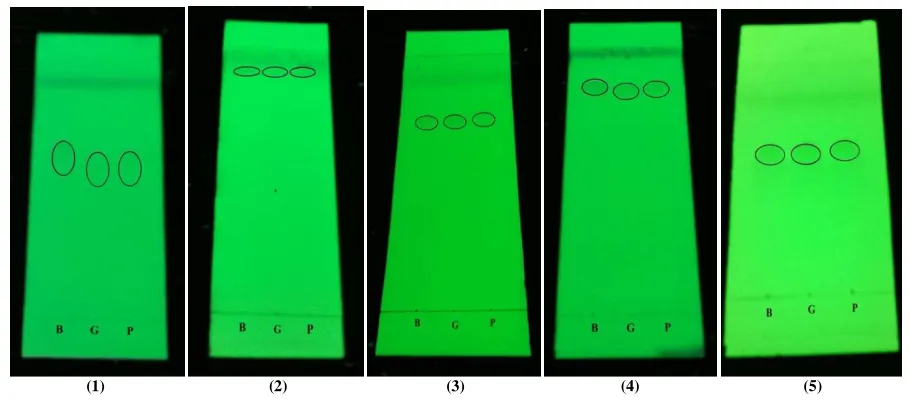
The experimental results showed the best mobile phase that can be used for analysis of ibuprofen was chloroform : methanol (10 : 1), because once used as a mobile phase for 3 consecutive days Rf value obtained was stable and enter the range of 0.48 (Table 1). Qualitative analysis of samples showed that ibuprofen contained in the two samples (Fig. 1).
(1) (2) (3) (4) (5)
Fig. 1: Thin layer chromatogram with the mobile phase (1) chloroform: acetone (8: 2); (2) ethyl acetate; (3) methanol; (4) chloroform: methanol (9: 1); (5) chloroform: methanol (10: 1) seen with 254 nm UV light. B = Standard ibuprofen; G = Tablets generic ibuprofen and
P = Ibuprofen tablets under the trade name Proris®
[image:4.595.114.498.315.582.2].
Fig. 2: Calibration curve of ibuprofen
Table 2: Results of method validation
Parameter Ibuprofen
Linearity range 2-10 mg/mL
Correlation coefficient 0.9973
Regression Equation Y = 14293.87 + 4201.72 X
LOD 0.89 mg/mL
LOQ 2.70 mg/mL
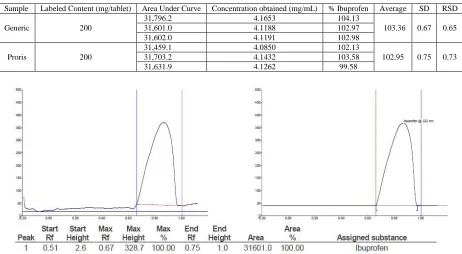
The results of analysis with TLC Scanner method showed that the levels of generic ibuprofen tablets and ibuprofen tablets under the trade name Proris® accordance with the provisions of Ministry of Health of the Republic Indonesia (Table 3) [1]. Densitogram of generic ibuprofen and Proris samples were shown in Figs. 3 and 4.
0 10000 20000 30000 40000 50000 60000
- 2.0 4.0 6.0 8.0 10.0 12.0
A
re
a
U
n
d
e
r
C
u
rv
e
Table 3: The results of measurements of samples ibuprofen
Sample Labeled Content (mg/tablet) Area Under Curve Concentration obtained (mg/mL) % Ibuprofen Average SD RSD
Generic 200
31,796.2 4.1653 104.13
103.36 0.67 0.65
31,601.0 4.1188 102.97
31,602.0 4.1191 102.98
Proris 200
31,459.1 4.0850 102.13
102.95 0.75 0.73
31,703.2 4.1432 103.58
[image:5.595.85.524.386.556.2]31,631.9 4.1262 99.58
Fig. 3: Densitogram samples of generic ibuprofen 5 µL volume applications, mobile phase chloroform: methanol (10: 1), at a wavelength of 222 nm
Fig. 4: Densitogram samples of Proris 5 µL volume applications, mobile phase chloroform: methanol (10: 1), at a wavelength of 222 nm
The test results show that the accuracy of ibuprofen recoveries were in the range allowed (80-110%). So this proves that this method gives accurate results (Table 4 and 5).
Table 4: Recovery of ibuprofen from generic tablet
% Added
Concentation of standard added
(mg/mL)
Area Under Curve
Concentration after standard addition
(mg/mL)
Concentration before standard addition
(mg/mL)
%
Recovery Average SD RSD
80 3.19
45,089.9 7.33
3.98
105.14
105.39 0.42 0.40
45,187.9 7.35 105.87
45,091.5 7.33 105.15
100 3.98
47,482.7 7.90
3.98
98.41
98.76 0.56 0.57
47,489.6 7.90 98.45
47,648.7 7.94 99.41
120 4.78
52,594.0 9.12
3.98
107.47
106.42 0.92 0.86
52,249.1 9.05 105.75
[image:5.595.64.546.637.757.2]Table 5: Recovery of ibuprofen from Proris tablet
% Added
Concentation of standard added
(mg/mL)
Area Under Curve
Concentration after standard addition
(mg/mL)
Concentration before standard addition
(mg/mL)
%
Recovery Average SD RSD
80 3.32
45,051.8 7.32
4.15
95.48
97.58 1.83 1.88
45,457.2 7.42 98.39
45,524.3 7.43 98.87
100 4.15
49,341.3 8.34
4.15
100.99
101.32 0.82 0.81
49,295.1 8.33 100.72
49,562.5 8.39 102.26
120 4.98
52,473.6 9.09
4.15
99.12
100.05 0.84 0.84
52,716.4 9.14 100.28
52,815.8 9.17 100.76
CONCLUSION
In this work, TLC technique was developed and validated for the analysis of ibuprofen in pharmaceutical tablets. The proposed method was simple, accurate and highly selective for ibuprofen. The satisfactory sensitivity and simplicity make the methods suitable for routine analysis of ibuprofen in quality control laboratories.
Acknowledgements
The authors thank to Head of Central Laboratory, University of Andalas, Padang 25168, West Sumatra, Indonesia for facilities of this work.
REFERENCES
[1] Kementerian Kesehatan Repulik Indonesia. Farmakope Indonesia, Edisi 5, Kementerian Kesehatan RI, Jakarta, 2014, 542-545.
[2] BG Katzung (Ed.), Basic & Clinical Pharmacology, 9th Edition, Lange Medical Books, London, 2003. [3] C Kumaresan, International Journal of Current Pharmaceutical Research, 2010, 2(3), 1-3.
[4] European Medicines Agency. European Medicines Agency starts review of ibuprofen medicines, London: European Medicines Agency, 2014, www.ema.europa.eu
[5] S Sunaric; M Petkovic; M Denic; S Mitic; A Pavlovic, Acta Poloniae Pharmaceutica - Drug Research, 2013, 70(3), 403-411
[6] N Narendra; GS Jeyabalan; K Mukesh; K Naresh; S Gurpreet, International Research Journal of Pharmacy, 2012, 3(4), 277-280.
[7] BR Kesur; VR Salunkhe; CS Magdum, Int J Pharm Pharm Sci, 2012, 4(4), 271-274.
[8] M Starek; J Krzek, Journal of Chromatographic Science, 2010, 48(November/December), 825-829. [9] D Wilhelm, Application Note, 2010, www.agilent.com/chem/1120.
[10] MB Alsirawan; MA Mohammad; B Alkasmi; K Alhareth; M El-Hamidi, Int J Pharm Pharm Sci. 2013, 5(4), 227-231.
[11] VD Hoang; DTH Ly; NH Tho; HMT Nguyen, The Scientific World Journal. Volume 2014, Article ID 313609, 13 pages, http://dx.doi.org/10.1155/2014/313609
[12] International Conference on Harmonization (ICH). Validation of Analytical Procedures, Text and Methodology, Q2 (R1), 2005