© 2017, IRJET | Impact Factor value: 5.181 | ISO 9001:2008 Certified Journal
| Page 1598
Experimental and CFD Analysis of Exhaust Manifold to Improve
Performance of IC Engine
Mr. SACHIN G. CHAUDHARI
1, Mr. PARAG N. BORSE
2, Mr. RAGHUNATH Y. PATIL
31
M.E. Student, Dept. Of Mechanical Engineering, SGDCOE, Jalgaon (MS), India.
2
Asso. Prof. Dept. Of Mechanical Engineering, SGDCOE, Jalgaon (MS), India.
3
Head and Asso. Prof. Dept. Of Mechanical Engineering, SGDCOE, Jalgaon (MS), India.
---***---Abstract -Exhaust manifold collect the exhaust gases from
the engine cylinders and discharge to the atmosphere through the exhaust system. The engine efficiency, combustion characteristics would depend upon how the exhaust gases were removed from the cylinder. The design of an exhaust manifold for the internal combustion engine depends on many parameters such as exhaust back pressure, velocity of exhaust gases etc. In this paper, the recent research on design of exhaust manifold, their performance evaluation using experimental methods as well as Numerical methods (CFD), various geometrical types of exhaust manifold and their impact on the performance has been collected and discussed.
Key words: Exhaust Manifold, Engine Efficiency, Back Pressure, Numerical Method, Experimental Method.
1. INTRODUCTION
The exhaust system of an IC engine has a significant influence on the global engine operation. Among the different component of the system the exhaust Manifold has a paramount relevance on the gas exchange process. Though the intake system is dominant on the cylinder filling process, the exhaust manifold is able to influence the gas exchange process in several aspects, like the piston work during the exhaust stroke, the short-circuit of fresh charge from the intake into the exhaust and even the filling of the cylinder. In this sense, the most influential boundary condition imposed by the manifold is the pressure at the valve and especially the
instantaneous pressure evolution. The mean
backpressure is determined mainly by the singular elements, such as the turbine, the catalytic converter and the silencer. The instantaneous pressure evolution imposed by the manifold at the exhaust valve depends essentially on the layout and dimensions of the pipes, therefore an adequate design of the manifold geometry can improve the engine power and efficiency, and reduce the emissions of pollutants. Exhaust manifold design parameters are
Minimum possible resistance in runners.
1) Properly design of Manifold geometry to reduce
the pressure drop.
2) Eliminate the unnecessary turbulence & eddies in the manifold.
2. EXPERIMENTATION
Experimentation on Diesel engine Test rig For various manifold geometries are attached to engine one by one. First will take experiment on existing model which is T-section. This experiment is conducted at SGDP College, Jalgaon, India. Every geometry is observed under different loads, Speed and Water flow rate of the engine take constant.
Table 1: Engine Specifications:
1 Engine type Single cylinder, four stroke
compression ignition engine
2 Rated power
output 5 H.P.
3 Speed 1500 R.P.M.
4 Stroke length 110 mm
5 Bore diameter 80mm
6 Type of
dynamometer Rope brake dynamometer
7 Lubricant SAE 30/40
8 Orifice diameter
(for air box) 15mm
9
Co-efficient of discharge for orifice
0.64
10 Diameter of rope
brake Drum 250mm
© 2017, IRJET | Impact Factor value: 5.181 | ISO 9001:2008 Certified Journal
| Page 1599
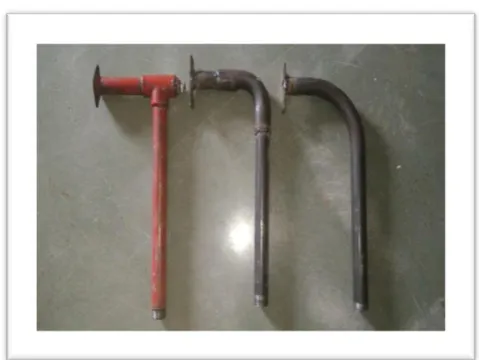
Figure 1: Different Geometries, 1) Sharp Bend 2)ShortBend and 3) Long Bend.
3. Sample Calculations (sharp bend), 2 Kg load.
1) Torque (T):
T = (W-S)* Re = 2.67 N.m
2) Brake Power (BP):
3) Measurement of fuel consumption ( ):
4) Brake Thermal Efficiency ) :
5)Heat Supplied by combustion ) :
=8.4 KJ/s
6) The heat carried away by Jacket cooling water ):
)
=0.083*4.187 * (28 — 24)
= 1.39 KJ/s
4) Measurement of Air consumptions ):
√
Density of air,
=1.1729 Kg/m3
& ha= hw / ha =68.20 m of air
Ma=0.00483 Kg/s
7) Heat carried away by the exhaust gas ) :
)
= 0.00509* 1* (139 — 28)
= 0.2392 KJ/s
8) Heat Supplied by combustion ) :
= 8.4 KJ/s
)
9) Heat utilised in Brake power ):
= 4.98 %
10) Heat carried away by Jacket cooling water ):
= 16.54 %
11) Heat carried away by the exhaust gas ):
© 2017, IRJET | Impact Factor value: 5.181 | ISO 9001:2008 Certified Journal
| Page 1600
= 2.84 %
12) Heat Unaccounted for ):
) )
= 75.59 %
[image:3.595.310.564.141.595.2]4. Experimental results and Calculations:
Table 2 : Computation of percentage of heat balance sheet of C.I. engine, various load conditions and at
constant RPM - 1500.
S r . N o . Experi mental Model Lo ad ( W ) in Kg Heat Tota l supp lied in KJ/s Perce nt of heat equiv alent to brake Powe r in % Perce nt of heat carri ed away by Jacke t cooli ng wate r in % Perc ent of heat carri ed awa y by exha ust gase s in % Perce nt of heat for unacc ounte d in % 1 Sharp Bend
2 8.40 4.98 16.54 2.84 75.59
2 4 8.66 9.73 19.97 2.82 67.43
3 6 8.96 14.14 27.12 2.67 56.13
4
Short Bend
2 7.90 5.30 21.88 6.99 65.81
5 4 8.12 10.38 29.92 6.94 52.74
6 6 8.40 15.08 33.09 6.78 45.03
7
Long Bend
2 7.26 5.76 28.63 7.50 58.08
8 4 7.48 11.25 37.12 7.43 44.17
9 6 7.68 16.49 40.72 7.32 35.54
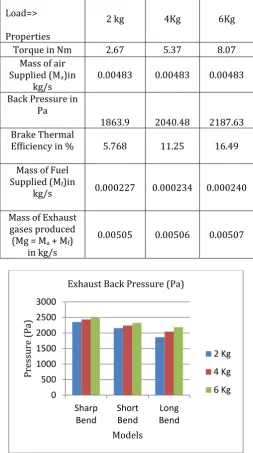
Table 3: Computation of Experimental Results for Long Bend model.
Load=>
Properties
2 kg 4Kg 6Kg
Torque in Nm 2.67 5.37 8.07
Mass of air Supplied (Ma)in
kg/s 0.00483 0.00483 0.00483
Back Pressure in Pa
1863.9 2040.48 2187.63
Brake Thermal
Efficiency in % 5.768 11.25 16.49
Mass of Fuel Supplied (Mf)in
kg/s 0.000227 0.000234 0.000240
Mass of Exhaust gases produced (Mg = Ma + Mf)
in kg/s
0.00505 0.00506 0.00507
Chart 1: Graphical presentation of exhaust back pressure at different loads.
The Chart 1 shows the back pressure variation of different models on different loads. It seen that while using long bend back pressure decreases considerably. The Chart 2 shows that the variations in the brake thermal efficiency of different models on different loads. Considerable increase in brake thermal efficiency is observed while using the long Bend.
0 500 1000 1500 2000 2500 3000 Sharp Bend Short Bend Long Bend Pr es sure ( Pa ) Models
Exhaust Back Pressure (Pa)
2 Kg
4 Kg
[image:3.595.28.293.334.695.2]© 2017, IRJET | Impact Factor value: 5.181 | ISO 9001:2008 Certified Journal
| Page 1601
Chart 2: Graphical presentation of percentage of brakethermal efficiency at different loads.
Chart 3: Graphical presentation of percentage of unaccounted heat at different loads.
The Chart 3 shows that the variation of percentage of Unaccounted heat of different models on different loads. Considerable decrease in unaccounted heat is observed while using long bend.
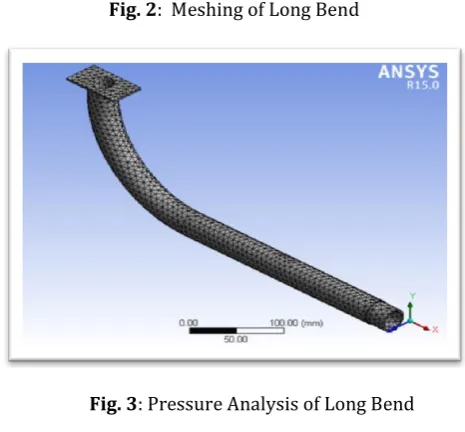
[image:4.595.36.268.101.229.2]5. CFD Analysis
Table 4: Meshing of Long Bend
Object Name Long Bend
Use Advanced Size Function On: Curvature
nodes 14114
Elements 7008
Mesh metric Non
smoothing High
Transition Fast
Fig. 2: Meshing of Long Bend
[image:4.595.320.553.102.318.2]Fig. 3: Pressure Analysis of Long Bend
Fig 3 shows the Pressure variation of Long bend, it is that Pressure at the inlet of the model are exist in different layers, outer part of the bend have slight more Pressure than that of inner part of the body. Pressure at the outer Part of the body is much lower in comparison with sharp bend and short bend which leads to lower the back pressure.
Fig. 4: Velocity Analysis of Long Bend
Fig 4 shows the velocity contour of long bend. Improvement in bend radius affects the velocity of gases, it seen from above fig inlet velocity of the long bend is higher than that other models.
0 10 20
Sharp Bend
Short Bend
Long Bend
% Efficie
nc
y
Model
Brake Thermal Efficiency %
2 Kg
4 Kg
6 Kg
0 20 40 60 80
Sharp Bend
Short Bend
Long Bend
% He
at
Models
% Unaccounted Heat
2 Kg
4 Kg
[image:4.595.37.276.279.429.2] [image:4.595.319.554.555.687.2]© 2017, IRJET | Impact Factor value: 5.181 | ISO 9001:2008 Certified Journal
| Page 1602
6. Validation of ProjectChart 4: Comparison of Experimental and analytical Results
Graph shows Experimental and analytical results. Experimental Results of CI engine are compared with CFD results and results shows that, the sharp bend have high back pressure than other two models. Long bend model is more efficient than sharp bend and short bend.
Conclusion
In this work different Exhaust manifolds were analysed using Experimental and Analytical method. In Experimental method Exhaust back pressure, fuel consumption, brake thermal efficiency, and Heat utilization of different Manifolds on changing load were observed. In analytical method velocity and pressure distribution along the length of exhaust manifold is obtained through simulation. Three different models designed and results were analyzed. The use of different shapes of exhaust manifold helps in easy flow of exhaust. We conclude that,
1. Long bend model facilitates easy flow of exhaust
gases and low backpressure at the exhaust outlet in comparisons with all other two models.
2. The minimum backpressure and higher exhaust
velocities are achieved by using long bend Exhaust manifold.
3. Velocity at the outlet of long bend model is more
and hence the backpressure reduces
considerably.
4. The percentage of unaccounted heat is
decreased considerably when use long bend exhaust model than other two models.
5. Brake thermal efficiency is more of long bend exhaust model in comparison with sharp bend and short bend.
6. Fuel consumption rate decreases when used
long bend exhaust model.
REFERENCES
1) Atul A. Patil, “Experimental Verification And CFD
Analysis Of Single Cylinder Four Strokes C.I.
Engine ExhaustmSystem”, Pratibha:
International Journal Of Science, Spirituality, Business And Technology (IJSSBT), Vol. 3, No. 1, Dec 2014.
2) Dipak D. Patil, “ CFD Analysis of Exhaust System
and Effect of Back Pressure on Engine Performance”, International Journal for Mechanical Engineering, VOL 1 ISSUE 1 September 2015.
3) Prashant P. Bornare, “International Journal Of Science, Spirituality, Business And Technology (IJSSBT)”, Vol. 2, No. 2, May 2014.
4) Mohd Sajid Ahmed, “Design And Analysis Of A
Multi-Cylinder Four Stroke SI Engine Exhaust Manifold Using CFD Technique”, Volume: 02 Issue: 09 | Dec-2015
5) Twinkle Panchal, “Effect of Exhaust Back
Pressure on Exhaust Emissions by Altering Exhaust Manifold Position”, International Journal of Emerging Research in Management &Technology ISSN: 2278-9359 (Volume-3, Issue-11).
6) Peter Hield, “The Effect of Back Pressure on the
Operation of a Diesel Engine”, Maritime Platforms Division DSTO Defence Science and Technology Organisation 506, Lorimer St Fishermans Bend, Victoria 3207 Australia.
7) Paulduray Seeni Kannan, “Design strategy for
six-cylinder stationary diesel engine Exhaust systems”,STROJN´ICKY CASOPIS, 59, 2008, ˇC. 1 8) Jae Ung Cho,A, “Study on Flow Analysis of the
Exhaust Manifold for Automobile”, International Journal of Applied Engineering Research ISSN 0973-4562 Volume 11.
9) Nishant Dhanore, “ Modification in two Stroke Engines for Complete Combustion and Complete Exhaust” International Journal of Science and Research (IJSR) (2013).
10) Xiaomao Zhang,” Simulation and Experiment Investigation on Performance Development of Gasoline Engine”, 4th International Conference on Computer Research and Development, 2012. 11) V. M. Domkundwar, Anand, V. Domkundwar, " A
course in Internal Combustion Engines ",Dhanpat Rai and Company 2006.
12) V. Ganeshan, " Internal Combustion Engines", Tata McGraw-Hill. 2006.VOL 1 ISSUE 1 September 2015.
103000 103500 104000 104500 105000
sharp bend
short bend
long bend
B
ac
k
Pr
es
sure
(
Pa
)
Models
Validation of Back Pressure Results
Analytical