estrogen receptor–negative breast cancer
patients
Sharon A. Glynn, … , Robert M. Stephens, Stefan Ambs
J Clin Invest.
2010;120(11):3843-3854. https://doi.org/10.1172/JCI42059.
Inducible nitric oxide synthase (NOS2) is involved in wound healing, angiogenesis, and
carcinogenesis. NOS2 upregulation and increased nitric oxide (NO) production affect the
redox state of cells and can induce protein, lipid, and DNA modifications. To investigate
whether NOS2 levels influence survival of breast cancer patients, we examined NOS2
expression and its association with tumor markers and survival in 248 breast tumors. In
multivariable survival analysis, increased NOS2 predicted inferior survival in women with
estrogen receptor
a
–negative (ER-negative) tumors. Microdissected tumor epithelium from
ER-negative tumors with high NOS2 had increased IL-8 and a gene expression signature
characteristic of basal-like breast cancer with poor prognosis. In cell culture, NO only
induced selected signature genes in ER-negative breast cancer cells. ER transgene
expression in ER-negative cells inhibited NO-induced upregulation of the stem cell marker
CD44 and other proteins encoded by signature genes, but not of IL-8. Exposure to NO also
enhanced cell motility and invasion of ER-negative cells. Last, pathway analysis linked the
tumor NOS2 gene signature to c-Myc activation. Thus, NOS2 is associated with a basal-like
transcription pattern and poor survival of ER-negative patients.
Research Article
Oncology
Find the latest version:
Increased NOS2 predicts poor survival
in estrogen receptor–negative
breast cancer patients
Sharon A. Glynn,1,2 Brenda J. Boersma,1 Tiffany H. Dorsey,1 Ming Yi,3 Harris G. Yfantis,4 Lisa A. Ridnour,5 Damali N. Martin,1 Christopher H. Switzer,5 Robert S. Hudson,1 David A. Wink,5
Dong H. Lee,4 Robert M. Stephens,3 and Stefan Ambs1
1Laboratory of Human Carcinogenesis, Center for Cancer Research (CCR), and 2Cancer Prevention Fellowship Program, Office of Preventive Oncology,
National Cancer Institute (NCI), Bethesda, Maryland, USA. 3Advanced Biomedical Computing Center, NCI-Frederick/SAIC-Frederick Inc., Frederick,
Maryland, USA. 4Pathology and Laboratory Medicine, Baltimore Veterans Affairs Medical Center, Baltimore, Maryland, USA. 5Tumor Biology Section, Radiation Biology Branch, CCR, NCI, Bethesda, Maryland, USA.
Inducible nitric oxide synthase (NOS2) is involved in wound healing, angiogenesis, and carcinogenesis. NOS2
upregulation and increased nitric oxide (NO) production affect the redox state of cells and can induce protein,
lipid, and DNA modifications. To investigate whether NOS2 levels influence survival of breast cancer patients, we
examined NOS2 expression and its association with tumor markers and survival in 248 breast tumors. In
multi-variable survival analysis, increased NOS2 predicted inferior survival in women with estrogen receptor
α
–negative
(ER-negative) tumors. Microdissected tumor epithelium from ER-negative tumors with high NOS2 had increased
IL-8 and a gene expression signature characteristic of basal-like breast cancer with poor prognosis. In cell
cul-ture, NO only induced selected signature genes in ER-negative breast cancer cells. ER transgene expression in
ER-negative cells inhibited NO-induced upregulation of the stem cell marker CD44 and other proteins encoded
by signature genes, but not of IL-8. Exposure to NO also enhanced cell motility and invasion of ER-negative cells.
Last, pathway analysis linked the tumor NOS2 gene signature to c-Myc activation. Thus, NOS2 is associated with
a basal-like transcription pattern and poor survival of ER-negative patients.
Introduction
Breast cancer is not composed of one single homogeneous disease, but rather is made up of a number of subtypes. Recent results from large-scale gene expression profiling studies showed that estrogen receptor α–negative (ER-negative) and ER-positive breast tumors exhibit large differences in their gene expression signatures (1). These studies revealed that ER-negative and ER-positive tumors should be further subdivided based on their gene expression pro-files. Molecular signatures characterize basal-like, HER2-positive, and normal-like subtypes among the ER-negative tumors and luminal A, luminal B, and luminal C subtypes among the ER-positive tumors. Among them, basal-like breast cancer has been recognized as the most aggressive subtype and the one most dif-ficult to treat. Unlike ER-positive tumors, ER-negative tumors are hormonally unresponsive and not treatable by endocrine-targeted therapy such as tamoxifen and aromatase inhibitors. Patients with ER-negative breast tumors also have a worse prognosis than indi-viduals with ER-positive breast tumors independent of therapy, particularly in the first 5 years following diagnosis (2), with almost twice the risk of death when compared with those with ER-positive tumors (3). There is an urgent need to identify novel targets for the treatment of ER-negative breast cancer in general, and even more for the basal-like subtype. Recently, a causative role of chronic inflammation in the progression of breast cancer has been pro-posed (4, 5). Tumor-infiltrating macrophages and expression of proinflammatory factors such as cyclooxygenase-2 are markers of
poor outcome for the disease, and targeting markers of inflamma-tion in breast cancer may provide new opportunities for therapy in ER-negative breast cancer (6, 7).
Inducible NOS2 is an inflammation-responsive enzyme that is upregulated in acute and chronic inflammation as part of host defense and the wound-healing process (8, 9). Upregulation of this enzyme leads to increased NO production, by which it affects the redox state of cells (10, 11). Aberrant expression of NOS2 has been observed in many types of solid tumors, including breast and colon cancer, and also in melanoma (12–16). NO can both cause DNA damage and protect from cytotoxicity and either inhibit or stimulate cell proliferation and migration as well as apoptosis (17–21). The effect of NO will be dependent on the microenvironment, including tissue oxygen tension and local superoxide concentrations. Thus, NO’s effects in human solid tumors are difficult to predict and are best estimated from the expression analysis of nitric oxide synthase enzymes in these tumors and their association with tumor markers and survival. We and others have previously discovered that NOS2 expression correlates with increased Akt phosphorylation in breast tumors and that NO induces Akt phosphorylation and activation of the oncogenic Akt pathway in breast cancer cells in culture (21, 22). Here, we tested the hypothesis that NOS2 is a predictor of breast cancer survival and examined the mechanism by which NO may induce a poor outcome phenotype. Our approach led to the discov- ery of a relationship between NOS2 expression, increased NO pro-duction, and the induction of a basal-like transcription pattern and poor prognosis in ER-negative breast tumors.
Results
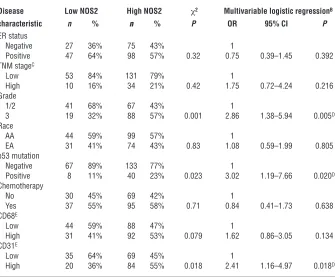
High NOS2 is associated with increased vascularization and prevalence of p53 mutations
tochemically in 248 surgically resected breast carcinoma speci- mens, as previously described by us and others (22, 23). The demo-graphic and clinicopathological features of the patients and the immunohistochemistry (IHC) results are shown in Supplemental Table 1. NOS2 was moderately to strongly expressed in 173 of the 248 breast tumors (70%). The protein was present in both the tumor epithelium and tumor-infiltrating cells (Figure 1). However, only a few tumors showed a marked expression of NOS2 in infiltrating
immune cells, e.g., tumor-infiltrat-ing macrophages, monocytes, and lymphocytes (Figure 1D). We esti-mate that about 10%–20% of the NOS2 immunostaining in these tumors colocalizes with CD11b-positive cells. CD11b is a marker for macrophages, granulocytes, natural killer cells, and blood monocytes. Thus, we conclude that the major source of NO in breast tumors is most likely the tumor epithelium. Next, we exam-ined the relationship of NOS2 with the tumor p53 mutational status, tumor microvessel density, and tumor grade, because others have previously observed relationships between NOS2 and these markers in human cancer (12, 13, 24–26). Consistent with previous reports, high NOS2 expression signifi-cantly correlated with an increased p53 mutation frequency — the first such report in breast cancer to the best of our knowledge — and with high tumor grade and increased density of CD31-positive microves- sels (Table 1). No significant asso-ciation was seen between NOS2 expression and ER status, race/ ethnicity, tumor-node-metastasis (TNM) stage, phagocyte density
[image:3.585.53.277.83.270.2](CD68 count), or receipt of neoadjuvant therapy. Multivariable logistic regression was performed to calculate odds ratios (ORs) for association of NOS2 with markers of tumor aggressiveness (Table 1). After adjustment for age at diagnosis, race/ethnicity, TNM stage, and neoadjuvant therapy, NOS2 expression remained independently associated with the tumor p53 mutational status (OR, 3.02; 95% CI, 1.19–7.66), tumor grade (OR, 2.86; 95% CI, 1.38–5.94), and microvessel density (OR, 2.41; 95% CI, 1.16–4.97).
Figure 1
NOS2 expression in human breast tumors. IHC analysis of invasive breast carcinomas for expression of inducible NOS2 (A–D). NOS2 was mainly expressed in the cytoplasm of tumor cells, with some cells showing a marked perinuclear localization of NOS2 protein. NOS2 expression ranged from (A) absent or occasional expression in the tumor epithelium, to (B) moderate expression in numerous tumor cells, to (C and D) a rather strong expression in the tumor epithelium that was either found localized within the tumor or present in most tumor cells. (D) Shown is a tumor with NOS2 expression in both the tumor epithelium and a lymphoid infiltrate (T, tumor epithelium; S, surround-ing lymphoid infiltrate). Original magnification, B: ×100, ×200 (inset);
[image:3.585.196.531.428.705.2]A, C, and D: ×200. Counterstain: hematoxylin.
Table 1
Association of high NOS2 expression with tumor characteristicsA
Disease Low NOS2 High NOS2 χ2 Multivariable logistic regressionB
characteristic n % n % P OR 95% CI P
ER status
Negative 27 36% 75 43% 1
Positive 47 64% 98 57% 0.32 0.75 0.39–1.45 0.392 TNM stageC
Low 53 84% 131 79% 1
High 10 16% 34 21% 0.42 1.75 0.72–4.24 0.216 Grade
1/2 41 68% 67 43% 1
3 19 32% 88 57% 0.001 2.86 1.38–5.94 0.005D
Race
AA 44 59% 99 57% 1
EA 31 41% 74 43% 0.83 1.08 0.59–1.99 0.805 p53 mutation
Negative 67 89% 133 77% 1
Positive 8 11% 40 23% 0.023 3.02 1.19–7.66 0.020D
Chemotherapy
No 30 45% 69 42% 1
Yes 37 55% 95 58% 0.71 0.84 0.41–1.73 0.638 CD68E
Low 44 59% 88 47% 1
High 31 41% 92 53% 0.079 1.62 0.86–3.05 0.134 CD31E
Low 35 64% 69 45% 1
High 20 36% 84 55% 0.018 2.41 1.16–4.97 0.018D
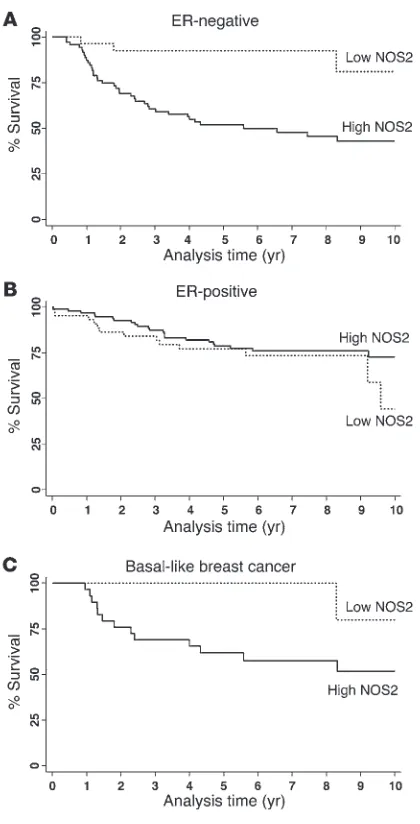
NOS2 expression predicts poor survival in ER-negative breast cancer. We next examined the effect of NOS2 expression on predicting patient survival using the Kaplan-Meier method (Figure 2) and multivariable Cox regression analysis (Table 2). The Kaplan-Meier analysis showed that NOS2 predicts breast cancer–specific survival in ER-negative patients. High NOS2 expression was significantly associated with decreased survival of these patients (Figure 2A), but not of ER-positive breast cancer patients (Figure 2B). This finding was further corroborated by a test for interaction showing that the tumor ER status modifies the effect of NOS2 on breast cancer survival (P = 0.002). The association of NOS2 with poor survival in ER-negative breast cancer patients remained significant in the multivariable analysis. Cox regression analysis showed that NOS2 is an independent predictor of 5- and 10-year survival after adjustment for age at diagnosis, tumor grade, TNM stage, receipt of chemotherapy, and tumor p53 mutation status (Table 2). Other factors, such as race/ethnicity or menopausal status, did not influ-ence the association between NOS2 and breast cancer survival in ER-negative breast cancer.
High NOS2 expression is associated with a distinct gene signature in ER-negative tumors. In order to determine why NOS2 is associated
with poor survival in ER-negative but not ER-positive breast can-cer, we analyzed the gene expression profiles of microdissected tumor epithelium from 32 breast tumors, comparing high NOS2 versus low NOS2 expression in ER-negative cases and ER-positive cases (9 NOS2 high/ER-negative and 8 NOS2 low/ER-negative; 6 NOS2 high/ER-positive and 9 NOS2 low/ER-positive). This anal-ysis revealed a NOS2 gene signature in ER-negative tumors but not in ER-positive tumors. No gene was differentially expressed in the ER-positive tumors at any acceptable false discovery rate (FDR). In ER-negative tumors, 49 mRNA transcripts correspond-ing to 44 genes were consistently differentially expressed between NOS2 high and NOS2 low tumors. The genes are listed in Table 3. Strikingly, among the genes most differentially expressed were the genes encoding cytokeratins 6 and 17 and P-cadherin, which are markers of the basal-like breast cancer phenotype (27–29), and also IL-8. To determine whether this gene signature had more common features with basal-like breast cancer, we examined two previously published basal-like breast cancer gene signatures for similarities (1, 30). Cross-referencing the NOS2/ER-negative gene signature with these data sets (Supplemental Table 2) revealed that 11 of the 44 (25%) genes were also present in the Sorlie signa-ture (1) and 15 of 44 (34%) in the Charafe-Jauffret signature (30), with 21 of 44 (48%) genes being previously identified as basal-like signature genes. Because of this finding, we further character-ized the 248 breast tumors by IHC and identified those patients with basal-like breast cancer in our cohort (ER-negative, HER2-negative, and either EGFR-positive or cytokeratin 5/6-positive, as described in ref. 31). In the Kaplan-Meier survival analysis, high NOS2 was associated with poor survival in this patient subset (P = 0.038) (Figure 2C). The result suggests that in addition to inducing a basal-like signature in ER-negative tumors, the pres-ence of NOS2 may further enhance disease aggressiveness in the presence of this signature.
[image:4.585.60.270.79.491.2]The gene signature associated with NOS2 is a predictor of outcome in an independent cohort of ER-negative breast cancer patients . We exam- ined the ability of our NOS2 gene signature to predict both over-all survival and relapse-free survival in ER-negative breast cancer patients (n = 77) in an independent and publicly available data set from the Karolinska Institute in Sweden (http://www.ncbi.nlm. nih.gov/geo/query/acc.cgi?acc=GSE1456) (32), applying the sur- vival prediction algorithm provided by the publicly available BRB-ArrayTools software. We conducted this analysis to assess whether the NOS2 gene signature from our study, which is similar but not identical to the reported basal-like gene signature in breast can-cer, is also predictive of outcome in other breast cancer data sets.
Figure 2
Indeed, the NOS2 signature predicted both relapse-free survival (P = 0.006) and overall survival (P = 0.019) in the ER-negative patients from the Karolinska data set (Supplemental Figure 1).
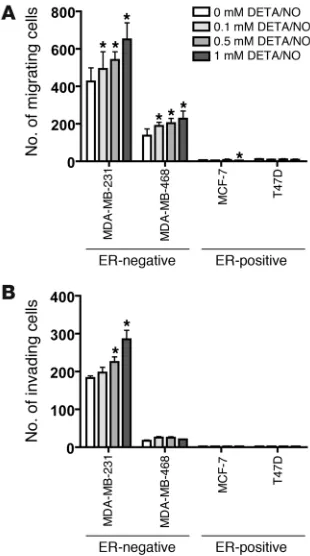
NO induces increased cell motility and invasion in ER-negative breast cancer cells. To better understand the mechanism by which NOS2 induces an aggressive phenotype in ER-negative breast cancer, the NO donor diethylenetriamine/NO (DETA/NO) was used to exam-ine the effects of NO, the product of NOS2, on breast cancer cell migration and cell invasion. To assess whether NO can induce or inhibit breast cancer cell migration and invasion, 4 breast cancer cell lines, 2 ER-negative (MDA-MB-231, MDA-MB-468) and 2 ER-positive (MCF-7, T47D), were exposed to escalating doses of 0, 0.1, 0.5, and 1 mM DETA/NO (Sigma-Aldrich), equivalent to about 0.2 and 0.4 μM NO concentrations at the highest doses of 0.5 and 1 mM DETA/NO over a 24-hour period (33). DETA/NO was found to induce cell motility in a dose-dependent manner in the two ER-negative cell lines, but not in the ER-positive cell lines as shown in Figure 3A. A regression analysis indicated a statistically signifi-cant trend toward increased levels of cell motility with increasing DETA/NO concentration in MDA-MB-231 (P < 0.001) and MDA-MB-468 cells (P = 0.009). DETA/NO also induced cell invasion in a dose-dependent manner in the ER-negative cell line MDA-MB-231 (P < 0.001) but not in MDA-MB-468 (P = 0.637) or in the ER-posi-tive cell lines T47D and MCF-7, as shown in Figure 3B.
DETA/NO induces increased IL-8, CD44, S100A8, and P-cadherin pro-tein expression in ER-negative breast cancer cell lines . Next, we deter-mined whether the gene expression profile associated with high NOS2 expression in ER-negative breast tumors was at least partly due to the effects of NO by treating cells with DETA/NO. For that, we focused on 4 gene products: IL-8, which has previously been found to be expressed only in ER-negative breast cancer (34,
35); S100 calcium-binding protein A8 (S100A8); and P-cadherin (CDH3), which are both poor outcome markers and markers of basal-like breast cancer (28, 29, 36); and the hyaluronate recep-tor (CD44), a marker of breast cancer stem cells and poor disease outcome (37). We examined the effects of NO on IL-8 secretion by ELISA (Figure 4A) and on S100A8, P-cadherin, and CD44 expression by Western blot analysis (Figure 4B) in 4 breast cancer cell lines, the ER-positive MCF-7 and T47D cells and the ER-negative MDA-MB-231 and MDA-MB-468 cells. Consistent with our gene expression data, exposure to NO increased the expression of IL-8, S100A8, P-cadherin, and CD44 expres-sion in ER-negative breast cancer cells, but not the ER-positive cells. In the ER-positive cells, NO rather inhibited the expression of S100A8 (MCF-7) and P-cadherin (MCF-7 and T47D). To fur-ther corroborate the finding that the induction of these markers by NO in ER-negative human breast cancer cells is applicable across multiple cell lines with different genetic alterations, we performed the same experiments in two additional ER-negative human breast cancer cell lines, MDA-MB-157 and Hs578T, and also in ER-negative, non-tumorigenic MCF-10A human breast epithelial cells. As shown in Supplemen-tal Figure 2, NO increased marker expression in these cell lines as well, although some differences were observed between these cell lines and the MDA-MB-231 and MDA-MB-468 cells.
ER transgene expression in ER-negative breast cancer cells inhibits NO-induced upregulation of 3 markers but not IL-8 . The lack of an associa-tion between NOS2 and survival in ER-positive breast cancer and the absence of a noticeable gene expression signature related to high NOS2 expression in ER-positive tumors, coupled with the inabil-ity of NO to induce S100A8, P-cadherin, CD44, or IL-8 expression in ER-positive cells, suggested that the ER may modify the effects of NOS2 and its product NO on breast cancer cell phenotype. To determine whether the expression of the ER in the ER-negative cell lines MDA-MB-231 and MDA-MB-468 would modify NO-induced upregulation of P-cadherin, CD44, S100A8, or IL-8 in these cells, we transiently transfected them with a plasmid encoding the ER and exposed them to 0.5 mM DETA/NO for 48 hours. As shown in Figure 5A, introduction of the ER-encoding transgene (ESR1) into MDA-MB-231 and MDA-MB-468 cells at least partly reversed the effects of DETA/NO on P-cadherin, CD44, and S100A8 expres-sion. However, expression of ESR1 in these cells had no effect on basal and NO-induced levels of IL-8, indicating that an intrinsic mechanism independent of ER status suppresses IL-8 expression in ER-negative cells (Figure 5B). To ensure that the ESR1-transfected cells had an intact ER pathway, we examined as indicators of ER pathway activation the expression of the ER-responsive gene cyclin D1 (38) and the activation of an ER-responsive luciferase construct in the MDA-MB-231 and MDA-MB-468 cells. As shown in Figure 5 and Supplemental Figure 3, ESR1 transgene expression increased
Table 2
Effect of high NOS2 expression on breast cancer–specific survival
Univariate Cox regression Multivariable Cox regressionA
HR 95% CI P n HR 95% CI P n
5-Year breast cancer–specific survival All patients
Low NOS2 1 75 1 46
High NOS2 2.04 1.09–3.82 0.025B 173 1.96 0.94–4.09 0.073 138
ER-negative
Low NOS2 1 27 1 19
High NOS2 8.14 1.95–33.9 0.004B 75 6.19 1.43–26.7 0.015B 62
ER-positive
Low NOS2 1 47 1 27
High NOS2 0.86 0.40–1.83 0.694 98 1.03 0.40–2.63 0.951 76 10-Year breast cancer–specific survival
All patients
Low NOS2 1 75 1 46
High NOS2 1.68 0.97–2.92 0.065 173 1.62 0.84–3.10 0.149 138 ER-negative
Low NOS2 1 27 1 19
High NOS2 6.18 1.90–20.0 0.002B 75 5.13 1.51–17.4 0.009B 62
ER-positive
Low NOS2 1 47 1 27
High NOS2 0.71 0.36–1.40 0.318 98 0.83 0.35–1.98 0.682 76
expression of cyclin D1 (Figure 5A) and transcriptionally activated the reporter construct in a β -estradiol–dependent manner (Supple-mental Figure 3), indicating that transgene expression led to intact ER signaling in our cell culture experiments.
MetaCore pathway analysis links NOS2 gene signature in ER-negative tumors to c-Myc. Bioinformatics tools allow us to find transcription factors and mechanisms that are the underlying causes of a gene
[image:6.585.56.514.107.626.2]expression signature in human tissues. We used MetaCore soft-ware to identify candidate transcription factors that could be key regulators of the NOS2 gene signature in ER-negative tumors. This approach identified c-Myc as the top candidate transcription factor underlying the NOS2 gene signature, as shown in Supplemental Figure 4A. To experimentally follow up on this finding, we exposed MDA-MB-231 and MDA-MB-468 cells to 0.5 mM DETA/NO and
Table 3
Genes differentially expressed between high and low NOS2 in ER-negative breast tumors (FDR, <10%)
GenBank ID Gene symbol Fold changeA P Gene name
AL569511 KRT6A/B/C/E 52.7 0.002 Keratin 6 A/B/C/E
J00269 KRT6A/C/E 42.1 0.002 Keratin 6A/C/E
NM_021804 ACE2 17.0 0.005 Angiotensin I converting enzyme 2
L42612 KRT6B 15.9 0.001 Keratin 6B
AI831452 KRT6B 14.3 <0.001 Keratin 6B
NM_025087 FLJ21511 12.2 0.001 Hypothetical protein FLJ21511
NM_000422 KRT17 8.6 0.009 Keratin 17
Z19574 KRT17 8.3 0.005 Keratin 17
NM_000584 IL8 6.8 0.003 Interleukin 8
NM_003064 SLPI 6.0 0.001 Secretory leukocyte peptidase inhibitor NM_018004 TMEM45A 5.6 0.001 Transmembrane protein 45A NM_002964 S100A8 5.0 0.010 S100 calcium binding protein A8
L25541 LAMB3 4.9 0.002 Laminin, beta 3
NM_001793 CDH3 4.3 0.005 P-cadherin
AB018009 SLC7A5 4.2 0.008 Solute carrier family 7, member 5 NM_018455 C16orf60 4.1 0.002 Chromosome 16 open reading frame 60
X57348 SFN 4.0 0.001 Stratifin
NM_001630 ANXA8 3.9 0.006 Annexin A8
NM_005629 SLC6A8 3.9 0.006 Solute carrier family 6, member 8 NM_012101 TRIM29 3.8 0.002 Tripartite motif-containing 29 NM_002061 GCLM 3.4 <0.001 Glutamate-cysteine ligase AF132818 KLF5 3.4 <0.001 Kruppel-like factor 5 NM_022121 PERP 3.4 0.003 PERP, TP53 apoptosis effector NM_003878 GGH 3.2 0.004 Gamma-glutamyl hydrolase
NM_007196 KLK8 3.2 0.002 Kallikrein 8
NM_016593 CYP39A1 3.1 0.010 Cytochrome P450, family 39, subfamily A, polypeptide 1
NM_003662 PIR 3.0 0.002 Pirin
NM_001047 SRD5A1 2.9 0.003 Steroid-5-alpha-reductase, alpha polypeptide 1
X57348 SFN 2.8 0.005 Stratifin
NM_005342 HMGB3 2.8 0.002 High-mobility group box 3 NM_006623 PHGDH 2.7 0.002 Phosphoglycerate dehydrogenase AV712602 PTPLB 2.6 <0.001 Protein tyrosine phosphatase-like, member b
X16447 CD59 2.5 0.001 CD59 molecule
NM_003392 WNT5A 2.4 0.002 Wingless-type MMTV integration site family, member 5A
NM_000611 CD59 2.4 0.002 CD59 molecule
BE964473 RPE 2.3 0.001 Ribulose-5-phosphate-3-epimerase NM_000050 ASS 2.3 0.008 Argininosuccinate synthetase
NM_002633 PGM1 2.1 0.003 Phosphoglucomutase 1
D84454 SLC35A2 2.1 0.002 Solute carrier family 35, member A2 BF116254 TPI1 2.0 0.001 Triosephosphate isomerase 1 NM_005333 HCCS 2.0 0.001 Holocytochrome c synthase
NM_001428 ENO1 2.0 <0.001 Enolase 1
NM_000610 CD44 2.0 0.003 CD44 molecule
BF939365 CALU 1.9 0.002 Calumenin
NM_014637 MTFR1 1.9 0.004 Mitochondrial fission regulator 1 NM_000365 TPI1 1.9 0.002 Triosephosphate isomerase 1 AF289489 ASPH 1.9 0.006 Aspartate beta-hydroxylase BC003375 MRPL3 1.8 0.002 Mitochondrial ribosomal protein L3 AI186712 PPP1CB 1.7 <0.001 Protein phosphatase 1, catalytic subunit, beta isoform
isolated both total and nuclear fraction protein at 0, 20, 40, and 60 minutes of exposure. Then, we examined c-Myc protein expression by Western blot analysis and c-Myc activation using a transcription factor DNA binding ELISA. Incubation with DETA/NO resulted in an increase in both c-Myc protein expression (Supplemental Fig-ure 4B) and c-Myc DNA binding activity (Supplemental Figure 4C) within 60 minutes in the MDA-MB-468 cells, which are known to
have a basal-like phenotype. These early and preliminary mechanis- tic observations are consistent with the hypothesis that c-Myc acti-vation by NO links NOS2 expression in ER-negative breast tumors to the observed NOS2 gene signature in these tumors.
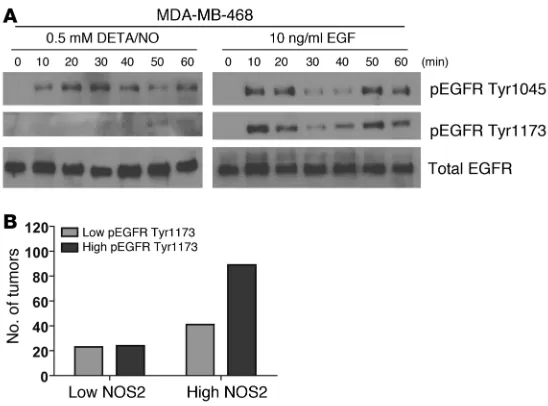
[image:7.585.85.240.82.360.2]Phosphorylation of EGFR by NO in MDA-MB-468 cells . Overexpres-sion of EGFR is a marker of basal-like breast cancer (31). To further explore mechanisms by which NO may influence survival of breast cancer patients with a basal-like gene signature in their tumors, we studied the phosphorylation status of EGFR in response to NO exposure. Phosphorylation of this oncogenic receptor at residues Tyr1045 and Tyr1173 leads to receptor activation and downstream signaling. Exposure of MDA-MB-468 cells to 0.5 mM DETA/NO indeed induced rapid phosphorylation of both tyrosine residues in these cells (Figure 6A). Because of this finding, we performed an immunohistochemical analysis of EGFR Tyr1173 phosphoryla-tion in a series of EGFR-positive breast tumors. The IHC for EGFR and pEGFR at Tyr1173 is shown in Supplemental Figures 5 and 6, respectively. This analysis revealed that EGFR-positive tumors with high NOS2 are significantly more likely to have a high EGFR phosphorylation score than EGFR-positive tumors with low NOS2 (Figure 6B). Together, these data indicate that NOS2 and NO may induce increased EGFR phosphorylation and cause EGFR path-way activation in breast cancer.
Figure 3
[image:7.585.210.539.486.741.2]Induction of cell motility and cell invasion in ER-negative breast cancer cell lines after exposure to the NO donor DETA/NO. (A) DETA/NO induced significantly increased cell migration in two ER-negative cell lines, MDA-MB-231 and MDA-MB-468, over a 24-hour exposure, but not in the ER-positive cell lines T47D and MCF-7. (B) DETA/NO sig-nificantly enhanced cell invasion of the invasive ER-negative cell line MDA-MB-231 over a 24-hour exposure, but not in the less-invasive ER-negative MDA-MB-468 line or the two ER-positive lines T47D and MCF-7. Shown are mean ± SD. *P < 0.05 versus no treatment, Student’s t test.
Figure 4
Discussion
In this study, we examined whether NOS2 influences breast can-cer survival and investigated mechanisms by which NOS2 and NO may cause a poor outcome phenotype. The research led to the clinically significant observation that NOS2 expression is associ-ated with a prognostic basal-like transcription pattern and is a predictor of inferior survival in women with ER-negative tumors. Moreover, the presence of NOS2 correlated with other poor out-come markers, such as an increased microvessel density and p53 mutation frequency as well as activated EGFR. Additional work found that NO induces basal-like genes and IL-8 only in ER-nega-tive breast cancer cells. Some of these genes that were found to be induced by NO, such as CD44 and c-Myc, have been linked to an embryonic stem cell–like phenotype in breast cancer that is enriched in basal-like breast tumors (39, 40), raising the possibil-ity that the expression of NOS2 and increased NO release into the tumor microenvironment lead to poorly differentiated and aggres-sive tumors with a distinct gene signature, enhanced angiogenesis, and the inactivation of the p53 tumor suppressor gene.
Previous reports indicated that elevated NOS2 expression may be linked to a high grade and poor prognosis in breast cancer (12, 41, 42), and also to poor outcome in other human epithelial cancers. In addition, mammary tumor latency is increased in NOS2-knock-out mice (43). Aberrant expression of NOS2 has been observed in human breast (12, 13), colon (14, 15), stomach (44, 45), non–small cell lung (23), esophageal (46), and squamous cell head and neck cancer (47). In the two breast cancer studies, increased NOS2 cor-related with tumor grade (12) and tumor angiogenesis and p53 protein accumulation (13). Our observations are consistent with these reports. NO has proangiogenic activities (48–50) and also promotes carcinogenesis through the inactivation of wild-type p53 function, by either causing loss of DNA-binding activity (51) and/or selecting for mutant p53 (26). Thus, we also evaluated in the current study to what extent tumor grade, tumor p53 status, and tumor microvessel density may influence the association of
NOS2 with survival among the ER-negative breast cancer patients. This analysis showed that high NOS2 is the single most significant predictor among them and predicts poor outcome of ER-nega-tive breast cancer patients largely independent of these 3 factors (Supplemental Figure 7). Two other studies of breast cancer ana-lyzed NOS2 expression in tumors and examined the relationship between NOS2 and patient outcome (41, 42). In agreement with our findings and the study by Vakkala et al. (13), NOS2 was found to be commonly expressed by the cancer cells themselves. However, the two studies were relatively small-sized, with mainly ER-posi-tive patients, which did not allow an independent assessment of NOS2 in ER-negative breast cancer. Both studies found a signifi-cant association of NOS2 with high-grade tumors, as we did in the present study, and a borderline association of high NOS2 with decreased survival in the univariate but not multivariable analy-sis. From their results, it appears that NOS2 expression may have some prognostic value in ER-positive breast tumors, although our study did not find this.
In an effort to determine why high NOS2 expression is associated with poor survival in ER-negative breast cancer, we performed a gene expression analysis of microdissected breast tumor epithelium and also assayed phenotypes of ER-negative breast cells that were exposed to NO. These approaches led to the discovery of a distinct and robust basal-like gene expression signature for high NOS2 in ER-negative tumor epithelium and NO-induced phenotypic altera-tions in ER-negative cells that indicated increased aggressiveness. Moreover, the NOS2 signature per se is prognostic, as found by us with the analysis of an independent sample set with gene expres-sion data from 77 ER-negative breast tumors (32). An oncogenic effect of NO in the ER-negative MDA-MB-231 breast cancer cell line has been observed by others (21), consistent with a NO-induced poor outcome phenotype and our data. The global gene expression analysis did not find a major influence of NOS2 status on gene expression in ER-positive tumors, and furthermore, NO did not induce an aggressive phenotype in ER-positive breast cancer cells, as indicated by the cell migration and invasion results.
[image:8.585.53.274.80.337.2]It is likely that both the difference in ER expression and intrin- sic differences between ER-negative and ER-positive breast can-cer cells independent of the tumor ER status contribute to this diminished responsiveness to NO in ER-positive cancer cells. We found that ER expression inhibited NO-induced upregulation of the stem cell marker CD44, and also S100A8 and P-cadherin, but not of IL-8. IL-8 is preferentially expressed by ER-negative breast tumors and breast cancer cell lines (34). Atypical methylation of the IL8 gene is a candidate mechanism for the differential expres-sion of IL-8 in breast tumors (52). Regulation of IL-8 expression by NO has previously been observed in pancreatic cancer cells,
Figure 5
human monocytes, and lung epithelial cells (53–55). IL-8 is of particular importance in breast tumor biology and is associated with increased breast cancer cell invasion, neutrophil infiltration, and microvessel density (35). IL-8 mediates metastasis in breast cancer and other cancers, and its secretion correlates with early dissemination and poor survival (56). Moreover, it has been shown that IL-8 supports breast cancer stem cell renewal and invasion (57). Our findings suggest that NOS2 may lead to poor survival among ER-negative patients partly because it induces IL-8 selec-tively in tumors of these patients and not in ER-positive tumors, leading to increased stem cell renewal, cell invasion, angiogenesis, and metastasis. This hypothesis is supported by our two findings that NO induces IL-8 only in ER-negative breast cancer cells and that IL-8 expression is increased in ER-negative tumors with high NOS2 but not in ER-positive tumors with high NOS2. Whether ER expression regulates IL-8 levels in breast cancer cells remains controversial. We did not find that IL-8 secretion is influenced by transient ER expression in ER-negative cells. In contrast, it was reported that an MDA-MB-231 clone that constitutively expressed an ER transgene had lower IL-8 production than the parent cell line (35). However, the same authors did not find that estrogen influenced IL-8 expression in the ER-expressing cells, arguing that perhaps clonal selection rather than ER expression may have con-tributed to this finding.
Alternatively, NOS2 may not produce NO as efficiently in ER-positive tumors as in ER-negative tumors, or NO signaling may occur differentially in ER-positive and ER-negative tumors because of differences in the tumor microenvironment. Effects of estrogen on NOS activity have been described; however, these appear to be mainly restricted to the endothelial isoform. Estrogen has been found to alter NOS2 expression in murine macrophages, spleno-cytes, and vascular smooth muscle cells by mechanisms involving ER (58–60), but because of the known differences in the promoter regulation of human and murine NOS2 (61), we cannot be sure that estrogen would have similar effects on human NOS2. Differ-ences in the tumor microenvironment between ER-positive and ER-negative tumors have been observed that may affect NO sig-naling. ER-negative tumors tend to have more tumor-associated macrophages than ER-positive tumors (62), and many proinflam-matory cytokines are expressed at a higher level in ER-negative
tumors than ER-positive tumors (63). Macrophages and these cytokines will alter the tumor microenvironment and may lead to a proinflammatory state. Thus, the NO biochemistry and signal-ing, which are greatly influenced by reactive oxygen species, may be different in ER-negative and ER-positive breast cancer.
[image:9.585.42.316.81.284.2]The gene signature induced by NOS2 in ER-negative breast tumors showed some striking similarities to two gene signatures associated with basal-like breast cancer (1, 30). Basal-like breast cancer is an ER-negative breast cancer subtype with an aggressive phenotype and limited therapy options (1, 31). Our evaluation of NOS2 in basal-like tumors indicated that its expression is associ- ated with poor outcome. This suggests that NOS2 is a novel can-didate prognostic marker for basal-like breast cancer and possibly a therapeutic target, whose activity could be selectively inhibited. Recently, increased expression of stem cell markers in basal-like tumors has been reported (40, 64). Among them was CD44, which is the major receptor for hyaluronan. Expression of CD44 is a poor outcome marker in breast cancer (65), and CD44-positive breast cancer cells exhibit increased invasive properties (66), increased resistance to radiotherapy (67), and increased resistance to che-motherapeutics (68). We observed that CD44 protein is induced by NO in ER-negative breast cancer cells and its gene expression was significantly elevated in ER-negative tumors with high NOS2. This observation links NOS2 and increased NO production to the development of a poorly differentiated breast cancer phenotype with stem cell–like characteristics. NO may induce this phenotype by activation of transcription factors, such as c-Myc, or by induc-ing the release of stem cell renewal factors like IL-8 (57), a property that NO has, as we have shown in this study. To gain an under- standing of what may drive the NOS2 gene signature in ER-nega-tive tumors, we used a bioinformatics tool to identify candidate factors that would induce these genes. c-Myc advanced as the top candidate from this analysis. Because of this finding, and because c-Myc is a part of an embryonic stem cell–like gene expression sig-nature in breast cancer (39), we tested whether NO induces this transcription factor in ER-negative breast cancer cells. Indeed, NO upregulated c-Myc in MDA-MB-468 cells, which have basal-like characteristics. We consider this finding as preliminary evidence that NO may induce the basal-like signature in ER-negative breast tumors in part by upregulation of c-Myc.
Figure 6
EGFR is one of the signature genes in basal-like breast cancer (31). NO has previously been shown to activate EGFR in lung cancer cells (69). Furthermore, nuclear EGFR signaling has been shown to lead to upregulation of NOS2 in breast cancer cells (70, 71). Because of the association of the NOS2 signature with the basal-like gene expression signature and the role of the EGFR in basal-like breast cancer, we explored the hypothesis that NO may activate this receptor through phosphorylation in EGFR-positive MDA-MB-468 cells and breast tumors. This work led to the finding that NO induces EGFR phosphorylation at Tyr1045 and Tyr1173 in breast cancer cells and of a significant association between EGFR phosphorylation and NOS2 expression in breast tumors. Together, these early mechanistic data indicate that besides induc-ing a poor prognosis signature and enhancing angiogenesis, NOS2 may also cause a poor outcome phenotype by activating the onco-genic EGFR pathway.
In conclusion, our study provides evidence that NOS2 is predic-tor of survival and determinant of disease aggressiveness associated with ER-negative breast cancer, and as such is a candidate target for therapy. The underlying mechanisms that lead to an NO-induced poor outcome phenotype may include a combination of events, such as the induction of a basal-like phenotype, activation of the EGFR pathway, increased angiogenesis, and selection for mutant p53 cells. We propose that selective NOS2 inhibitors may be par-ticularly efficacious in patients with basal-like breast cancer.
Methods
Tissue collection. Fresh-frozen (n = 32) and paraffin-embedded (n = 248) tumor specimens were obtained from breast cancer patients that resided in the greater Baltimore area, as described previously (22, 72). Patients were recruited at the University of Maryland Medical Center (UMD), the Balti-more Veterans Affairs Medical Center, Union Memorial Hospital, Mercy Medical Center, and Sinai Hospital in Baltimore between 1993 and 2003. All patients signed a consent form. Clinical and pathological informa-tion (e.g., tumor receptor status) was obtained from medical records and pathology reports. Disease staging was performed according to the TNM system of the American Joint Committee on Cancer/Union Internationale Contre le Cancer (AJCC/UICC) (73). The Nottingham system was used to determine the tumor grade (74). The collection of tumor specimens and clinical and pathological information was reviewed and approved by the University of Maryland Institutional Review Board for the participating institutions (UMD protocol 0298229). IRB approval of this protocol was then obtained at all institutions (Veterans Affairs Medical Center, Union Memorial Hospital, Mercy Medical Center, and Sinai Hospital).
IHC. IHC was performed as described previously (22). In brief, protein expression was evaluated using the following primary antibodies: 1:250 diluted monoclonal antibody (no. 610328; BD Biosciences) for NOS2; ready-to-use monoclonal antibody (Lab Vision Corp.) for CD31; ready-to-use monoclonal Ab-3 antibody (Lab Vision Corp.) for CD68; 1:250 diluted monoclonal antibody (no. 2729-1; Epitomics) for CD11b; ready-to-use mouse monoclonal antibody for EGFR (HER1) (Lab Vision Corp.); 1:250 diluted mouse monoclonal antibody for cytokeratin 5 (Lab Vision Corp.); 1:100 diluted monoclonal (no. 4407) anti–phospho-EGFR Try1173 (Cell Signaling Technology); and ready-to-use monoclonal (clone 6F11) anti-body (Ventana Medical Systems) for ER. A combined score of intensity and distribution was used to categorize the immunohistochemical staining for NOS2 and other proteins, as previously described by us and others (13, 22), with the exception of the ER expression. Intensity received a score of 0–3 if the staining was negative, weak, moderate, or strong. The distribution received a score of 0–4 if the staining distribution was <10% positive cells,
10%–30%, >30%–50%, >50%–80%, and >80%. A sum score was then divided into 4 groups as follows: (a) negative, 0–1; (b) weak, 2–3; (c) moderate, 4–5; and (d) strong, 6–7. ER expression was determined according to the refer-ence range set by ChromaVision ACIS assisted quantitative image analysis software (Clarient Diagnostic Services), and the ER status was then scored negative/positive according to clinical guidelines. The number of phago-cytes in the tumor specimens was determined by counting the number of CD68-positive monocytes per ×250 field in 3 representative fields. The quantification of the tumor microvessel density was performed on CD31-positive microvessels, as opposed to single CD31-positive cells, according to the method described by Weidner et al. (75). The number of microvessels per ×200 field was determined in the most vascular regions of the tumor and is presented as the average of 3 representative fields.
TP53 mutational analysis . Tumors were screened for p53 mutations as pre-viously described (76).
Laser capture microdissection . Enriched tumor epithelium from 32 fresh- frozen surgical breast tumors was obtained by laser capture microdis-section (LCM) as previously described (72). Of those, 17 had low NOS2 expression and 15 had high NOS2 expression. In brief, frozen 8-μm serial sections from OCT-preserved frozen tissues were prepared and mounted on plain, uncharged microscope slides. One H&E-stained section of each specimen was reviewed by a pathologist who indicated which representa-tive sections of the tumors should be microdissected. LCM was performed at the NIH Collaborative Research LCM Core Laboratory with the Pixcell II LCM system (Arcturus). At least 3,000–5,000 cells were obtained per speci-men. Total RNA was isolated using the PicoPure protocol (Arcturus). The mRNA was amplified with two linear amplification steps by in vitro tran- scription using the MEGAscript T7 kit (Ambion) followed by the label-ing step using the BioArray HighYield RNA Transcript Labeling Kit (T3) from Enzo Life Sciences. Labeled cRNA was hybridized onto Affymetrix HG-U133A GeneChips. Cel files with the normalized expression data were deposited in the GEO repository (http://www.ncbi.nlm.nih.gov/projects/ geo/; accession no. GSE5847).
Analysis of gene expression data. All chips were normalized with the robust multichip analysis procedure (77). Gene lists comparing the effects of high versus low NOS2 expression on mRNA expression in the tumor epi- thelium of both ER-positive and ER-negative breast tumors were gener-ated using moderated t scores to obtain significance testing and P values that are controlled for multicomparison analysis and false discovery (72). In addition, we calculated FDR for the differentially expressed genes, as described previously (78). BRB-ArrayTools software (http://linus.nci.nih. gov/pilot/index.html) was used to evaluate the association of a NOS2 gene signature with prognosis in a publicly available data set. The path-way analysis and data mining tool MetaCore (GeneGo Inc.) was used to identify and visualize the relationship of a candidate transcription fac-tor with the NOS2 gene signature in ER-negative breast tumors. GeneCo pathway maps and networks in MetaCore can be used to link a transcrip-tion factor to a gene expression pattern.
stored at –20°C. Cells were rinsed twice with cold PBS and lysed directly on the dish with cold RIPA buffer (no. 89900, Pierce) supplemented with protease inhibitors (no. 78410, Pierce), scraped, and spun at 14,000 g for 15 minutes at 4°C. Supernatant was collected and stored at –20°C for Western blot analysis of protein expression.
Western blot analysis. Protein concentrations were determined with the Bio-Rad Protein Assay. Western blot analysis was performed according to standard procedures, and 50–100 μg of total protein was loaded per lane. The protein bands were visualized using the SuperSignal West Pico Che-miluminescent Substrate (Pierce). The following antibodies were used to detect proteins of interest: mouse monoclonal anti–P-cadherin (no. 610228), 1:500, from BD Biosciences; goat polyclonal anti-S100A8 (no. AF3059), 1:1,000, from Santa Cruz Biotechnology Inc.; mouse monoclonal anti-ER (no. PP-H4624-00), 1:1,000, and mouse monoclonal anti-CD44 (no. BBA10), 1:1,000, both from R&D Systems; mouse monoclonal anti–cyclin D1 (DSC6), 1:2,000, from Cell Signaling Technology; rabbit polyclonal anti–phospho-EGFR Tyr1045 (no. 2237), 1:1,000, and rabbit monoclonal anti–phospho-EGFR Tyr1173 (no. 4407), 1:1,000, and rabbit polyclonal anti-EGFR (no. 2232), 1:1,000, all from Cell Signaling Technology; rabbit polyclonal c-Myc (sc-764), 1:1,000, from Santa Cruz Biotechnology Inc.
Preparation of nuclear fraction . Cells were plated on 100-mm tissue cul-ture plates and grown to 80% confluence in complete medium. Cells were serum starved for 24 hours, after which they were exposed to 0.5 mM DETA/NO for 0, 20, 40, and 60 minutes. The nuclear and cytoplasmic protein fractions were isolated per the manufacturer’s instructions using the Nuclear Extract Kit (Active Motif). In brief, cells were washed with ice-cold PBS/phosphatase inhibitors, removed by gently scraping with cell lifter, and spun for 5 minutes at 45 g at 4°C, to pellet cells. Cells were resuspended in 500 μl hypotonic buffer and chilled for 15 minutes on ice, 25 μ l detergent was added, and samples were vortexed for 10 seconds, fol-lowed by a 30-second spin at 14,000 g at 4°C. Supernatant (cytoplasmic fraction) was isolated and stored at –80°C. The pellet (nuclear fraction) was resuspended in 50 μl complete lysis buffer, vortexed for 10 seconds, and incubated/rocked for 30 minutes on ice. The pellet was vortex for a further 30 seconds, and spun at 14,000 g for 10 minutes at 4°C. Resulting supernatant was isolated and stored at –80°C.
c-Myc activation assay. c-Myc activation was examined using the TransAM c-Myc ELISA (Active Motif). In brief, 40 μl complete binding buffer and 10 μl of diluted sample/positive control/protein standard were added to each well and incubated for 1 hour at room temperature (RT) with mild agitation on a rocking platform, to allow binding to a c-Myc consensus sequence. Wells were washed 3 times with 200 μl 1× wash buffer. Diluted c-Myc antibody (100 μl) was added to each well and incubated for 1 hour at RT. Wells were washed 3 times with 200 μl 1× wash buffer. Diluted HRP-conjugated antibody (100 μl) was added to each well and incubated for 1 hour at RT. Wells were washed 4 times with 200 μl 1× wash buffer. Devel-oping solution (100 μl) was added to each well and incubated for 2–10 minutes at RT. Stop solution (100 μl) was added and absorbance read on a spectrophotometer within 5 minutes at 450 nm/655 nm.
IL-8 ELISA. IL-8 concentrations in culture supernatants were determined using the human IL-8 Quantikine ELISA kit (R&D Systems), following the manufacturer’s protocol. Briefly, supernatants from ER-negative breast cancer cell lines were diluted 1:5, while ER-positive cell line super-natants were used undiluted. Sample (50 μl) and assay buffer (100 μl) were added in triplicate to an IL-8–precoated 96-well ELISA plate, incubated for 2 hours at RT. After washing, 200 μl HRP-conjugated IL-8 antibody was added and incubated for 1 hour at RT. After another washing step, 200 μl detection reagent was added and incubated for 30 minutes at RT. The plates were read at 450 nm in a microplate reader. Each independent experiment was carried out 3 times.
Invasion and motility assays. Invasion and motility assays were performed as previously described (79). In brief, cells were harvested and suspended in RPMI 1640 containing 0.2% FCS at a concentration of 1 × 10⁶ cells/ml.
Cell suspension (100 μl) and 100 μl of DETA/NO at 2× concentration was added to either BD Matrigel Invasion Chambers (for invasion assays) or BD HTS multiwell insert systems (for motility assays), and 500 μ l of appropri-ate medium containing 0.2% FCS was added to the well underneath the chamber. Cells were incubated at 37°C for 24 hours for motility assays and 48 hours for invasion assays. After this time, the inner side of the insert was wiped with a wet swab to remove the cells, while the outer side of the insert was gently rinsed with PBS and stained with 0.25% crystal violet for 5 minutes, rinsed again, and then allowed to dry. The inserts were then viewed under the microscope and the cells over a total of 5 random fields were counted at ×200 magnification, to determine the relative number of invading/migrating cells.
Transient transfection of ER-negative cell lines with ESR1. MDA-MB-231 and MDA-MB-468 cells were plated at 5 × 10⁵
cells per 100-mm dish in anti-biotic-free medium. Twenty-four hours later, the cells were transfected using Lipofectamine LTX and PLUS reagents (Invitrogen) with either 12.5 μg of empty vector plasmid pCMV6-XL4 or pCMV6-XL4-ESR1 plasmid from Origene. Cells were transfected as follows: For each plate, 12.5 μg plasmid DNA and 12.5 μl PLUS reagent were diluted in 2.5 ml Opti-MEM-I–reduced serum medium, mixed gently, and incubated for 15 minutes at RT. Lipo-fectamine LTX (12.5 μl for MDA-MB-231 and 17.5 μl for MDA-MB-468) was added to the DNA/Plus mix and incubated for a further 30 minutes at RT. The mixture was then added to the plates dropwise and allowed to incubate at 37°C overnight. Twenty-four hours after transfection, medium was replaced with serum-free medium to serum starve overnight, followed by replacement with serum-free medium containing DETA/NO (Sigma-Aldrich). After treatment, cell culture supernatants were collected for IL-8 quantification and spun at 180 g for 5 minutes to remove debris, then stored at –20°C. Cells were rinsed twice with cold PBS and lysed directly on the dish with cold RIPA buffer (no. 89900, Pierce) supplemented with protease inhibitors (no. 78410, Pierce), scraped, and spun at 14,000 g for 15 minutes at 4°C. Supernatant was collected and stored at –20°C for Western blot analysis of protein expression.
Reporter construct–based activity assay for ER . MDA-MB-468 and MDA- MB-231 cells were grown in phenol red–free RPMI containing 10% estro-gen-depleted (charcoal-stripped) serum for 72 hours. The cells were transfected with the reporter construct (3X ERE-Luc containing 3 copies of the vitellogenin estrogen response element) and/or the ER expression plasmid (pCMV6-XL4-ESR1) using Lipofectamine LTX and Plus reagents (Invitrogen) following the Invitrogen protocol. Briefly, 30,000 cells were plated into 96-well plates along with DNA transfection reagent mixtures totaling 225 ng of total DNA (200 ng 3X ERE-Luc plasmid reporter con-struct [Addgene Inc.], 20 ng pCMV-ERα expression plasmid, 5 ng pRL-TK
Renilla luciferase control vector, or control plasmid) and 0.5 μl LTX reagent per well. Transfections were performed in sextuplicate, and both pGL2-basic (Promega) and empty pCMV6-XL4 (Origene) were used as control plasmids to ensure that there were equal amounts of transfected DNA in each experiment. Twenty-four hours after transfection, the estrogen-deplet-ed medium was changed to medium containing either 10 μM β-estradiol (Sigma-Aldrich) or an equal volume of ethanol (control). Luciferase activity was measured with the Dual Luciferase Reporter Assay System as described by the manufacturer (Promega), using a Luminoskan Ascent luminometer (Thermo Scientific). Normalized luciferase activity (or estrogen promoter activity) was expressed as firefly luciferase values normalized by pRL-TK
Renilla luciferase values ± SD.