© 2017, IRJET | Impact Factor value: 5.181 | ISO 9001:2008 Certified Journal
| Page 2183
Scrutinization of Student Knowledge by Pearson
and Spearman Technique
P.Yuvaraj
1, R.Anirudh
2, Mathew Paul.P
3, Deepa.N
4123
School of Information Technology and Engineering,VIT University,Vellore, India.
4
Assisstant Professor,School of Information Technology and Engineering,VIT University,Vellore, India.
---
Abstract- This informational index is utilized to evaluate the knowledge of the student in the context of study time and exam execution of every student. We perform the software metric analysis on the given data set. In perspective of the spearman attribute analysis and Pearson correlation of data, we can separate each student in light of the learning level.Keyword: Pearson Correlation, Spearman Correlation, User Knowledge.
Introduction
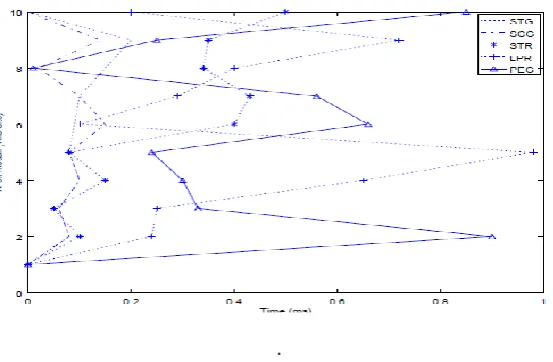
Pearson model is utilized to discover the connection between the traits x and y in view of the estimation of r. Pearson helps us to discover how intently an attribute is related to different attributes. We have a dataset of almost 100 clients portraying their review time and exam execution with the assistance of 5 attributes. In view of the examination of information, we can choose which attribute can be considered and which attribute can be dismissed. For instance, in Pearson technique, if the estimation of r is more than 0.5 then the attributes are thought to be emphatically related and if it is beneath 0.3 the traits are inadequately related. Correlation between two variables in Spearman is equivalent to the rank estimation of two variables in Pearson correlation; while linear relationships are assessed in Pearson correlation, monotonic relationships are evaluated in spearman’s correlation.
[image:1.595.165.442.458.639.2].
© 2017, IRJET | Impact Factor value: 5.181 | ISO 9001:2008 Certified Journal
| Page 2184
TABLE I. SAMPLE USER PERFORMANCE DATA USER STG SCG STR LPR PEG
A 0 0 0 0 0
B 0.08 0.08 0.1 0.24 0.9
C 0.06 0.06 0.05 0.25 0.33
D 0.1 0.1 0.15 0.65 0.3
E 0.08 0.08 0.08 0.98 0.24
F 0.09 0.15 0.4 0.1 0.66
G 0.1 0.1 0.43 0.29 0.56
H 0.15 0.02 0.34 0.4 0.01
I 0.2 0.14 0.35 0.72 0.25
J 0 0 0.5 0.2 0.85
Introduction A. Pearson based Attribute Clustering
2 2 2 2
. .
( . ( ) ).( . ( ) )
N xy x y
r
N x x N y y
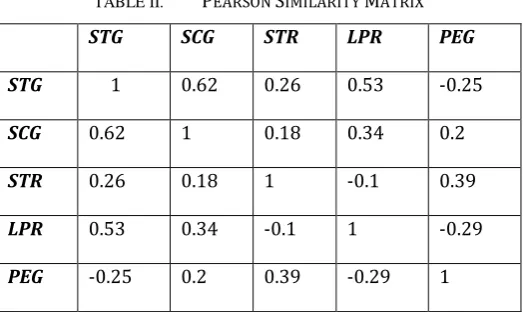
All the relations with r value less than 0.5 are considered as weak relations and the related attributes can be ignored and only strongly related attributes are considered. This decreases the overall number of attributes.
TABLE II. PEARSON SIMILARITY MATRIX
STG SCG STR LPR PEG
STG 1 0.62 0.26 0.53 -0.25
SCG 0.62 1 0.18 0.34 0.2
STR 0.26 0.18 1 -0.1 0.39
LPR 0.53 0.34 -0.1 1 -0.29
© 2017, IRJET | Impact Factor value: 5.181 | ISO 9001:2008 Certified Journal
| Page 2185
B. Spearman based Attribute ClusteringHere, ρ is the spearman co-efficient;
is the sum of square of paired scores;
TABLE III. SPEARMAN SIMILARITY MATRIX STG SCG STR LPR PEG
STG 1 0.66 0.37 0.65 -0.13
SCG 0.66 1 0.33 0.35 0.27
STR 0.37 0.33 1 -0.01 0.5
LPR 0.65 0.35 -0.01 1 -0.32
PEG -0.13 0.27 0.5 -0.32 1
C. Linear Regression Method:
Replace the sum values in the following form, to get the optimized cost of θ value.
2 1
1
1
( )
(
( )
)
2
m
i i
i
J
h x
y
m
Based on Linear Regression we will get the optimized θ value, and for this θ attribute value can be effectively relapsed after the Pearson similarity measure(where r>0.5).This strategy is utilized for cost optimizing which implies enhancing the variable.This is one of the techniques utilized for accomplishing machine learning Table III consists of θ value along with cost function for each attribute relation.
In view of the Pearson correlation attribute analysis of performance dataset which is shown in the above Table II, it is evident that the discoveries give (STG versus SCG, LPR); (SCG versus STG); ( LPR versus STG) are the essential cluster attributes. From the above dataset, we are choosing STG, SCG, PEG under the constraint of ≥0.50. From the above dataset, we are choosing STG, SCG under the constraint of ≥0.60.
© 2017, IRJET | Impact Factor value: 5.181 | ISO 9001:2008 Certified Journal
| Page 2186
TABLE IV. COST VALUE STG SCG STR LPR PEG
STG 0 0.24 0.37 1.06 1.79
SCG 0.02 0 0.42 1.3 1.59
STR 0.09 0.07 0 1.45 0.99
LPR 0.1 0.07 0.59 0 1.86
PEG 0.1 0.07 0.3 1.65 0
TABLE V. OPTIMIZED COST
STG SCG STR LPR PEG
STG 0 0.001 0.01 0.05 0.08
SCG 0.001 0 0.02 0.06 0.07
STR 0.004 0.003 0 0.07 0.04
LPR 0.005 0.03 0.02 0 0.09
PEG 0.005 0.01 0.01 0.08 0
TABLE VI. CORRESPONDING OPTIMIZED THETA
STG SCG STR LPR PEG
STG 1 1 2 2 2
SCG 1 1 2 2 2
STR 0.5 0 1 1 1.5
LPR 0 0 0.5 1 0.5
PEG 0 0 0.5 0.5 1
Conclusion
© 2017, IRJET | Impact Factor value: 5.181 | ISO 9001:2008 Certified Journal
| Page 2187
References[1] Xiao, Chengwei, et al. "Using Spearman's correlation coefficients for exploratory data analysis on big dataset." Concurrency and Computation: Practice and Experience (2015).
[2] P. Dhavachelvan, Chandra Segar T, K. Satheskumar, "Evaluation of SOA Complexity Metrics Using Weyuker’s Axioms," IEEE Int. Ad. Comp. (IACC), India, pages. 2325 – 2329, March 2009
[3] Alam, Md Ashad, Bangladesh Dinajpur, and Mohammed Nasser. "Simulation Based Comparison among Fifteen Estimators of Correlation Coefficient."
[4] Xu, Nuo, Xuan Huang, and Samuel Huang. "A Measure of General Functional Dependence between Two Continuous Variables." Communications in Statistics-Theory and Methods just-accepted (2016): 00-00.
[5] Smith, Reginald. "A mutual information approach to calculating nonlinearity." Stat 4.1 (2015): 291-303.
[6] E Malathy, Chandra Segar Thirumalai, "Review on non-linear set associative cache design," Int. Jnl. Ph. Tech, Dec-2016, Vol. 8, Issue No.4, pp. 5320-5330
[7] Chandrasegar Thirumalai, Rashad Manzoor, “Cost Optimization using Normal Linear Regression Method for Breast Cancer Type I Skin,” IEEE IPACT 2017. .
[8] Rodgers J.L. & Nicewander W.A., 1988. Thirteen ways to look at the correlation coefficient. The American Statistician 42 (1): 59–66.
[9] Spearman, Charles E. "charles e. Spearman (1863–1945) i faktorska analiza posle 110 godina."