http://dx.doi.org/10.4236/jmmce.2015.31003
How to cite this paper: Orozco-González, P., et al. (2015) Nucleation of Fe-Rich Intermetallic Phases on α-Al2O3 Oxide Films in Al-Si Alloys. Journal of Minerals and Materials Characterization and Engineering, 3, 15-25.
http://dx.doi.org/10.4236/jmmce.2015.31003
Nucleation of Fe-Rich Intermetallic
Phases on α-Al
2
O
3
Oxide Films in
Al-Si Alloys
Pilar Orozco-González
1*, Manuel Castro-Román
2, Simitrio Maldonado-Ruíz
1,
Sergio Haro-Rodríguez
1, Fabián Equihua-Guillén
3, Rodrigo Muñiz-Valdez
3,
Salvador Luna-Álvarez
3, Miguel Montoya-Dávila
1,
Alejandra Hernández-Rodríguez
21Academic Unit of Engineering, Autonomous University of Zacatecas, Zacatecas, México 2CINVESTAV Saltillo, Saltillo, México
3Faculty of Engineering, Autonomous University of Coahuila, México
Email: orozco_pilar@yahoo.com.mx
Received 5 September 2014; revised 7 October 2014; accepted 14 October 2014
Copyright © 2015 by authors and Scientific Research Publishing Inc.
This work is licensed under the Creative Commons Attribution International License (CC BY).
http://creativecommons.org/licenses/by/4.0/
Abstract
Nucleation of Fe-rich intermetallic phases on α-Al2O3 oxide films was analyzed in five
experimen-tal Al-Fe-Mn-Si alloys. In an attempt to verify the role of α-Al2O3 films in nucleating Fe-rich
inter-metallics, experiments have been conducted under conditions where formed in situ oxide films were present. Some Fe-rich intermetallics are observed to be related with the oxide films in the microstructure, the present results are in accordance with some research that suggest that the Fe-rich intermetallic phases nucleate upon the oxide films. The intermetallic phases and α-Al2O3
films were unambiguously identified with the help of complementary techniques such as thermal analysis, SEM/EDS and X-ray diffraction.
Keywords
Aluminum Alloys, Intermetallics, Nucleation, Crystal Growth, Oxide Films
1. Introduction
Iron is known to be the most common and at the same time the most detrimental impurity in Al-Si alloys due to its role in the formation of brittle Fe-rich intermetallic phases that precipitate during solidification process. In
this way, commercial Al-Si alloys always contain Fe impurities; this undesirable contamination is inevitable and cannot be economically removed from the molten aluminum, it comes either from the use of steel tools for melting and casting or from the use of scrap as the initial material.
The Fe impurities have a detrimental effect on the mechanical properties and extrusion characteristics of the Al-Si alloys. This is attributed to the formation of different Fe-containing intermetallic phases, such as α-AlFeSi and β-AlFeSi [1]-[5]. The α phase is usually described as having a cubic, αc-Al15(Fe,Mn)3Si2, [6] [7] or hex-agonal, αh-Al8Fe2Si, [8]-[10] crystal structure, and the β phase is generally considered to be monoclinic Al5FeSi
[11]-[15]. Techniques have to be developed to neutralize the detrimental effect of Fe impurities: 1) rapid
solidi-fication; 2) manganese addition; 3) melt superheating; and 4) inclusion particles addition. The three first me-thods basically convert the crystallization of the β phase to the less harmful Chinese script form, αc phase [3] [8]. Each one of these methods has its own advantages and limitations.
The inclusion particles addition technique is based on the work performed by Campbell and co-workers [16]- [18]. They have reported that the Fe-rich intermetallic phases nucleate and grow on the wetted surfaces of the oxide films, which have long been identified as cracks in the castings. Campbell et al. have further applied this nucleation mechanism to explain the cracks observed along the central axis of some Fe-rich intermetallics and for remove oxide films from the liquid aluminum. According to Cao and Campbell [17] [18], the wet side of the oxide films acts as a preferential nucleation site for Fe-rich intermetallic phases. As these particles have an in-creased sedimentation tendency, they sink to the bottom, bringing the oxide films with them.
The nucleation of Fe-intermetallic phases, such as α and β, was reported to be enhanced in the presence of particular inclusions added such as α-Al2O3 and MgAl2O4[19]. Khalifa et al. [20] have investigated the nuclea-tion of Fe-intermetallic phases on the surface of different inclusions. They have reported that some inclusions exhibit higher potency for the nucleation of particular Fe-intermetallic phases under certain conditions and poor potency under other conditions. In general, these results showed limited effect of the inclusion particles added on the nucleation of Fe-intermetallic phases. For example, γ-Al2O3, which is a potent nucleant for the primary phase α-Al, exhibit poor potency for the nucleation of the Fe-intermetallic phases. On the other hand, Lu and Dahle [21] did not find direct physical contact between Fe-rich intermetallic phases and the oxide films, thus the role of the oxide films as a heterogeneous substrate of Fe-intermetallics is uncertain.
The present work was performed to provide additional experimental information about the interaction be-tween the Fe-intermetallic phases and α-Al2O3 oxide films, commonly present in Al-Si alloys, in order to clarify the role of this oxide as heterogeneous substrate for the nucleation of Fe-intermetallic phases. This aspect would aid in controlling intermetallic formation, allowing control of the microstructure of the castings and hence im-provement of the mechanical properties of the commercial Al-Si alloys. It is worth mentioning that any interme-tallic phase formation on γ-Al2O3 films was not investigated in this work.
2. Experimental Details
2.1. Melt Preparation
The chemical composition of the alloys, determined by inductively coupled plasma emission spectroscopy (ICP), is shown in Table 1. These alloys were prepared starting from aluminum ingots of commercial purity (99.79%); the main impurities present in these ingots were: 0.14% Fe and 0.05% Si. The added alloying elements were: Fe (99.98%), Mn (99.95%), and silicon of commercial grade. The chemical composition is given in weight percen-tage unless otherwise specified.
2.2. Thermal Analysis (TA)
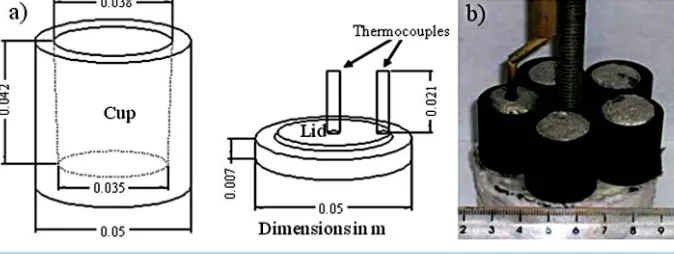
To determine the solidification sequence and the onset reaction temperature, Tp, for the intermetallic phase for-mation (see Table 2), thermal analysis curves were obtained by employing an experimental device similar to the one used by Bäckerud et al. [5]. First, the alloy was melted and heated to 800˚C under ambient air conditions in a gas furnace. Subsequently, the melt was poured into a graphite cup having a wall thickness of 6 mm, which was preheated to 900˚C in an electric furnace; to achieve thermal equilibrium conditions, the melt was kept at 900˚C for 120 s in the graphite cup inside the electrical furnace. Finally, the sample was cooled down to room temperature at a rate of ~1˚C/s.
Table 1. Chemical composition of the aluminum alloys.
Alloy Al Si Mn Fe Fe/Mn ratio
1 85.4 13.3 1.2 0.1 0.1
2 84.2 13.5 1.1 1.2 1.1
3 81.1 13.4 1.1 4.4 4.0
4 78.2 13.5 1.2 7.1 5.9
[image:3.595.93.537.236.357.2]5 75.1 13.6 1.2 10.1 8.4
Table 2. Chemical composition and structural data of extracted intermetallic phases, determined from the results of the SEM/ EDS and XRD analyses.
Alloy T˚C p ˚CTs AlFeMnSi Intermetallic
Composition from SEM/EDSa
Fe/Mn
Weight Ratio Formula Lattice Parameter (Å)
Al Si Fe Mn
1 610 595 αsc 56.90 10.69 3.45 28.95 0.12 Al34.1FeMn8.5Si6.16 a = 12.648
2 655 640 αbcc 58.20 10.24 9.77 21.80 0.45 Al12.3FeMn2.27Si2.1 a = 12.603
3 679 664 αbcc 57.93 10.07 18.61 13.38 1.39 Al8.8Fe1.36MnSi1.47 a = 12.535
4 732 717 αh 53.27 12.51 26.46 7.76 3.41 Al14Fe3.36MnSi3.15 a = 12.39, c = 26.203
5 745 730 αh 53.98 12.71 26.92 6.38 4.22 Al17.2Fe4.15MnSi3.9 a = 12.359, c = 26.14
Tp―Onset temperature for the intermetallic phase formation;Ts―Isothermal treatment temperature.aAverage of eight SEM/EDS analyses of the
ex-tracted particles, for each alloy.
Figure 1. (a) Schematic illustration of the graphite cup and lid used to carry out the thermal analysis experiments; (b) Experimental setup used for the isothermal treatments.
pure aluminum 660.4˚C. The temperature-time data were recorded using a 16-bit resolution Daq Temp 14A card linked to a computer.
2.3. Isothermal Treatments
[image:3.595.145.482.390.517.2]2.4. Differential Thermal Analysis (DTA)
In order to provide microstructural evidence indicating the nucleation relationship between Fe-rich phases and oxide films, experiments were carried out in a DTA apparatus model 7 (Perkin Elmer). Round samples with weights of about 0.06 g were taken from the alloys. The measurements were carried out in the range of 400 to 900˚C with a heating and cooling rate of 0.083˚C/s under ambient air conditions. The temperature was measured with Pt-Pt/Rh thermocouples and the thermocouples’ precision was assessed by measuring the melting tempera-ture of pure aluminum 660.5˚C.
2.5. Characterization of Intermetallics
Extracted intermetallic particles were characterized in a JEOL JSM-6300 scanning electron microscope (SEM) equipped with an energy dispersive X-ray spectrometer (EDS). EDS spectra were recorded with an acquisition time of 30 s. For the crystal structure determination, the powder, produced by grinding the extracted particles was analyzed by X-ray diffraction (XRD) using a Phillips X’ Pert 3040 diffractometer with CuKα radiation; the lattice parameters (see Table 2) were obtained by Nelson-Riley analysis.
3. Results and Discussion
Figure 2 shows the cooling curve obtained for the alloy 1 cooled at a rate of ~1˚C/s; its first derivative is also included. Each thermal arrest in the cooling curve is associated with the formation temperature of a microstruc-tural phase; the corresponding Tp was estimated with the aid of an associated peak appearing in the first deriva-tive curve (dotted line in Figure 2). According to microstructural observation of the cross area of the alloy 1, the formation temperature of αsc-AlFeMnSi phase (hereinafter denoted as αsc) is associated with the first thermal ar-rest occurring in the curve, the second is related with the formation of primary silicon particles and the last represents the heat release during eutectic reaction. Figure 3 shows SEM images of the αsc phase formed in alloy 1, the irregular morphology observed in the as-cast samples is shown in Figure 3(a), and the polyhedral mor-phology observed in the isothermally-treated samples is shown in Figure 3(b) and Figure 3(c). In Figure 3(d) is shown the whole sample obtained by DTA, in this sample can be seen the irregular morphology of the αsc phase, also can be confirmed that this phase not presents direct physical contact with the oxide film of α-Al2O3 formed in the sample’s surface by natural oxidation. The presence of α-Al2O3 in the isothermally-treated samples was confirmed by SEM and XRD, as is shown in Figure 6(c), Figure 8 and Figure 10(c), shown in the following paragraphs. Additionally, some research suggest that oxides such as α-Al2O3 may be present within oxide films depending on the superheating temperature, in this work 900˚C, which favors the transformation of oxide films from γ-Al2O3 to α-Al2O3[22].
Figure 3. SEM micrographs showing the morphology of the αsc-AlFeMnSi
phase found in alloy 1. (a) As-cast; (b) Isothermally-treated; (c) Extracted αsc
particles; (d) DTA sample.
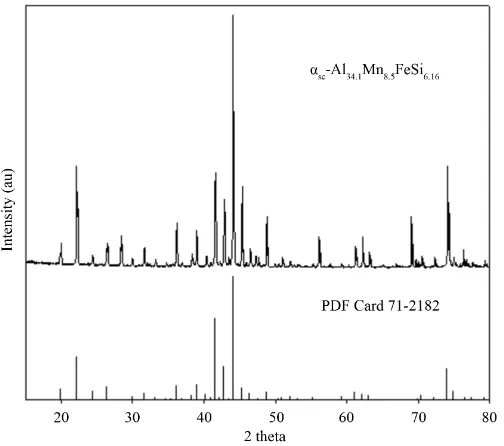
The intermetallics extracted from the isothermally-treated samples of alloy 1 (see Figure 3(c)), were analyzed by XRD. As can be observed in Figure 4, all peaks correspond to the Al50Mn12Si7 phase (JCPDS card number 71-2182); this phase exhibits a simple cubic (sc) crystal structure with a Pm3 space group [23]. In this work, however, according to the EDS data given in Table 2, the extracted intermetallic actually corresponds to the αsc-Al34.1FeMn8.5Si6.16 formula, with a Fe/Mn weight ratio of 0.12, and a total concentration of transition metals (Fe + Mn) of 32.4%. In comparison, in Figure 4 are shown the XRD pattern of the Al50Mn12Si7 phase and the experimental XRD pattern of the αsc-Al34.1FeMn8.5Si6.16 phase. It is observed that both patterns show similar peaks, in some cases the peaks intensity and the 2θ angles change in a little extent. This behavior has been attri-butable to the substitution of manganese atoms by iron atoms [4] [24] in the lattice sites of the crystal structure. Similar results were observed for the αbcc and αh-AlFeMnSi phases, shown in the following paragraphs.
The cooling curve obtained for the alloy 3 clearly reveals three slope changes during solidification process, as is shown in Figure 5. Based on microstructural analysis, the first slope change observed is related with the for-mation temperature of αbcc-AlFeMnSi phase (hereinafter abbreviated as αbcc). For the second slope change, the possible reaction indicates the formation of β-AlFeSi and silicon particles. The β phase was not analyzed by XRD due to the small amount formed in the isothermally-treated samples and the fact that it was mixed with the previously formed αbcc phase; however, it was identified as β phase based on its typical morphology reported in literature data [25]. Finally, the third slope change is related to the eutectic reaction that is the last to solidify.
SEM micrographs of the αbcc phase are shown in Figure 6. The irregular morphology of the αbcc phase can be observed in the as-cast sample (Figure 6(a)), and the polyhedral morphology in some intermetallics extracted from the isothermally-treated samples shown in Figure 6(b) and Figure 6(c). Figure 6(c), also shows αbcc par-ticles formed on the surface of a α-Al2O3 oxide film, this observation provided the first direct evidence that the αbcc phase can nucleate and grow on the surface of α-Al2O3 oxide films. Figure 6d can be considered as another evidence for the association between αbcc phase and α-Al2O3 oxide films, in this Figure is shown a sample of the alloy 3 obtained by DTA, in the sample can be seen polyhedral αbcc particles revealing that this phase presents direct physical contact with the α-Al2O3 oxide film formed in the sample’s surface by natural oxidation.
Figure 4. XRD pattern obtained for the αsc-Al34.1FeMn8.5Si6.16 phase
extracted from alloy 1.
Figure 5. Cooling curve and its first derivative for the alloy 3, obtained at an average cooling rate of ~1˚C/s.
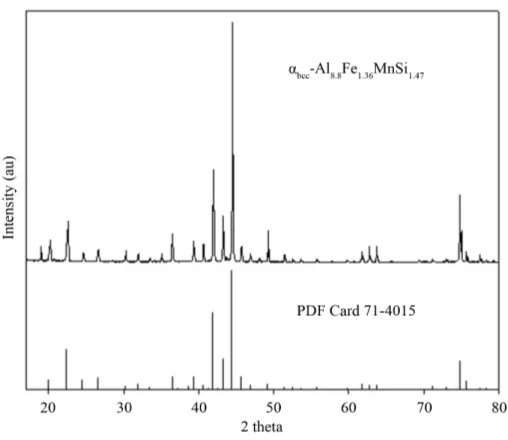
ticles corresponded to the αbcc-Al8.8Fe1.36MnSi1.47 formula. Also, the EDS data given show that the iron contained in the αbcc phase increased, while the manganese contained decreased with increasing iron content in the alloy. The total concentration of transition metals (Fe + Mn) in the αbcc phase fell in the range of 31% - 32%, when iron was added to the alloys. The Fe/Mn weight ratio was in the range of 0.45 - 1.39 for the extracted αbcc phase, therefore the Fe/Mn weight ratio depended on the alloy’s chemical composition. It is noteworthy that similar re-sults were obtained for the alloy 2 shown in Table 2.
[image:6.595.187.440.340.526.2]Figure 6. SEM micrographs showing the morphology of the αbcc-AlFeMnSi
phase found in alloy 3. (a) As-cast; (b) Extracted αbcc particles; (c) αbcc
[image:7.595.170.456.82.324.2]par-ticles formed on α-Al2O3 oxide film; (d) DTA sample.
Figure 7. XRD pattern obtained for the αbcc-Al8.8Fe1.36MnSi1.47 phase
extracted from alloy 3.
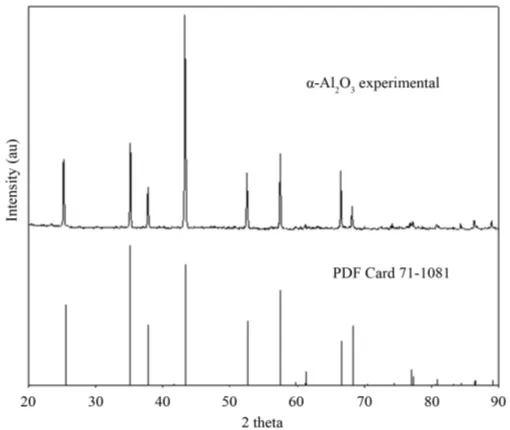
[image:7.595.186.440.366.586.2]Figure 8. XRD pattern obtained for the α-Al2O3 formed by natural oxi-
dation in the experimental aluminum alloys.
Figure 9. Cooling curve and its first derivative for the alloy 4, obtained at an average cooling rate of ~1˚C/s.
can nucleate and grow on the wetted surface of α-Al2O3 oxide films.Figure 10(d) shown a sample of the alloy 4 obtained by DTA, this sample has revealed that αh particles with polyhedral morphology are located on the wet-ted surface of the oxide film formed in the sample’s surface by natural oxidation, so can be established that the αh phase presents direct physical contact with the α-Al2O3 oxide film. This observation can support the associa-tion between αh phase and α-Al2O3 oxide film.
[image:8.595.186.441.340.537.2]Figure 10. SEM micrographs showing the morphology of the αh-AlFeMnSi
phase found in alloy 4. (a) As-cast; (b) Extracted αh phase; (c) αh particles form-
[image:9.595.171.456.81.325.2]ed on α-Al2O3 oxide film; (d) DTA sample.
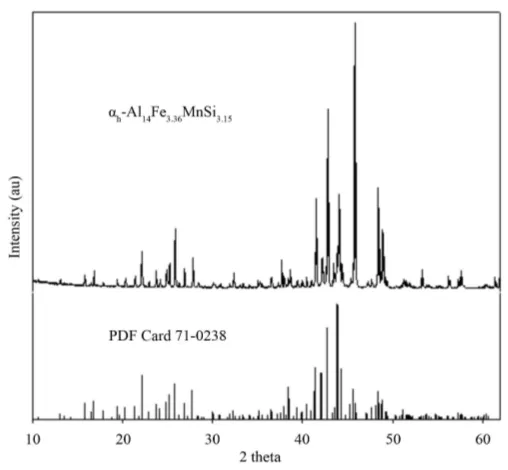
Figure 11. XRD pattern obtained for the αh-Al14Fe3.36MnSi3.15 phase ex-
tracted from alloy 4.
tablished that the Fe/Mn weight ratio depended on the alloy’s chemical composition. It is worth mentioning that similar results were observed for the alloy 5 shown in Table 2.
[image:9.595.186.440.367.602.2]act as a preferential nucleation site for αbcc and αh phases due to the similarity in their crystal structure. Also, if α-Al2O3 oxide film is a good nucleant for αbcc and αh phases, it is expected that it will determine the spatial dis-tribution of these phases, as can be observed in Figure 6(d) and Figure 10(d), where the αbcc and αh particles are located on the oxidized melt surface in DTA samples of alloys 3 and 4. This observation tends to support the as-sumption that α-Al2O3 oxide films act as a preferential nucleation site for αbcc and αh phases.
Careful studies of crystallographic orientation relationships may be another way to confirm that α-Al2O3 oxide film is a good nucleant for αbcc and αh phases. In general, it is accepted that the mismatch of crystal struc-tures, the electronic nature of the crystal bonds of the two phases, superheating, and the presence of alloying elements are factors that may influence the favorability of nucleation.
On the other hand, for the β phase formed in the experimental alloys, was not found direct physical contact with the α-Al2O3 oxide film formed in the sample’s surface by natural oxidation, as can be seen in Figure 6(d) and Figure 9(d). This observation led us to assume that between the β phase and α-Al2O3 oxide films there is not good atomic contact and good lattice match, thus, the β phase did not appear to nucleate and grow on the surface of α-Al2O3 oxide films.
According to the Mn content of the studied alloys could be expected the formation of MnO·Al2O3, Mn2O3, or MnO·SiO2 particles, however, the presence of these oxides was not detected by X-ray diffraction, as can be seen in Figure 8. Another effect that could be expected is that Mn content had an effect on the alumina transforma-tion from γ-Al2O3 to α-Al2O3, nonetheless, according to the experimental XRD pattern of the α-Al2O3, shown in Figure 8, such effect was discarded for the studied temperature range. Thus, it was thought that Mn content just become embedded in the solidification of the αsc, αbcc and αh phases. This observation is in accordance with some research [4] [24], that suggest that many ternary AlFeSi intermetallics can accept Mn atoms into solid so-lution, which reflects the fact that Mn atoms may replace the Fe atoms in their crystal structure. Finally, it is important study whether the Fe-rich intermetallic phases can nucleate at all without the presence of oxide films in aluminum melts. This important question is not easily answered because obtaining aluminum melts free from oxide films remains difficult.
4. Conclusion
According to the experimental results, it can be established that the αbcc and αh phases nucleate and grow on the wetted surface of α-Al2O3 oxide films formed by natural oxidation in aluminum melts. On the other hand, the β particles formed in the experimental alloys not presents direct physical contact with the α-Al2O3 oxide films, thus, the β phase did not appear to nucleate on α-Al2O3 oxide films.
Acknowledgements
The authors are grateful to the National Council for Science and Technology of Mexico (Conacyt) for the finan-cial support provided to carry out this work (Project No. 149030).
References
[1] Preston, R.S. and Gerlach, R. (1971) Mössbauer Effect in Dilute Alloys of Iron in Aluminum. Physical Review B, 3, 1519. http://dx.doi.org/10.1103/PhysRevB.3.1519
[2] Stefaniay, V., Griger, A. and Turmezey, T. (1987) Intermetallic Phases in the Aluminium-Side Corner of the AlFeSi-Alloy System. Journal of Materials Science, 22, 539-546. http://dx.doi.org/10.1007/BF01160766
[3] Crepeau, P.N. (1995) Effect of Iron in Al-Si Casting Alloys: A Critical Review. AFS Transactions, 103,361-366. [4] Kuijpers, N.C.W., Vermolen, F.J., Vuik, C., Koenis, P.T.G., Nilsen, K.E. and van Zwaag, S. (2005) The Dependence
of the β-AlFeSi to α-Al(FeMn)Si Transformation Kinetics in Al-Mg-Si Alloys on the Alloying Elements. Materials Science and Engineering A, 394, 9-19. http://dx.doi.org/10.1016/j.msea.2004.09.073
[5] Backerud, L., Król, E. and Tamminen, J. (1986) Solidification Characteristics of Aluminum Alloys. Vol. 1, AFS/Skana- luminum, Oslo.
[6] Kral, M.V., Nakashima, P.N.H. and Mitchell, D.R.G. (2006) Electron Microscope Studies of Al-Fe-Si Intermetallics in an Al-11 Pct Si Alloy. Metallurgical and Materials Transactions A, 37A, 1987-1997.
http://dx.doi.org/10.1007/s11661-006-0141-8
Mate-rials Science, 36, 937-941. http://dx.doi.org/10.1023/A:1004815621313
[8] Mondolfo, L.F. (1976) Aluminum Alloys: Structure and Properties. Butterworths and Co., Ltd., London, 806.
http://dx.doi.org/10.1016/B978-0-408-70932-3.50404-6
[9] Barlock, J.G. and Mondolfo, L.F. (1975) Structure of Some Aluminium-Iron-Magnesium-Manganesesilicon Alloys.
Zeitschrift Fur Metallkunde, 66, 605.
[10] Corby, R.N. and Black, P.J. (1977) The Structure of Aluminum-Iron-Silicon (α-(A1FeSi)) by Anomalous-Dispersion Methods. Acta Crystallographica Section B, 33, 3468-3475. http://dx.doi.org/10.1107/S0567740877011224
[11] Murali, S., Raman, K.S. and Murthy, K.S.S. (1992) Effect of Magnesium, Iron (Impurity) and Solidification Rates on the Fracture Toughness of Al-7Si-0.3Mg Casting Alloy. Materials Science and Engineering: A, 151, 1-10.
http://dx.doi.org/10.1016/0921-5093(92)90175-Z
[12] Shabestari, S. and Gruzleski, J.E. (1995) Gravity Segregation of Complex Intermetallics Compounds in Liquid Alumi-num-Silicon Alloy.Metallurgical and Materials Transactions A, 26, 999-1006. http://dx.doi.org/10.1007/BF02649097
[13] Romming, C., Hansen, V. and Gjonnes, J. (1994) Crystal Structure of β-Al4.5FeSi. Acta Crystallographica Section B, 50, 307-312. http://dx.doi.org/10.1107/S0108768193013096
[14] Mulazimoglu, M.H., Zaluska, A., Gruzleski, J.E. and Paray, F. (1996) Electron Microscope Study of Al-Fe-Si Inter-metallics in 6201 Aluminum Alloy. Metallurgical and Materials Transactions A, 27, 929-936.
http://dx.doi.org/10.1007/BF02649760
[15] Vybornov, M., Rogl, P. and Sommer, F. (1997) On the Thermodynamic Stability and Solid Solution Behavior of the Phases τ5-Fe2Al7.4Si and τ6-Fe2Al9Si2. Journal of Alloys and Compounds, 247, 154-157.
http://dx.doi.org/10.1016/S0925-8388(96)02602-3
[16] Shabestari, S.G., Mahmudi, M., Emamy, M. and Campbell, J. (2002) Effect of Mn and Sr on Intermetallics in Fe-Rich Eutectic Al-Si Alloy. International Journal of Cast Metals Research, 15, 17-24.
[17] Cao, X. and Campbell, J. (2004) Effect of Sr on Primary α-Fe Phase in Liquid Al-11.5Si-0.4Mg Cast Alloy. Materials
Science and Technology, 20, 514-520.
[18] Cao, X. and Campbell, J. (2004) The Solidification Characteristics of Fe-Rich Intermetallics in Al-11.5Si-0.4-Mg Cast
Alloy. Metallurgical and Materials Transactions A, 35, 1425-1435. http://dx.doi.org/10.1007/s11661-004-0251-0
[19] Miller, D.N., Lu, L. and Dahle, A.K. (2006) The Role of Oxides in the Formation of Primary Ironintermetallics in an Al-11.6Si-0.37Mg Alloy. Metallurgical and Materials Transactions B, 37, 873-878.
http://dx.doi.org/10.1007/BF02735008
[20] Khalifa, W., Samuel, F.H., Gruzleski, J.E., Doty, H.W. and Valtierra, S. (2005) Nucleation of Fe-Intemetallics Phases in the Al-Fe-Si Alloys. Metallurgical and Materials Transactions A, 36, 1017-1032.
http://dx.doi.org/10.1007/s11661-005-0295-9
[21] Lu, L. and Dahle, A.K. (2005) Iron-Rich Intermetallics Phases and Their Role in Castings Defect Formation in Hypo- eutectic Al-Si Alloys. Metallurgical and Materials Transactions A, 36, 819-835.
[22] Anantha Narayanan, L., Samuel, F.H. and Gruzleski, J.E. (1994) Crystallization Behavior of Iron Containing Interme-tallics Compounds in 319 Aluminum Alloy. Metallurgical and Materials Transactions A, 25, 1761-1773.
http://dx.doi.org/10.1007/BF02668540
[23] Cooper, M. and Robinson, K. (1966) The Crystal Structure of the Ternary Alloy α (AlMnSi). Acta Crystallographica,
20, 614-617. http://dx.doi.org/10.1107/S0365110X6600149X
[24] Schurer, P.J., Koopmans, B. and Van der Woude, F. (1988) Structure of Icosahedral Al-(M1−xFex) Alloys (M = Cr, Mn,
or Fe).Physical Review B, 37, 507-510. http://dx.doi.org/10.1103/PhysRevB.37.507
[25] Rivlin, V.G. and Raynor, G.V. (1981) Critical Evaluation of Constitution of Al-Fe-Si System. International Metals Reviews, 26, 133-152.
[26] Cooper, M. (1967) The Crystal Structure of the Ternary Alloy α (AlFeSi). Acta Crystallographica, 23, 1106-1107.
http://dx.doi.org/10.1107/S0365110X67004372
[27] Saalfeld, H. (1964) The Crystal Chemistry of Al2O3-Cr2O3. Zeitschrift für Kristallographie—Crystalline Materials, 120,
342-348. http://dx.doi.org/10.1524/zkri.1964.120.4-5.342