© 2016, IRJET | Impact Factor value: 4.45 | ISO 9001:2008 Certified Journal | Page 551
Reverse Engineering of Pump Casing and Impeller
Vyankatesh R Wakharkar
1, Dr. R. B. Buktar
21
M Tech Student, Mechanical Engineering Department, SPCE Mumbai, Maharashtra, India
2
Professor, Mechanical Engineering Department, SPCE Mumbai, Maharashtra, India
---***---Abstract - Reverse Engineering (RE) is usually undertakenin order to produce a virtual 3D CAD model of a component or to redesign the system for better maintainability with the assumption that there is no access to original design data or the original design data has been lost or never existed. Recent advancements in the field of contact and non-contact type 3D measurement systems has led to advancement in Reverse Engineering. This paper presents a method of Reverse Engineering applied to a case of Pump Casing and its Impeller in order to recover the original design. The paper gives detailed insight on manual surface reconstruction with the help of wireframe model, wireframe model being created from intersecting curves forming a three or four sided surface patch. The surface model is then analyzed for surface continuity between different surface patches and finally a 3D deviation report is plotted in order to get a complete deviation idea between scan data and extracted design.
Keywords: Reverse Engineering, 3D Scanner, Point Cloud,
Surface Reconstruction, 3D Deviation.
1. INTRODUCTION
Reverse Engineering in general is the process of extracting knowledge or design information. This may often involve disassembling something (a mechanical assembly or device, electronic component, etc.) and analyze its components and working in detail. But when it comes to Reverse Engineering in Mechanical CAD, it means creating a virtual 3D CAD model of a component with the assumption that there is no access to original design data or the original design data has been lost or never existed [1]. In Forward or General Engineering we begin with an idea and end up with a finished product, but in reverse engineering we begin with a physical component and end up with a 3D CAD model.
Reverse Engineering process starts with converting real world images into virtual 3D data which is done using 3D measurement equipment, procedure being called scanning. Various factors are considered while scanning of the component, such as reflect ability of the component, its surface quality, the manufacturing process the component has undergone. Expectation for quality scan is matt, bright surface [2]. The output of scanning process being point cloud is used for fitting surface patches in order to create the skin of the 3D component.
Depending on the end requirement, the quality of surface constructed may differ. For instance, sometimes the requirement is only for a rapid prototyping in order to
have a good idea of shape contours of the component. In such case it would be too time consuming to generate a high quality surface despite of requirement. However in other cases like automotive body panels or aircraft surface components, for aerodynamic, aesthetic and visual appealing reasons, smooth lines and contours are needed as the basic requirement.
Surface creation is the most challenging, time consuming and crucial process in Reverse Engineering. A number of software packages are available in the market, which specialize in dealing with surfacing. Among the different procedures involved for surfacing in Reverse Engineering, one is creation of surface from meshing of the point cloud, other is Rapid Surfacing wherein surface patch is created from intersecting curves forming a three or four sided patch [3], for which a wireframe or skeleton model consisting a number of intersecting curves needs to be extracted from the point cloud in order to create a suitable CAD model.
This paper describes the digitizing process of the component right from scanning, STL file extraction, surfacing and 3D deviation check of the extracted CAD model. The approach used for surface creation is combination of manual and semiautomatic method. Although manual method involves more time and attention but yields in a far better quality of surface [3].
2. Reverse Engineering Procedure
2.1 Hardware and Digitization from component.
© 2016, IRJET | Impact Factor value: 4.45 | ISO 9001:2008 Certified Journal | Page 552
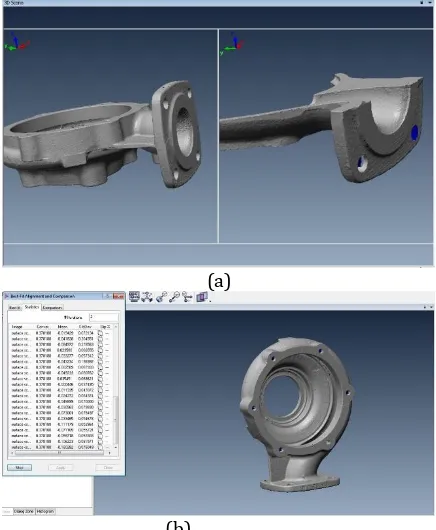
accuracy of 30µm is used to scan the surface of pumpcasing and impeller [5]. The software used is POLYWORKS V12 for scanning and extracting the STL file [6]. The complete scanning of the pump casing and impeller took 2.5 hours, multiple set or groups of scans were taken in order to capture all the geometric features. The operator must ensure that in order to align two or more different set or group of scans, they must have some common shape features. Later this group of scans are aligned using manual shape based alignment to bring all scans in one coordinate system under IMAlign module. In order to scan all geometric features, firstly complete geometry was scanned, later the Pump Casing and Impeller were cut down into two parts to access the inner design features, later all the three different scans were combined using shape based manual alignment method.
Figure 1. (a) Photograph of Impeller (b) Photograph of Pump Casing (c) Romer Absolute Arm with Scanner
2.2 Preprocessing of the Point Clouds.
Once all the geometric features of component are scanned and brought under one coordinate system, alignment procedure begins. A group of scan is first locked and other group of scans is aligned using common shape features manually as shown in Figure 2 (a) under IMAlign module in Polyworks. This initial alignment is further improved by deploying a least square iterative algorithm using a Best Fit alignment command to reduce the surface overlap distance between different group of scans until good shape and optimal scan is obtained as shown in Figure 2 (b). When a good and optimized scan is achieved the last step involved is to optimize the number of scan data points.
The scan geometry is then checked and treated for any noise, i.e. unwanted scan points which may have induced due to improper handling or manual error or obstruction in scanning, etc. using IMEdit module in Polyworks [1,2,3,10]. As the scanning is done manually patch by patch over the entire surface of the component. This may lead to overlap of the scan data in the point cloud
as the operator has to look on the computer screen and operate the machine. This leads to number of scan points way much over the bare minimum required to define the geometric features or entities of the component. Further this heavy point cloud may lead to delay in system response. Hence to ensure the number of points to be just enough to define all the dimensions, point overlay reduction is carried out which deploys a least square systematic iterative algorithm so as to have a strict control over the density and distribution of the points until a desired convergence is obtained. A total of 292915 number of data points were observed after point overlay reduction.
(a)
(b)
Figure 2 (a) Manual shape alignment in IMAlign module (b) Best Fit alignment in progress
2.3 Extraction of STL file.
Before extraction of the STL file, the imperfections such as missing data points, gaps, holes, etc. in the scan data are to be eliminated and refurbished and further optimized [1,2,3,10]. The output of the point cloud or the POLYWORKS software is .pwk file which is not readable on many platforms. In order to be readable for the file on various platforms, a stereolithography (STL) file needs to be extracted. The extraction of file may take time as the process is itself time consuming. It took 20-30 minutes for STL file to extract. Depending upon the complexity and the dimensions of the geometry sometimes the extraction may take several hours.
[image:2.595.324.542.263.528.2] [image:2.595.50.265.297.475.2]© 2016, IRJET | Impact Factor value: 4.45 | ISO 9001:2008 Certified Journal | Page 553
3 Surfacing and solid model.
3.1 Surfacing of Impeller.
The Impeller point cloud or STL file is called upon into the Geomagic Studio software which specializes in dealing with surfacing for point cloud. Geomagic Studio builds a new ground in freeform modeling technology, providing a unique and comprehensive approach to 3D modeling and inspection for every stage of product design. We can play with point cloud in a number of ways in this software.
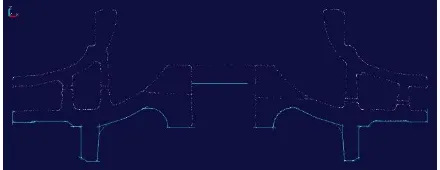
[image:3.595.323.547.198.792.2]The first and foremost important thing is to allot coordinate system to the point cloud. For this to do a series of steps are to be followed. Once allotment of coordinate system is done, it becomes very easy to extract the design of the impeller. In this case the coordinate system was in alignment with z axis and placed on the plane surface as seen from top view. As the impeller is axis symmetric around the Z axis of its centerline of rotation. Hence a majority geometry or design of impeller can be extracted using a single cross section along the radial direction. Taking a section along the x axis of the impeller will highlight a set of points as shown in Figure 3. Using basic commands such as 2 point line, 3 point arc, 3 point circle, etc. an approximate but good sketch along the impeller section of point cloud is constructed. The fillets, chamfers and other such end operations shall be done after a solid model is obtained.
Figure 3. Different radial sections of Impeller
Once the sketch is drawn, it is simply revolved as surface around the z axis of the coordinate system which results in the bottom surface of the impeller as shown in Figure 4 (a). Now one should note that the surface drawn is merely from a section of point cloud, when checked for deviation it may or may not satisfy the desired or complete point cloud. Hence different radial sections in different radial directions are taken and the best suited, least deviation plot surface is selected. The drawn surface may or may not comply with the complete scan data. Hence a quick deviation check is performed between point cloud ant the surface drawn. The max and min deviation to be checked is for +/- 1mm with an increment of +/- 0.1mm on either sides with a color plot resolution of 0.001. The deviation is as shown in Figure 4 (b). It gives us a good idea about the point deviation between point cloud and surface. For a surface to be good the majority of the point
cloud should lie in grey scale. Similar process and deviation check is performed for the rest of the impeller.
Unlike others the critical vane geometry design cannot be extracted using basic set of surface primitive commands. A non-primitive approach is used to extract the vane design and quick deviation check is performed. The vane face geometry was extracted using a number of different commands.
(a)
(b)
(c)
(d)
[image:3.595.51.271.453.538.2]© 2016, IRJET | Impact Factor value: 4.45 | ISO 9001:2008 Certified Journal | Page 554
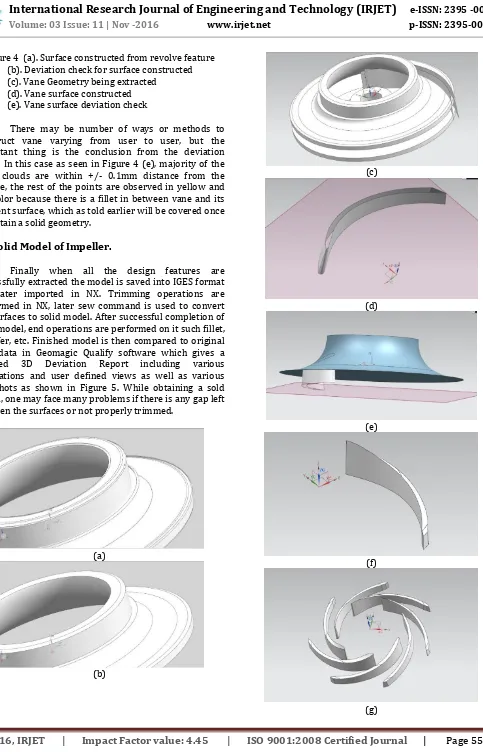
Figure 4 (a). Surface constructed from revolve feature(b). Deviation check for surface constructed (c). Vane Geometry being extracted
(d). Vane surface constructed (e). Vane surface deviation check
There may be number of ways or methods to construct vane varying from user to user, but the important thing is the conclusion from the deviation check. In this case as seen in Figure 4 (e), majority of the point clouds are within +/- 0.1mm distance from the surface, the rest of the points are observed in yellow and red color because there is a fillet in between vane and its adjacent surface, which as told earlier will be covered once we obtain a solid geometry.
3.2 Solid Model of Impeller.
Finally when all the design features are successfully extracted the model is saved into IGES format and later imported in NX. Trimming operations are performed in NX, later sew command is used to convert the surfaces to solid model. After successful completion of solid model, end operations are performed on it such fillet, chamfer, etc. Finished model is then compared to original scan data in Geomagic Qualify software which gives a detailed 3D Deviation Report including various annotations and user defined views as well as various snapshots as shown in Figure 5. While obtaining a sold model, one may face many problems if there is any gap left between the surfaces or not properly trimmed.
(a)
(b)
(c)
(d)
(e)
(f)
[image:4.595.62.545.46.800.2]© 2016, IRJET | Impact Factor value: 4.45 | ISO 9001:2008 Certified Journal | Page 555
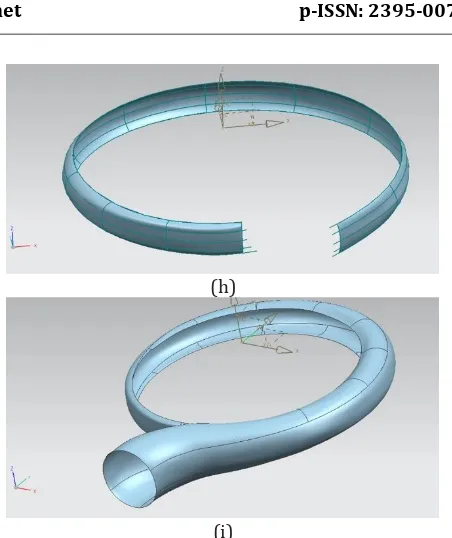
(h)(i)
(j)
Figure 5 (a). Before trimming (b). After trimming
(c). Vane surface imported (d). Vane geometry
(e). Vane geometry top & bottom faces construction (f). Solid body of Vane
(g). Associative circular copy of Vane–Total 7 Vanes
(h). Complete Solid Body generation after use of Sew command
(i). End operations in progress - Fillet, chamfer, etc. (j). Complete Impeller Geometry
3.3 3D Deviation Report of impeller.
After successful extraction of geometric parameters, the complete solid model of impeller must be checked for deviation to get a correct and precise idea about the deviation of each and every surface point on the constructed solid model using Geomagic Qualify. Geomagic delivers the highest accuracy, speed and comprehensive, automated reporting on the quality of as-built parts for first-article inspection, production inspection using CMM and laser scanning tools.
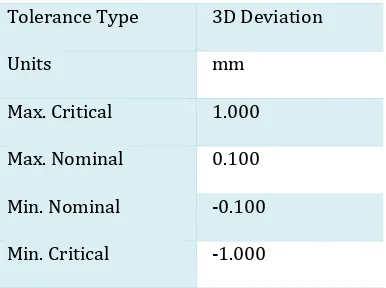
Scan data STL file and IGES file of impeller is imported into the software. IGES model of impeller is set as reference and scan data of it as test specimen. A total of 292915 number of data points were tested for 3D deviation check. The parameters for the test are as in the table given below.
Tolerance Type 3D Deviation
Units mm
Max. Critical 1.000
Max. Nominal 0.100
Min. Nominal -0.100
[image:5.595.50.271.90.484.2]Min. Critical -1.000
Table 1. Parameters for Deviation check
A detailed report was made and different annotations were plotted to get deviation at the desired point. The software is very helpful in customizing the way one desires its report. As the impeller was manufactured by casting process, hence the process induces surface roughness and surface variation. As around 74% of the points lie in the range of +/- 0.4 mm, the design extracted is a good design. The following table gives detailed deviation distribution of the data points.
>=Min <Max # Points %
-1.000 -0.700 4709 1.608
-0.700 -0.400 22194 7.577
-0.400 -0.100 53241 18.176
-0.100 0.100 94409 32.231
0.100 0.400 68738 23.467
0.400 0.700 15467 5.280
0.700 1.000 5750 1.963
[image:5.595.340.533.190.334.2]© 2016, IRJET | Impact Factor value: 4.45 | ISO 9001:2008 Certified Journal | Page 556
(a)(b)
(c)
(d)
Figure 6 (a). Scan data being set as test specimen (b). IGES model being set as reference (c). Annotation view 1 of model (d). Annotation view 2 of model
3.4 Surfacing of Pump Casing.
The first and foremost important thing is to assign the scan data a coordinate system, in this case the top surface of the casing where the outer covering will be bolted is selected as the plane for the coordinate system and the center of the volute casing as the final position because it will be easier for the geometric entities to extract same as impeller.
Unlike the impeller, Pump casing is a bit different to capture the geometric entities, it consists of volute casing for design reasons. The shape of volute casing cannot be captured using traditional approach, hence to extract the wireframe model to replicate the complete surface by constructing small patches all the over the volute section of the casing.
The term wire frame comes from designers using metal wire to represent the three-dimensional shape of solid objects. 3D wire frame allows to construct and manipulate solids and solid surfaces. Using a wire-frame model allows visualization of the underlying design structure of a 3D model. The wireframe technique will be used for inner and outer volute profile of the pump casing, rest of the parameters will be captured by traditional or logical approach. The inner profile of the point cloud is separated from the casing and sections are taken as described below.
(a)
© 2016, IRJET | Impact Factor value: 4.45 | ISO 9001:2008 Certified Journal | Page 557
(c)
(d)
(e)
(f)
(g)
(h)
(i)
Figure 7 (a). 12 radial cross sections on the inner profile of point cloud
7 (b). Point cloud after radial and horizontal sections 7 (c). Circumferential B-spline in progress
7 (d). Cross B-Spline in progress
7 (e). Wireframe model in Geomagic Studio 7 (f). Complete wireframe model in NX 7 (g) & (h). Surface patches in progress 7 (i). Complete inner profile surface in NX
In the industry, the casing is designed using various formulas and a number of radial cross sections parameters are obtained. These cross sections are later utilized to construct a CAD model in software. The industry practice is to take 12 to 13 radial cross sections starting from the tongue of the casing and progressing along the circumferential direction [8]. The same approach is used to capture the design of the casing, 12 radial cross sections were taken in Geomagic Studio software as shown in Figure 7 (a) starting from the tongue of the casing, and also horizontal sections were taken for circumferential B-splines. Thus we get a skeleton model of point cloud sections as shown in Figure 7 (b).
[image:7.595.322.548.66.335.2]© 2016, IRJET | Impact Factor value: 4.45 | ISO 9001:2008 Certified Journal | Page 558
(f) shows complete wireframe model of the inner profile of the casing. This wireframe model is saved and exported in IGES format to Siemens NX. Surface patches are constructed using ‘Through Curve Mesh’ command in Siemens NX software as shown in Figure 7 (g) & (h). Figure 7 (i) shows the complete surface model of the inner profile of the casing.
[image:8.595.53.270.273.392.2]Of the five main B-splines drawn which are covering the major area of the inner profile and almost identical, one is chosen and comb analysis is shown in Figure 8. The comb analysis indicates the smooth variation of curve along the circumferential direction, the negative comb indicates change in slope of curve with smooth variation indicating no abrupt changes in curve.
Figure 8. Comb analysis of B-Spline.
[image:8.595.322.543.396.506.2]STL file can be only read but not operated in Siemens NX, Figure 9 shows scan data overlapped with surface model of inner profile of casing. This gives a brief idea about the surfaces constructed.
Figure 9. Inner profile Scan data (blue color) overlapped with surface data of inner profile of casing.
The constructed surface was again called back in Geomagic Studio and a quick deviation check was performed as shown in Figure 10.
Figure 10. Deviation check for inner profile constructed.
The deviation check parameters were +/- 2 mm with an increment of +/- 0.1 mm as the casing was a casted one. The results shows that the constructed surface of inner profile is a good, smooth and continuous, and a satisfactory number of points lie on the surface constructed.
The zebra analysis is a tool for diagnostic shading to visualize curvature and continuity of surfaces. The zebra analysis is done for inner profile of the casing to check for smoothness and continuity between different surface patches [3]. Figure 11 shows zebra analysis for inner profile. The analysis below indicates smooth continuity between different surface patches.
Figure 11. Zebra analysis for inner profile
Similar procedure is repeated for the outer volute profile of the casing. Wireframe model is first obtained in Geomagic Studio and surfacing is done in Siemens NX.
[image:8.595.49.272.485.591.2] [image:8.595.325.544.567.688.2]© 2016, IRJET | Impact Factor value: 4.45 | ISO 9001:2008 Certified Journal | Page 559
(b)
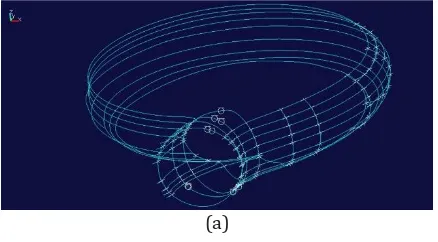
Figure 12. (a) Wireframe model of outer volute profile (b). Surface construction from wireframe.
The rest of the surface are extracted using traditional or logical approach. The bottom inner surface is extracted same by applying the same procedure as that of impeller i.e. taking multiple sections along X & Y planes and cross section is constructed using basic set of commands, then revolve the section around Z axis which will generate a surface, among the multiple sections one with best fit and least deviation is selected after surfacing.
(a)
(b)
(c)
(d)
(e)
(f)
(g)
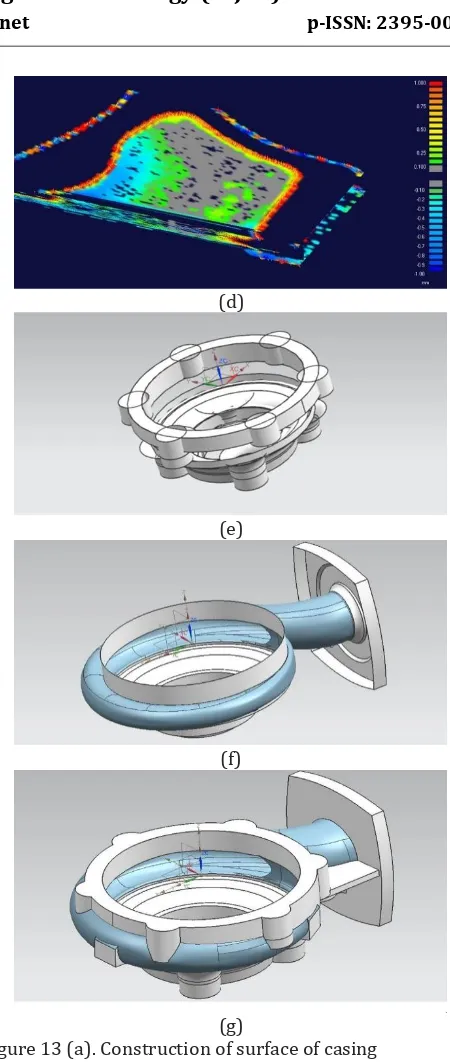
Figure 13 (a). Construction of surface of casing (b). Deviation check for surface
(c). Outer rib surface of casing (d). Deviation check for surface
(e). Surface construction using traditional approach (f). Complete inner profile of casing after trimming
(g). Complete surface profile of casing after trimming without holes, fillets, etc.
3.5 Solid model of Pump Casing.
[image:9.595.318.543.60.591.2] [image:9.595.52.273.352.725.2]© 2016, IRJET | Impact Factor value: 4.45 | ISO 9001:2008 Certified Journal | Page 560
[image:10.595.52.271.144.271.2]together and to leave no surface gaps. After sew operation we get a complete solid model of casing as shown in Figure 14.
Figure 14. Complete solid model of pump casing
After successful conversion into solid model, end operations are performed as shown in Figure 15, such as fillets, chamfers, holes etc. The fillets are actually measured in Geomagic Studio and later applied in Siemens NX.
(a)
(b)
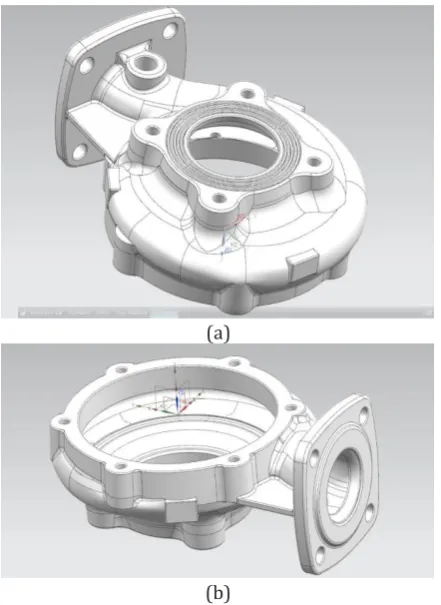
Figure 15 (a) & (b). Complete solid model of Pump Casing after end operations.
3.6 3D Deviation report of Pump Casing.
The solid model of casing is now tested for deviation in Geomagic Qualify. IGES file of pump casing is set as reference and scan data as test specimen, a total 497784 data points were checked for deviation. The parameters for deviation check are given in Table 3.
Tolerance Type 3D Deviation
Units mm
Max. Critical 2.000
Max. Nominal 0.100
Min. Nominal -0.100
[image:10.595.324.545.192.332.2]Min. Critical -2.000
Table 3. Parameters for deviation check.
A detailed report was made and different annotations were plotted to get deviation at the desired point. Following table gives detailed deviation distribution of the 497784 data points of the scan model. The deviation range used is +/- 2 mm with an increment of +/- 0.1 mm.
>=Min <Max # Points %
-2.000 -1.620 1280 0.257
-1.620 -1.240 1547 0.311
-1.240 -0.860 6491 1.304
-0.860 -0.480 18853 3.787
-0.480 -0.100 90910 18.263
-0.100 0.100 218803 43.955
0.100 0.480 112407 22.581
0.480 0.860 24118 4.845
0.860 1.240 8484 1.704
1.240 1.620 2968 0.596
1.620 2.000 2072 0.416
[image:10.595.52.273.362.665.2] [image:10.595.305.566.430.709.2]© 2016, IRJET | Impact Factor value: 4.45 | ISO 9001:2008 Certified Journal | Page 561
(a)
(b)
(c)
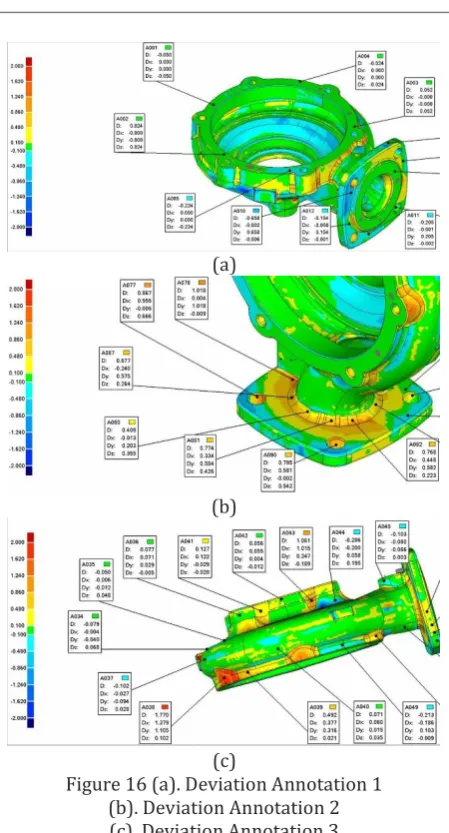
Figure 16 (a). Deviation Annotation 1 (b). Deviation Annotation 2 (c). Deviation Annotation 3
The deviation distribution says that around 93% of the point cloud lies in the range of +/- 0.86 mm. The maximum geometric features have been captured within 1 mm range, but due to some defects some points lie beyond the specified range. Hence deviation distribution range is from +/- 2 mm. The general practice for using range for casted components is +/- 2 mm.
4
Conclusion
Reverse Engineering is an important tool for CAD models. Recent commercial availability of Non-contact systems with high accuracy and precision and availability of commercial CAD packages has led to exploration of RE in various fields with drastic reduction in time and quality for Reverse Engineering.
The impeller geometry was successfully extracted using traditional approach, but in case of vane geometry nontraditional approach was used. Combination of wireframe and traditional approach was used for pump casing geometry extraction, later manual surface patching was used for creating quality surface patches. There may
be other methods employed for Reverse Engineering but manual surface patching for volute profile from wireframe model leads to better surface continuity and ensures smoothness between different surface patches.
Acknowledgement
The authors would like to acknowledge Alacrity Engineering Services Pvt. Ltd., Pune for their motivation, support and supplying us with the required hardware and software.
References
[1] Barbero, B. R. (2009). The recovery of design intent in reverse engineering problems. Computers & Industrial Engineering, 56(4), 1265-1275.
[2] Dúbravčík, M., & Kender, Š. (2012). Application of reverse engineering techniques in mechanics system services. Procedia Engineering, 48, 96-104.
[3] Lecrivain, G., Kennedy, I., & Slaouti, A. (2008). Creation
of Body Surfaces From Reverse-Engineered
Components. Journal of Computing and Information Science in Engineering, 8(2), 024501.
[4] Bagci, E. (2009). Reverse engineering applications for recovery of broken or worn parts and re-manufacturing:
Three case studies. Advances in Engineering
Software, 40(6), 407-418.
[5] Websites of different manufacturers of digitizing equipment: <http://www.hexagonmetrology.us/>, <www.romer.com>, <www.gom.com>
[6] Polyworks V12 software & Manual.
[7] Sansoni, G., & Docchio, F. (2004). Three-dimensional optical measurements and reverse engineering for
automotive applications. Robotics and
Computer-Integrated Manufacturing, 20(5), 359-367.
[8] Vučina, D., Milas, Z., & Pehnec, I. (2012). Reverse Shape Synthesis of the Hydropump Volute Using Stereo-Photogrammetry, Parameterization, and Geometric Modeling. Journal of computing and information science in engineering, 12(2), 021001.
[9] Milroy, M. J., Bradley, C., Vickers, G. W., & Weir, D. J. (1995). G 1 continuity of B-spline surface patches in reverse engineering. Computer-Aided Design, 27(6), 471-478.
[image:11.595.49.274.77.494.2]© 2016, IRJET | Impact Factor value: 4.45 | ISO 9001:2008 Certified Journal | Page 562
through reverse engineering application. Advances inEngineering Software, 37(9), 592-600.
[11] Tubić, D., Hébert, P., & Laurendeau, D. (2004). 3D surface modeling from curves. Image and Vision Computing, 22(9), 719-734.
[12] Mian, S. H., Mannan, M. A., & Al-Ahmari, A. M. (2013).
Multi-sensor Integrated System for Reverse
Engineering. Procedia Engineering, 64, 518-527.
[13] Chang, M., & Park, S. C. (2008). Reverse engineering of
a symmetric object.Computers & industrial
engineering, 55(2), 311-320.
[14] Lulić, Z., Tomić, R., Ilinčić, P., Šagi, G., & Mahalec, I. (2013). Application of reverse engineering techniques in vehicle modifications. In Concurrent Engineering Approaches for Sustainable Product Development in a
Multi-Disciplinary Environment (pp. 921-932). Springer
London.
[15] Raja, V., & Fernandes, K. J. (2007). Reverse engineering: an industrial perspective. Springer Science & Business Media.
[16] Kuo, M. H. (2001). Automatic extraction of quadric surfaces from wire-frame models. Computers & Graphics, 25(1), 109-119.
[17] Mohaghegh, K., Sadeghi, M. H., & Abdullah, A. (2007). Reverse engineering of turbine blades based on design
intent. The International Journal of Advanced
Manufacturing Technology, 32(9-10), 1009-1020.
[18] Wang, W. Application of Reverse Engineering in Manufacturing Industry.
[19] Beccari, C. V., Farella, E., Liverani, A., Morigi, S., & Rucci, M. (2010). A fast interactive reverse-engineering system. Computer-Aided Design, 42(10), 860-873.
[20] Kaszynski, A. A., Beck, J. A., & Brown, J. M. (2013). Uncertainties of an automated optical 3d geometry measurement, modeling, and analysis process for
mistuned integrally bladed rotor reverse
engineering. Journal of Engineering for Gas Turbines and Power, 135(10), 102504.
[21] NX trial version for student.
[22] Geomagic Qualify free trial for 15 days
BIOGRAPHIES
Vyankatesh Wakharkar is an M Tech Machine Design student at
Sardar Patel College of
Engineering, Mumbai. He has completed his graduation from Pune University. The master’s project gave him detailed insight about the modern Reverse Engineering concept.
Dr. Rajesh Buktar is a Professor at Sardar Patel College of Engineering. He has completed his PhD in Technology and has 16 years of experience under his umbrella. His research areas are
IT enabled Technology
Integration in Indian Auto component Industries.