Munich Personal RePEc Archive
Job Separation Behavior of WOTC
Workers: Results from a Unique Case
Study
Gunderson, Jill Marie and Hotchkiss, Julie L.
ERS Group, Federal Reserve Bank of Atlanta, Georgia State
University
June 2007
Online at
https://mpra.ub.uni-muenchen.de/44801/
Job Separation Behavior of WOTC Workers:
Results from a Unique Case Study
Jill Marie Gunderson ERS Group
Julie L. Hotchkiss
Federal Reserve Bank of Atlanta and Georgia State University
February 2007
---
The views expressed in this article are those of the authors and do not necessarily reflect those of the Federal Reserve Bank of Atlanta, nor of the Federal Reserve System.
Abstract
In the 1990s, a rash of U.S. policy initiatives attempted to provide a more efficient
and effective safety net for the poor. The efforts were centered primarily around the
goals of eliminating welfare guarantees, facilitating efforts of clients to find a job, and
rewarding such efforts. The most famous of these initiatives is the Personal
Responsibility and Work Opportunity Reconciliation Act of 1996 (PRWORA); U.S.
Public Law 104-193), which replaces the Aid to Families with Dependent Children
(AFDC) program with the Temporary Assistance for Needy Families (TANF) program.
New rules under the TANF program impose strict time limits on benefits and require
recipients to work as a condition of benefit receipt. The problems with and success of
this reform have been widely investigated in the literature (for a good synthesis, see
Blank 2002).
In addition to the punishment-oriented approach of PRWORA, there were several
reward-based initiatives. The latter initiatives provide incentives for desirable behavior.
Incentives are targeted either to the individual, or to the employer, such as the Earned
Income Tax Credit (EITC), which was expanded considerably in 1994, or to the
employer, such as in the Work Opportunity Tax Credit (WOTC) and the
Welfare-to-Work Tax Credit (WtWTC), enacted in 1996, but allowed to lapse as of December 31,
2005.1 Another type of initiative focuses on human capital development through training
programs. An example of this type of policy initiative is the Job Training Partnership Act
(JTPA;U.S. Public Law 97-300 [1982]), which began in 1983 and was superseded by the
1 See Hotz and Scholz (2001) for a history of and detailed description of the EITC, and
Workforce Investment Act of 1998 (WIA; U.S. Public Law 105-220).
This article investigates the behavior of workers whose employment enables their
employers to receive incentives through the WOTC. It joins a large literature in
considering how subsidies to employers affect the behavior of employers and workers.
The article makes a unique contribution by comparing the behavior of workers qualifying
for the program under consideration with the behavior of similarly skilled, nonqualifying,
workers in the same employment environment. If there is no comparable control group
against which WOTC worker behavior can be evaluated, outcomes associated with
WOTC workers may, in fact, be more appropriately attributed to their characteristics than
to the effects of the subsidized status. This article works to distinguish which outcomes, if
any, are truly associated with receiving the credit.
The WOTC program was authorized by the Small Business Job Protection Act of
1996, (U.S. Public Law 104-188). When in operation, it provided a tax credit to
employers for hiring workers from eight possible target groups, described later in the
article (see U.S. Department of Labor 2006).2 WOTC followed on the heels of the
Targeted Jobs Tax Credit (TJTC), which expired in 1994. In 1979, the TJTC replaced the
New Jobs Tax Credit (NJTC), which had been in existence since 1977. The earliest
research on the employment outcomes of wage subsidy programs typically finds that
subsidies have positive effects, and those efforts persist across subsidy amounts (see, e.g.,
Perloff and Wachter 1979; Bishop 1981).3 However, other works indicate that subsidies
have a "stigmatizing" effect (Burtless 1985, 113), identifying individuals as problem
2 The specific target groups and program details can be found online at “Work
Opportunity Tax Credit, “http://www.doleta.gov/business/Incentives/opptax/ (accessed 11 August 2006.)
3 Also see Katz (1998) for a thorough summary of research up to that date and some
workers if they belong to a group that qualifies for the subsidy. Employers appear to
assume that the subsidy received from hiring these workers does not outweigh the
expected increases in such costs as absenteeism, and low productivity (see, e.g., Burtless
1985; Hollenbeck and Willke 1991).
Research finds that the effects of the WOTC and WtWTC programs are mostly
consistent with those documented under earlier programs. Specifically, Sarah Hamersma
(2003, 2005) finds moderately positive employment outcomes among subsidized
workers, but also finds that the total effect is quite limited, and asserts that this is
primarily due to the low participation rate of eligible workers. In addition, studies by
Hamersma (2005), and Hamersma and Carolyn Heinrich (2005), document only
short-term wage advantages among WOTC and WtWTC workers. Although the WOTC and
WtWTC programs were allowed to lapse as of December 2005, ongoing analysis of the
effects of these programs is useful in understanding the benefits on an approach toward
helping groups of workers who struggle in securing and maintaining employment.
This article sets out to investigate the validity of the potential employer perception
that WOTC and WtWTC workers are less than other employees. In particular, it is
concerned with whether workers who qualify for the WOTC subsidy (hereafter described
as WOTC workers) demonstrate significantly different job separation patterns than
workers who are hired by the same employer but do not qualify for the WOTC subsidy
(hereafter described as non-WOTC workers). The lack of information about the
applicant hiring pool means that all results reported here work with a sample consisting
of WOTC workers who actually have jobs. This should understate any differences
identified between non-WOTC workers and the random WOTC qualifying worker. In
new employees and thus are likely to be higher quality (more stable and reliable)
employees than the typical WOTC worker drawn at random. Further, the current study
examines only one employer, albeit a large one.
If one reason why wage subsidy programs have only minimal documented effects
on employment is that employers' avoid the programs or stigmatize participants due to
stereotypes concerning fears of unreliable workers, outcomes should improve if
employers are presented with evidence that the stereotypes are unfounded.
Current knowledge of unreliability (that is, of job separation behavior) among
WOTC workers is limited to analyses based on studies about the job separation behavior
of former welfare recipients. There indeed is some overlap between workers qualifying
for WOTC and workers identified as former welfare recipients, and this overlap persists,
across years. Thirty to 60 percent of workers qualifying for WOTC do so (see the
breakdown below). The studies of welfare recipients are thus somewhat relevant.
Research typically finds high turnover and poor job performance among a significant
fraction of former welfare recipients (see, e.g. Holzer, Stoll, and Wissaker 2004, Johnson
and Corcoran 2003; Berg, Olson, and Conrad 1992). Such findings may partially explain
firms' potential reluctance to hire anyone whose involvement in (or qualifications for) a
wage subsidy program might identify them as unreliable. The question that remains,
however, is whether the turnover and job performance behavior of WOTC workers
actually differs from that of similar non-WOTC workers. If similar behavior is
identified, then employers' fears of hiring WOTC-qualifying workers (or, at least, those
WOTC workers deemed worthy of employment) are unfounded. One implication would
be that efforts to improve turnover and performance among all low-skilled workers may
strategy of avoiding workers from programs like WOTC.
Unique Data
The data used in this study are from the personnel records of a large, unionized
firm in the transportation industry. That firm has numerous domestic and international
locations. Since the wage subsidy program being analyzed applies only to wages paid in
(?) the United States, the study sample includes only domestic workers. There is great
variation in the types of jobs offered by this firm. The current study focuses on part-time
package handlers (i.e., handlers of deliveries and shipments). This is the job held by
most of the firm’s WOTC workers. Part-time package handlers typically work for 4 to 5
hours a day, 5 days a week. By focusing on one job type, this study ensures that working
conditions are homogeneous for all members of the sample. This homogeneity in job
type is important because the study lacks information on sample members’ previous work
experience.4 Analyses presume that individuals qualifying for this entry-level job have
homogeneous (very limited) work experience, across WOTC status. The job in question
often involves heavy lifting, repetitive tasks (?), and working in extreme temperatures.
Because this job requires a relatively low level of skill, it is the sort of position that a
welfare recipient would be able to obtain, if that recipient can meet the physical
requirements, which presumably do rule out some individuals (Wolman 1996; Zill et al.
1991). As will be discussed below, the pay and benefits available to these workers likely
exceed those enjoyed by other workers transitioning from welfare to work.
The data set was constructed by querying the firm’s personnel records for all
part-time package handlers hired from January 1, 1998 to December 31, 1999. The records for
4 The results in this article have nothing to say about the quality of a worker’s job
these employees were then matched with other personnel tables to obtain data on
demographic (e.g., level of education and age), and job-related characteristics (e.g., shift
worked). To be classified by the firm as a WOTC worker, the individual must meet the
criteria for one of eight targeted groups (percent of all U.S. WOTC-qualifying workers
between 1997 and 2005 are in parentheses): 5
(1) member of a family receiving AFDC over a specific time period (42 percent), (2) veteran and member of a family receiving food stamps (2 percent),
(3) 18-24 year old member of a family receiving food stamps (28 percent), (4) high-risk youth (9 percent),
(5) high-risk summer youth (1 percent),
(6) ex-felon and economically disadvantaged (6 percent),
(7) recipient of vocational rehabilitation assistance (5 percent), or (8) Supplelmental Security Income SSI recipient (6 percent).
There is no way to tell whether a non-WOTC worker falls into one of these
targeted groups; regardless of the individual’s qualifications, the firm did not identify that
person as a WOTC worker. If the non-WOTC worker sample is contaminated with
individuals who were WOTC eligible but not identified as such, it is likely that the large
numbers of workers who truly do not qualify as WOTC workers would dilute any related
estimation bias.6 In addition, because this firm had an active welfare-to-work hiring
program, it is possible that there is little relevance in the usual concerns about the effect
of employment subsidy programs on employer behavior (e.g., see Tannenwald 1982).
Further, in order to not confound potential WOTC effects with state-specific effects,
5 Statistical breakdown of qualifying WOTC workers was obtained from the Office of
Performance Results, U.S. Department of Labor Employment and Training Administration (202-693-2786).
6 We have a very limited ability to compare firm-identified WOTC status with recent
analyses eliminate observations from states that have fewer than 20 WOTC workers.7
Summary Statistics
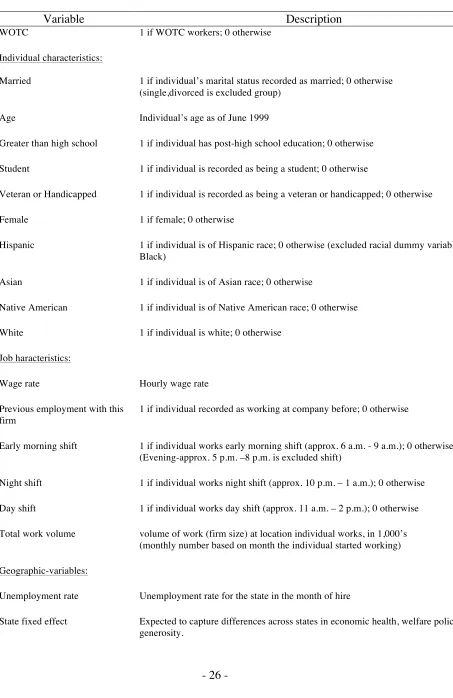
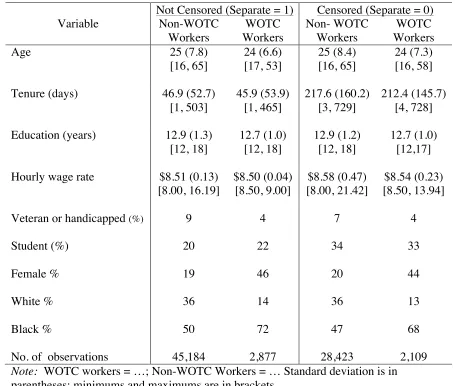
Table 1 describes the variables. Table 2 provides sample means (of selected
variables) by type of hire and censoring status. The second table suggests that the
percentage separating in the examined period is 4 percentage points higher for
non-WOTC workers than for non-WOTC workers (61 percent vs. 58 percent). A form of the
dependent variable in the duration model, tenure, indicates that the overall average tenure
is longer for WOTC workers (116 days) than it is for non-WOTC workers (113 days).
Sixty-six percent of WOTC workers and 68 percent of non-WOTC workers have tenure
below the mean tenure reported for their WOTC status category.)
The average age of the WOTC workers (24), is 1 year younger than the average
age of the non-WOTC workers. The average education level is similar for the two
groups; the groups differ by less than 1 year. The average hourly wage rate is almost
identical for the two groups. This is to be expected because this firm’s part-time package
handlers belong to a union and because both groups have similar tenure. The percentage
of female employees is higher among WOTC workers (46 percent) than among
non-WOTC workers (19 percent). The percentage of black employees is also higher. These
differences raise the possibility that the behavior of the WOTC and non-WOTC samples
will not be comparable because of unobserved differences related to race and gender.
The reliability of the comparison group was tested by reestimating the models on
subsamples of females only and blacks only. The results are unchanged.
[Tables 1 and 2 here]
7 Twenty-three states remain represented in the data; these are AR, CA, CO, FL, GA, IL,
In the WOTC worker sample, 42 percent of the observations are censored (i.e.,
they did not separate prior to December 31, 1999); 39 percent of the non-WOTC
observations are censored. Those workers whose observations are not censored have
relatively the same tenure: 47 days for non-WOTC workers and 46 days for WOTC
workers. For censored observations, non-WOTC workers have a slightly longer tenure
(218 days) than their WOTC counterparts (212 days). The other variables remain
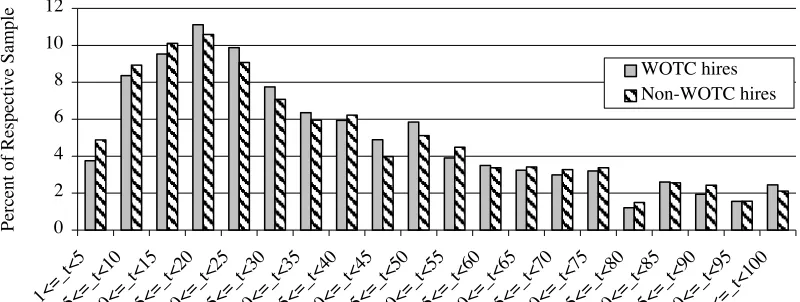
relatively stable across censoring status within a given WOTC status category. Figure 1
provides an initial glimpse into possible differences in time-to-separation between
WOTC and non-WOTC workers. The figure illustrates that the bulk of all separations
occur early, that non-WOTC workers appear to be more highly concentrated among the
earliest (1 to 15 days) and latest (50 to 90 days) separations, and that WOTC workers are
most concentrated among separations between 15 and 50 days.
[Figure 1 here]
Representative Low-Skill Employment
Existing data from other studies help to further elucidate the nature of the sample.
The position in question involves repetitive and physically demanding working
conditions and hours of work. Studies suggest that the job held by workers in this
analysis appears to be comparable to those held by other subsidy-qualifying workers
(Wolman 1996; Zill et al. 1991). However, the wages and benefits, of this study’s
workers are high, compared to those of workers in other studies. Welfare recipients who
transition into the workforce are likely to find jobs that typically pay between 7 and 8
dollars an hour (1999 dollars; Loprest 2001, Parrott 1998; Grogger 2005; Hamersma and
Heinrich 2005; and Johnson and Corcoran 2003) compared to ___ dollars here. All
access to a 401(k) plan. Sharon Parrott (1998) and Rucker Johnson and Mary Corcoran
(2003) find that between 37 and 61 percent of welfare-to-work employees are in jobs that
offer health benefits.
The implication of these differences is that the behavior observed among WOTC-
qualifying workers in the current sample may differ from WOTC-qualifying workers
elsewhere. However, comparing the behavior of WOTC and non-WOTC workers in this
firm may still identify valid differences that appear in other employment environments.
Job Separation Type
When an employee voluntarily or involuntarily separates from a job at this
company, the individual’s main reason for separating was recorded.8 The firm’s process
recognizes 53 different categories for tracking causes of separation. This work distills
those into four main categories for analysis: professional reasons, personal issues, fired
for cause, and no-show (absenteeism i.e., failure to show up for work).9 Employees who
reportedly separated for professional reasons identified themselves, for example, as
quitting to accept another job or because they were dissatisfied with a particular aspect of
the job, such as pay, type of work, or hours. Employees who reportedly separated for
personal issues cited reasons such as health problems, a return to school, or transportation
difficulties. Separation due to being fired for cause reflects terminations that resulted
after violation of company policies. The firm’s records indicate that excessive
absenteeism was the main reason employees were fired for cause (68 percent of all such
terminations were attributed to excessive absenteeism). A termination resulting from
8 If the individual gave advance notice of the separation, the firm conducted an exit
interview, recording the reason for leaving. If the person merely stopped showing up for work, the firm listed "failed to report to work," as the reason for separation.
failure to show up for work (no-show) could arguably be categorized as a separation due
to personal issues or as fired for cause. Because a sizable proportion of the firm’s
separations is due to an employee’s failure to show up for work, analyses classify
no-show terminations as a separate category.
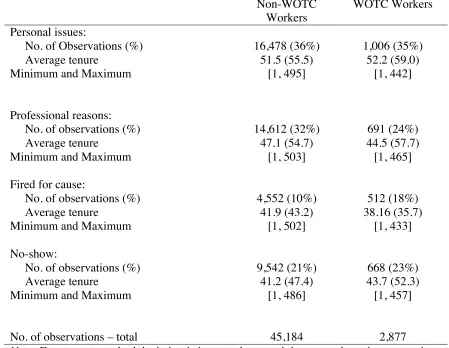
Table 3 reports reasons for job separation by WOTC status. Among both groups,
personal issues are reported as the primary reasons for job separation. The percentage of
separations due to personal issues is relatively the same for both groups: 35-36 percent.
Professional issues are cited as the next most common cause of job separation.
Thirty-two percent of separated non-WOTC workers attributed their separation to professional
reasons. The percentage was smaller among separated WOTC workers, who cited
professional reasons as the impetus for 24 percent of separations. Among WOTC
workers, no-show, at 23 percent, was also a frequently reported reason of separation.
Among non-WOTC workers, no-show accounts for 21 percent of separations. The
percentage of separated WOTC workers who are fired for cause (18 percent) is larger
than that of separated non-WOTC workers (10 percent).
[Table 3 here]
Table 3 also lists the groups average tenure for each of the four reasons for
separation. Workers who reportedly separate for personal reasons stay on the job longer
than those who separate for the other three reported reasons. Fired for cause and no-show
occur after the shortest tenure. It is also noteworthy that the smallest percentage of
separations (for both WOTC and non-WOTC workers) stems from reported employer
action (fired for cause). This suggests that the results below will not be tainted by the
effects of incentives that WOTC provides to employers for retaining WOTC workers (see
make that duration a condition of the employment subsidy. In addition, the distribution
of workers across length of tenure does not show any unusual clumping of separations
around key thresholds (e.g., 90 days); see figure 1).
Determinants of Quit Behavior
A simple job search model of voluntary separation behavior (hereafter described
as quit behavior) shows that a person's current wage and a person's alternative income
(e.g., as might be determined by a state's welfare policies) are important determinants of
the decision to quit one's current job.10 Human capital theory suggests that job tenure is
also important in determining job separations (see Becker 1975; Hotchkiss 2002). An
employee’s specific human capital is likely to increase with the length of the individuals
tenure. This increase in capital also raises the employee’s productivity. Since the
employer in this study includes the value of specific human capital in compensation, and
other potential employers may not, it is in the worker's interest to not quit the current job.
The theory of job-matching also predicts that tenure on the job is related to
separation behavior, but for different reasons than those covered above (Jovanovic 1979a,
1979b). According to job-matching theory, when the worker begins the job, neither the
firm nor the worker knows the quality of the job match. Hence, the probability is low
that the worker will quit in the initial stages of employment. As tenure in the job
increases, the worker collects information about the job match, (e.g., on working
10 The formal model is available upon request. The predictions of the theoretical model
conditions).11 Poor matches often prompt the worker to quit; good matches likely induce
the worker to remain in the position. Thus, this theory predicts that the hazard of job
separation is initially quite low, but that it increases as bad matches result in separation.
As the length of tenure increases, the hazard decreases because the matches that continue
are primarily good ones (Chapman and Southwick 1991; Lane and Parkin 1998).
Although the amount of specific human capital among WOTC workers is not
likely to differ dramatically from that among non-WOTC workers (because jobs held by
both groups are entry-level positions), job separation behavior may differ due to
differential job-matching. Workers in the WOTC group may have limited past
employment experiences, which may also create pressure to accept jobs quickly. These
factors may result in job matches that are inferior to those of non-WOTC workers.
However, WOTC workers may have better job matches than those of non-WOTC hires,
as availability of alternatives (Jovanovic 1979a). Those limitations may also prompt
WOTC workers to persist in bad matches.
Empirical Analysis
Time to Job Separation: A Survival Analysis
To explicitly address the issue of job duration or tenure, an accelerated
failure-time (AFT) model is estimated using the entire sample. Separate models also are
estimated by WOTC status. The AFT model expresses the natural logarithm of the
survival time (job tenure in days, in this case) as a linear model of covariates (see Kiefer
1988):
' ' '
0 1 2 3 4 1
ln(tenurei)=α +Xiα +Yiα +Ziα +α WOTCi+ui,, (1)
11 Job-match theory predicts that good matches will receive higher wages and poor
where α is the vector of coefficients to be estimated and u
1i is the error term. The
variables included in the model are based on data availability and the theoretical
considerations discussed earlier. The vector Xi consists of a set of personal
characteristics; the vector Yi consists of a set of job-related characteristics; the vector Zi
contains geographic variables, including state-specific fixed effects; the dummy variable
indicating WOTC status is represented by the variable WOTCi. The variable WOTCi
equals 1 if the individual is identified as qualifying the firm for a WOTC subsidy. All
variables contained in X, Y, and Z are described in table 1.
Equation (1) can be estimated via maximum likelihood estimation (MLE) by
assuming a distribution foru
1i. The preferred AFT model, estimated here, assumes that
u
1i follows the generalized gamma distribution. That is, the model was estimated
assuming log-normal, log-logistic, Weibull, and exponential distributions. The
generalized gamma was selected as the preferred model based on the Akaike Information
Criterion (AIC). The conclusions do not change when different distributional
assumptions are made. The hazard function for the generalized gamma distribution is
very flexible; nested within it are the log-normal, Weibull, and exponential models,
depending on the value of parameters of the generalized gamma survival function.12
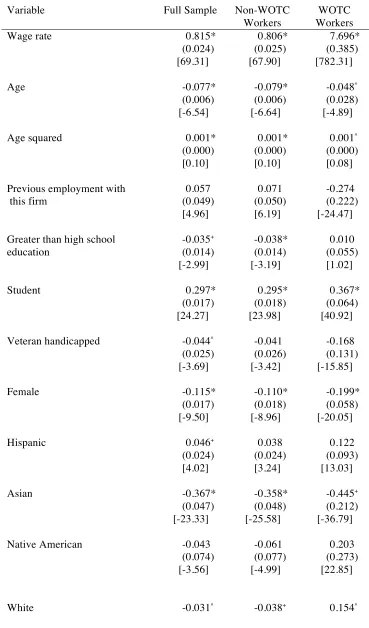
Table 4 presents three sets of estimated coefficients: the first set includes estimates for
the full sample, the second includes those for non-WOTC workers; and the third includes
those for WOTC workers. In the AFT specification, time is scaled by a factor
)
exp(−Ωiβ , where Ωi is the vector of covariates and β are coefficients. Thus, a
positive coefficient implies that predicted tenure is extended.
12 All estimations in this article are obtained using version 8.0 of the statistical software
[Table 4 here]
The first point of interest in the results is that predicted median tenure of WOTC
workers is higher by about 6 days than that of the full sample (see column 1). A one
dollar increase in the wage and being a student also are estimated to increase median
tenure by 69 days and 24 days, respectively.13 All racial and ethnic groups except Native
Americans have tenures that are statistically significantly different than the reference ?
excluded group (blacks). The statistically significantly longer tenure among Hispanics (4
days) shows up only in the results for the full sample. Compared to tenures of the
reference group, those among Asians are shorter (from 26 to 36 fewer days, depending on
the subsample); tenure is also shorter among white non-WOTC workers (3 fewer days)
than it is among ___. White WOTC hires exhibit about 17 days longer tenure. Being
female, older and better-educated have the estimated effect of reducing tenure, as does
working the night shift.
Based on the estimated coefficients, and using the median individual
characteristics of WOTC and non-WOTC employees, the predicted median tenure is 102
days for WOTC workers and 84 days for non-WOTC workers. Thus, the median tenure
for a WOTC worker is 18 days longer than that for a non-WOTC worker.
A number of results stand out among the estimated marginal effects for WOTC
and non-WOTC workers. Workers in the WOTC group appear to be more sensitive than
13 The model was reestimated without the wage regressor to get a sense of the model's
stability. The coefficients on the remaining regressors are essentially unchanged, except that not controlling for the wage, previous experience lengthens the tenure of a WOTC worker and tenure is shorter among white WOTC workers. In addition, the positive influence of previous experience on tenure among non-WOTC hires becomes
their non-WOTC counterparts to changes in the wage rate.14 This result suggests that the
ability to raise wages provides firms with a powerful tool to lower quits among WOTC
workers. If the wage is too low, WOTC workers may see welfare or disability (SSI)
income as viable alternatives. By contrast, non-WOTC workers may not consider such
options. This observation is consistent with the results of Johnson and Corcoran (2003),
who find lower turnover among welfare recipients receiving higher wages and among
those employed in higher-skilled jobs.
In addition, among WOTC workers, there is no statistically significant relation
between having post-high school education and the predicted time to separation. Among
non-WOTC workers, having post-high school education speeds up the time to separation.
Further, the usual negative relationship between firm size (proxied here by total work
volume of the workers’ establishment) and turnover (see Even and Macpherson 1996)
shows up to a statistically significant degree, among non-WOTC workers, but the relation
is not statistically significant among WOTC workers.
The magnitude of several of the marginal effects is larger for WOTC hires; in
terms of the student variable, the difference possibly indicates that WOTC workers place
more value than their non-WOTC counterparts on the ability to combine school and
work; workers in the WOTC group may hope that such an ability will provide them with
a better (economic) future. Among WOTC workers, the statistically, significantly,
female may suggest that female WOTC workers have greater difficulty in resolving
personal issues (e.g., child care) than male WOTC workers do. This supposition is
explored in the next section.
14 The magnitude of the coefficient and marginal effect, however, should make one wary
Separation Types and Job Assistance Programs: A Competing Risks Analysis
An individual may separate from his or her employer for a variety of reasons, and
no-show separations are most likely very different from separations in which the worker
moves to a different job. Indeed, Anne Beeson Royalty (1998) finds that not all types of
turnover are created equal. Important differences in behavior across demographic groups
obscure important separation patterns when the separation types are aggregated. For this
reason, a competing risks model is estimated to determine whether WOTC workers
separate from their jobs for reasons that are systematically different from those that
prompt separation among non-WOTC workers. Identifying systematic differences across
types of separation will help guide policy makers in targeting those differences.
If one takes covariates into account and follows Cox and Oakes (1984), the log
likelihood function for the independent competing risks model is:15
ln log r( ; )i i ri*log r( ; )i i
r i r i
L=
∑∑
S t γ +∑∑
d h t γ (2)where r is the reason for separation; Sr is the survivor function for the rth separation
reason estimated in AFT metric; hr is the hazard function for the rth separation reason
estimated in AFT metric; ti represents observed tenure for the ith employee; dri is an
indicator variable equal to 1 if individual i separates for reason r (0 otherwise); and γi
represents all of the explanatory variables included in equation (1). The equation also
includes four indicators of whether specific job assistance programs were available at the
worker's establishment. Assuming independence amounts to assuming a lack of
15 Where an individual is labeled as failing if rr
i ; otherwise, the individual is censored.
correlation among unobservables that contribute to each type of separation.16 The results
of the competing risks model are presented separately.
The firm in this study operates over 30 job assistance programs throughout the
United States. Most of the firm’s sites are located in major cities.17 Participation in these
programs is not restricted to WOTC workers, nor are the programs offered in all locations
that hire WOTC-qualifying workers. The main program category types include:
mentoring programs, in which a more senior employee serves as a guide for the new hire;
school programs, in which high school or college classes are offered on-site, or at a
reduced cost; work training programs, in which basic job skill classes are available from
local agencies; and transportation programs, which provide employees with subsidized or
free transportation to work. 18
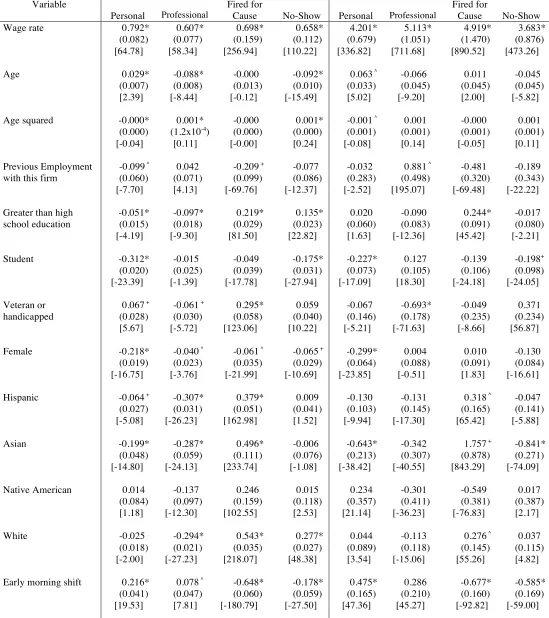
[Table 5 here]
As suggested by the predicted median tenure row in table 5, WOTC and
non-WOTC workers are most similar in their time until separations that occur for personal
reasons. Although personal issues lead to the fastest separations (i.e., shortest tenure),
there is no evidence that personal issues (child care) interfere more with the performance
16 Söderberg and Lyhagen (1999) propose an information matrix test for dependence
between risks. However, since only tenurei min(tenureri) and di are observed, one cannot
test the assumption of independence between the tenure outcomes (see Lawless 1982, 483). The assumption of independence is commonly used in research; see Blank (1989), Blank and Ruggles (1994); Addison and Portugal (2004).
17 About 28 percent of the workers in this study have a work program available to them.
18 A natural question arises as to whether an establishment is more likely to offer job
assistance programs if it is experiencing a problem with employee turnover. If this is the case, there would be unobserved correlation between the propensity of an establishment to offer a program and worker tenure. Analyses suggest that there is very weak
of WOTC workers that with that of non-WOTC workers; WOTC workers separate for
personal reasons only 2 days earlier than non-WOTC workers do.19
The table shows that WOTC workers are estimated to separate less quickly for
professional reasons than non-WOTC workers do (by 46 days). This suggests that it may
take a WOTC worker longer to find alternative job prospects.20 However, among
workers who were fired for cause, separations are estimated to occur more quickly for
WOTC workers than for non-WOTC workers (by 187 days). It is important to note that
this is a relatively rare reason for separation among both WOTC and non-WOTC
workers. No-show separations also are estimated to occur more quickly among WOTC
workers than among their WOTC counterparts. Results also suggest that among WOTC
workers, no-show separations occur more quickly than separations for professional
reasons. By contrast, non-WOTC workers separate more quickly for professional reasons
than they do for failure to show up for work. These results are generally consistent
findings in studies of job separation among welfare hires (Berg et al. 1992; Holzer et al.
2004).
The results again suggest that WOTC workers are more sensitive to changes in
the wage rate than are non-WOTC workers. The wage also seems to have its strongest
effect on the time to separation for being fired for cause; for an employee, the cost of
shirking theoretically rises with increases in wages. Having post-high school education
shortens the time until separation for professional reasons. It lengthens the time until
19 These findings are consistent with those of Wagner and Herr (2003, 7) who report that
"work identity" is more important than actual barriers (e.g., child care transportation) in determining the length of a (?) work experience.
20 The quality of postseparation outcomes is beyond the scope of this article, but some
separation due to terminations for cause (for all workers) and to no-show separations
(among non-WOTC workers).
Among both WOTC and non-WOTC workers, being a student shortens the
predicted time until separations due to personal issues and no-show, may interfere with
the student’s ability to work. Compared to make workers in the non-WOTC group, their
female counterparts are estimated to have shorter times to separation for all four reasons.
Among WOTC workers, women are estimated to separate most quickly for personal
reasons. This result helps to pinpoint the source of the shorter, overall, tenure among
female WOTC workers.
Across WOTC status, Hispanic, Asian, and white workers are estimated to
separate less quickly than black workers for being fired for cause and less quickly for
failure to show up for work. Asian workers are estimated to separate more quickly for
personal issues than black workers do. In addition, relative to the evening shift (5-8
p.m.), workers on all other shifts appear to separate more quickly due to being fired for
cause and not showing up (although the difference is sometimes not statistically
significant). This may suggest that the evening shift is the most desirable. Among
workers fired for cause, those who worked on the early morning shift are estimated to
separate. This suggests that sleep issues may make errors common on the early shift.
Previous employment experience with the firm is estimated to have a mostly
negative effect on tenure (especially for being fired) suggests that workers with previous
experience may take the job for granted and be more likely to shirk responsibilities. It
may also indicate that more is expected of re-hires than of new employees; such
expectations may increase separations for cause among re-hires. Results suggest that
for being fired for cause. Weak labor markets may discourage shirking behavior that
could force an employee to look for another job. Weak labor markets may also make it
more difficult to find better, alternative employment, lengthening the time to separation
for professional reasons. Since these unemployment rates correspond to the date of hire,
the longer time to being fired, or no-show, may mean that the weaker labor market
allowed the firm to hire reliable workers at the time.
Although there are varying degrees of statistical significance and direction of
effect, the results pertaining to the effect of job assistance program availability may offer
specific policy suggestions for reducing specific types of separation. Among non-WOTC
workers, availability of a mentoring program is estimated to increase tenure among
workers who are fired for cause and who separate for personal issues. To the extent that a
mentoring program can improve a worker's "employment identity," these results are
consistent with those of Suzanne Wagner and Toby Herr (2003 -7), but they suggest that
identity apparently only influences behavior (significantly) among non-WOTC workers.
Transportation programs are estimated to increase the time to separation among all
workers fired for cause, but to reduce time to separation for professional reasons among
non-WOTC hires. Among non-WOTC workers, school program availability seems to
lengthen time to separation, regardless of the reason for separation. School programs
seem to lengthen the tenures of WOTC workers who separate for professional reasons.
Availability of a work training program is estimated to reduce time to separation for all
reasons, although the reductions are not always statistically significant among WOTC
hires. Perhaps workers complete training programs and take the new skills on to different
jobs (i.e., separating for professional reasons). It may also be that the firm expects
expectations are higher for some programs; the training may thus make employees more
susceptible to being fired for cause.
Summary and Conclusions
This article focuses on the post hiring behavior of the WOTC worker and how it
compares to the behavior of the non-WOTC worker. The results confirm some previous
findings and provide new insight into the stability of difficult-to-employ workers. In
particular, the results of a survival analysis indicate that WOTC workers stay on the job
longer than non-WOTC workers. The average difference between the groups may seem
relatively small (18 days), but it nevertheless dispels the idea that WOTC workers are
uniquely unstable employees.
Additionally, the tenures of WOTC workers are found to be more sensitive to the
wage rate than those of non-WOTC workers. This suggests that high wages may be an
effective tool for increasing the tenures of WOTC workers; states may wish to consider
supplementing the wages of WOTC workers directly, instead of providing tax credits to
the firms that hire them. It also appears that the separation behavior of WOTC workers is
sensitive to the shift worked. In both groups (WOTC and non-WOTC workers) those
fired for cause and those fired for failure to show up have shorter tenures if they work
any but the evening shift. This finding suggests that firms may wish to consider shift
assignments in developing strategies to retain workers who are particularly vulnerable to
for-cause and no-show separations.
The availability of a mentoring program seems to be of particularly importance
for lengthening the tenures of non-WOTC workers, But the association only rises to
statistical significance when predicting the tenures of those who are fired for cause or
separation and tenures among all workers, although the result is most statistically
significant among non-WOTC hires; however, the availability of training programs
reduces the tenures of WOTC (no-show workers to a statistically, significant degree. The
results suggest that, if the only goal is to reduce turnover, these types of programs are not
a good idea.
Alternatively, the availability of a transportation assistance program lengthens the
estimated tenures of WOTC and non-WOTC workers fired for cause. Because
absenteeism is reported to be the most common reason for separation, the availability of
transportation assistance may be effective in reducing the frequency of this outcome.
Among non-WOTC workers, the availability of school programs appears to
positively affect tenure across all reasons of separation; access to these programs is also
estimated to extend the tenures of WOTC workers who separate for professional reasons.
School programs may not pay short- and long-term dividends. In the short term, such
programs may reduce turnover. In the long term, school programs may improve the job
outcomes of low-skill workers by helping these workers to build general human capital.
The results of the competing risks analysis also indicate that those WOTC
workers who separate for personal reasons do not have shorter tenures than their
non-WOTC counterparts. However, tenures are shorter among non-WOTC workers who are fired
for cause, who fail to show up for work, and who leave for professional reasons.
Although it may be important to provide for the child care and other personal concerns of
WOTC–qualifying individuals in order to get them into a job, once these issues have
been addressed (and the individual is employed), personal matters do not seem to affect a
WOTC worker’s separation decision any more than they affect those of their non-WOTC
fail to show for work have shorter tenures than their non-WOTC counterparts. As a
consequence, efforts to reduce turnover among the hard-to-employ may find the greatest
marginal return in focusing on job performance and work-readiness skills.
Although the separation behavior of WOTC workers at one firm may or may not
be applicable to those of the population as a whole, this comparison of two very similar
workers in a common work environment provides insight on a number of questions. It
suggests that (1) WOTC workers are not any less stable (and in fact stay slightly longer
on the job) than other low-skill, non-WOTC workers; (2) the wage level is the most
important factor in determining the time to separation, and is an even stronger
determinant for WOTC workers than for non-WOTC workers; (3) mentoring, schooling,
and transportation assistance programs may be the most effective ways to extend tenures;
and (4) the tenures of WOTC workers who leave for personal issues are not shorter than
those of their non-WOTC counterparts, but tenures are shorter among WOTC workers
fired for cause or for not showing up to work. Tenures among WOTC workers who
separate for professional reasons are shorter than those among non-WOTC workers who
leave for the same reason.
Given the fixed costs of hiring workers, it is understandable why employers
would want to avoid hiring workers from a group that is likely to stop showing up for
work sooner than those in another group. It also may be the case that the subsidy offered
to employ these hard-to-employ workers is not enough to offset that risk. This may be
why the WOTC subsidy (and others before it) have such a small take-up rate (Hamersma
2003, 2005). However, the analyses in this article suggest that WOTC workers are more
similar to other low-skill workers than they are different. Findings also suggest that
Figure 1. Percent Frequency Distribution of Time to Separation.
0 2 4 6 8 10 12
1<=_t<55<=_t<10 10<
=_t<15 15<
=_t<20 20<
=_t<25 25<
=_t<30 30<
=_t<35 35<
=_t<40 40<
=_t<45 45<
=_t<50 50<
=_t<55 55<
=_t<60 60<
=_t<65 65<
=_t<70 70<
=_t<75 75<
=_t<80 80<
=_t<85 85<
=_t<90 90<
=_t<95 95<
=_t<100
P
erc
ent of Respe
cti
ve
S
ampl
e
Table 1: List of Variable Descriptions
Variable Description
WOTC 1 if WOTC workers; 0 otherwise
Individual characteristics:
Married 1 if individual’s marital status recorded as married; 0 otherwise (single,divorced is excluded group)
Age Individual’s age as of June 1999
Greater than high school 1 if individual has post-high school education; 0 otherwise
Student 1 if individual is recorded as being a student; 0 otherwise
Veteran or Handicapped 1 if individual is recorded as being a veteran or handicapped; 0 otherwise
Female 1 if female; 0 otherwise
Hispanic 1 if individual is of Hispanic race; 0 otherwise (excluded racial dummy variable is Black)
Asian 1 if individual is of Asian race; 0 otherwise
Native American 1 if individual is of Native American race; 0 otherwise
White 1 if individual is white; 0 otherwise
Job haracteristics:
Wage rate Hourly wage rate
Previous employment with this firm
1 if individual recorded as working at company before; 0 otherwise
Early morning shift 1 if individual works early morning shift (approx. 6 a.m. - 9 a.m.); 0 otherwise (Evening-approx. 5 p.m. –8 p.m. is excluded shift)
Night shift 1 if individual works night shift (approx. 10 p.m. – 1 a.m.); 0 otherwise
Day shift 1 if individual works day shift (approx. 11 a.m. – 2 p.m.); 0 otherwise
Total work volume volume of work (firm size) at location individual works, in 1,000’s (monthly number based on month the individual started working)
Geographic-variables:
Unemployment rate Unemployment rate for the state in the month of hire
Job assistance programs:
Mentoring program 1 if facility provides a mentoring program; 0 otherwise
Transportation program 1 if facility provides free or reduced-cost transportation; 0 otherwise
Work training program 1 if facility provides work-related skills training; 0 otherwise
School program 1 if facility provides high school or college classes on-site or at a reduced cost; 0 otherwise
Table 2: Means of Selected Variables, by Censoring and Welfare Status
Not Censored (Separate = 1) Censored (Separate = 0)
Variable Non-WOTC
Workers
WOTC Workers
Non- WOTC Workers
WOTC
Workers
Age 25 (7.8)
[16, 65]
24 (6.6) [17, 53]
25 (8.4) [16, 65]
24 (7.3) [16, 58]
Tenure (days) 46.9 (52.7)
[1, 503]
45.9 (53.9) [1, 465]
217.6 (160.2) [3, 729]
212.4 (145.7) [4, 728]
Education (years) 12.9 (1.3)
[12, 18]
12.7 (1.0) [12, 18]
12.9 (1.2) [12, 18]
12.7 (1.0) [12,17]
Hourly wage rate $8.51 (0.13)
[8.00, 16.19]
$8.50 (0.04) [8.50, 9.00]
$8.58 (0.47) [8.00, 21.42]
$8.54 (0.23) [8.50, 13.94]
Veteran or handicapped (%) 9 4 7 4
Student (%) 20 22 34 33
Female % 19 46 20 44
White % 36 14 36 13
Black % 50 72 47 68
No. of observations 45,184 2,877 28,423 2,109
Table 3: Reasons for Separating
Non-WOTC Workers
WOTC Workers
Personal issues:
No. of Observations (%) 16,478 (36%) 1,006 (35%)
Average tenure Minimum and Maximum
51.5 (55.5) [1, 495]
52.2 (59.0) [1, 442]
Professional reasons:
No. of observations (%) 14,612 (32%) 691 (24%)
Average tenure Minimum and Maximum
47.1 (54.7) [1, 503]
44.5 (57.7) [1, 465]
Fired for cause:
No. of observations (%) 4,552 (10%) 512 (18%)
Average tenure Minimum and Maximum
41.9 (43.2) [1, 502]
38.16 (35.7) [1, 433]
No-show:
No. of observations (%) 9,542 (21%) 668 (23%)
Average tenure Minimum and Maximum
41.2 (47.4) [1, 486]
43.7 (52.3) [1, 457]
No. of observations – total 45,184 2,877
Table 4: Coefficients and Marginal Effects from Survival Model: Time to Separation
Variable Full Sample Non-WOTC
Workers
WOTC Workers
Wage rate 0.815*
(0.024) [69.31] 0.806* (0.025) [67.90] 7.696* (0.385) [782.31]
Age -0.077*
(0.006) [-6.54] -0.079* (0.006) [-6.64] -0.048^ (0.028) [-4.89]
Age squared 0.001*
(0.000) [0.10] 0.001* (0.000) [0.10] 0.001^ (0.000) [0.08]
Previous employment with this firm 0.057 (0.049) [4.96] 0.071 (0.050) [6.19] -0.274 (0.222) [-24.47]
Greater than high school education -0.035+ (0.014) [-2.99] -0.038* (0.014) [-3.19] 0.010 (0.055) [1.02]
Student 0.297*
(0.017) [24.27] 0.295* (0.018) [23.98] 0.367* (0.064) [40.92]
Veteran handicapped -0.044^
(0.025) [-3.69] -0.041 (0.026) [-3.42] -0.168 (0.131) [-15.85]
Female -0.115*
(0.017) [-9.50] -0.110* (0.018) [-8.96] -0.199* (0.058) [-20.05]
Hispanic 0.046+
(0.024) [4.02] 0.038 (0.024) [3.24] 0.122 (0.093) [13.03]
Asian -0.367*
(0.047) [-23.33] -0.358* (0.048) [-25.58] -0.445+ (0.212) [-36.79]
Native American -0.043
(0.074) [-3.56] -0.061 (0.077) [-4.99] 0.203 (0.273) [22.85]
(0.016) [-2.62] (0.016) [-3.16] (0.081) [16.63]
Early morning shift 0.025
(0.033) [2.11] 0.024 (0.035) [2.06] 0.080 (0.115) [8.44]
Night shift -0.093*
(0.016) [-7.78] -0.097* (0.016) [-8.05] -0.040 (0.066) [-4.01]
Day shift -0.021
(0.021) [-1.75] -0.030 (0.022) [-2.52] 0.094 (0.075) [9.83]
Total work volume 1.2x10-5*
(0.000) [0.001]
1.5x10-5* (0.000) [0.00]
1.0x10⁻⁶ (0.000) [0.000]
Married -0.012
(0.020) [-0.98] -0.013 (0.020) [-1.13] 0.091 (0.096) [9.65]
WOTC 0.064+
(0.028) [5.60]
-- --
Unemployment rate -0.041*
(0.010) [-3.49] -0.046* (0.010) [-3.91] 0.028 (0.042) [2.85]
Constant -2.264*
(0.227)
-2.02* (0.233)
-62.302 * (3.306)
Predicted median tenure (days): Females only
Blacks only
85 84
75 78
102
88 89
Log-likelihood -117974 -110742 -7078
No. of observations 78,593 73,607 4,986
Notes: All estimations include state fixed-effects. Standard errors are in parentheses. Marginal effects are in brackets; they are evaluated at the median tenure. Standard errors for the marginal effects are available from the authors, but indicated levels of significance match those of the
parameter coefficients. * indicates significant at the 99% level; + indicates significant at the 95%
level; ^ indicates significant at the 90% level. WOTC = __;WOTC workers = __; non-WOTC
Table 5: Coefficients and Marginal Effects from Competing Risks Model: Separation Type
Non-WOTC Workers WOTC Workers
Variable
Personal Professional
Fired for
Cause No-Show Personal Professional
Fired for
Cause No-Show Wage rate 0.792*
(0.082) [64.78] 0.607* (0.077) [58.34] 0.698* (0.159) [256.94] 0.658* (0.112) [110.22] 4.201* (0.679) [336.82] 5.113* (1.051) [711.68] 4.919* (1.470) [890.52] 3.683* (0.876) [473.26]
Age 0.029*
(0.007) [2.39] -0.088* (0.008) [-8.44] -0.000 (0.013) [-0.12] -0.092* (0.010) [-15.49]
0.063 ^
(0.033) [5.02] -0.066 (0.045) [-9.20] 0.011 (0.045) [2.00] -0.045 (0.045) [-5.82]
Age squared -0.000* (0.000) [-0.04] 0.001* (1.2x10-4 ) [0.11] -0.000 (0.000) [-0.00] 0.001* (0.000) [0.24]
-0.001 ^
(0.001) [-0.08] 0.001 (0.001) [0.14] -0.000 (0.001) [-0.05] 0.001 (0.001) [0.11] Previous Employment with this firm
-0.099 ^
(0.060) [-7.70]
0.042 (0.071) [4.13]
-0.209 +
(0.099) [-69.76] -0.077 (0.086) [-12.37] -0.032 (0.283) [-2.52]
0.881 ^
(0.498) [195.07] -0.481 (0.320) [-69.48] -0.189 (0.343) [-22.22]
Greater than high school education -0.051* (0.015) [-4.19] -0.097* (0.018) [-9.30] 0.219* (0.029) [81.50] 0.135* (0.023) [22.82] 0.020 (0.060) [1.63] -0.090 (0.083) [-12.36] 0.244* (0.091) [45.42] -0.017 (0.080) [-2.21]
Student -0.312* (0.020) [-23.39] -0.015 (0.025) [-1.39] -0.049 (0.039) [-17.78] -0.175* (0.031) [-27.94] -0.227* (0.073) [-17.09] 0.127 (0.105) [18.30] -0.139 (0.106) [-24.18] -0.198+ (0.098) [-24.05] Veteran or handicapped
0.067 +
(0.028) [5.67]
-0.061 +
(0.030) [-5.72] 0.295* (0.058) [123.06] 0.059 (0.040) [10.22] -0.067 (0.146) [-5.21] -0.693* (0.178) [-71.63] -0.049 (0.235) [-8.66] 0.371 (0.234) [56.87]
Female -0.218* (0.019) [-16.75]
-0.040 ^
(0.023) [-3.76]
-0.061 ^
(0.035) [-21.99]
-0.065 +
(0.029) [-10.69] -0.299* (0.064) [-23.85] 0.004 (0.088) [-0.51] 0.010 (0.091) [1.83] -0.130 (0.084) [-16.61]
Hispanic -0.064 +
(0.027) [-5.08] -0.307* (0.031) [-26.23] 0.379* (0.051) [162.98] 0.009 (0.041) [1.52] -0.130 (0.103) [-9.94] -0.131 (0.145) [-17.30]
0.318 ^
(0.165) [65.42]
-0.047 (0.141) [-5.88]
Asian -0.199*
(0.048) [-14.80] -0.287* (0.059) [-24.13] 0.496* (0.111) [233.74] -0.006 (0.076) [-1.08] -0.643* (0.213) [-38.42] -0.342 (0.307) [-40.55]
1.757 +
(0.878) [843.29]
-0.841* (0.271) [-74.09]
Native American 0.014 (0.084) [1.18] -0.137 (0.097) [-12.30] 0.246 (0.159) [102.55] 0.015 (0.118) [2.53] 0.234 (0.357) [21.14] -0.301 (0.411) [-36.23] -0.549 (0.381) [-76.83] 0.017 (0.387) [2.17]
White -0.025
(0.018) [-2.00] -0.294* (0.021) [-27.23] 0.543* (0.035) [218.07] 0.277* (0.027) [48.38] 0.044 (0.089) [3.54] -0.113 (0.118) [-15.06]
0.276 ^
(0.145) [55.26] 0.037 (0.115) [4.82]
Early morning shift 0.216* (0.041) [19.53]
0.078 ^
Night shift 0.038 + (0.017) [3.13] -0.065* (0.020) [-6.20] -0.055 (0.034) [-20.17] -0.328* (0.026) [-53.28] -0.018 (0.072) [-1.46] 0.049 (0.101) [6.93] -0.132 (0.115) [-23.38] -0.255* (0.097) [-31.62]
Day shift 0.041 ^
(0.024) [3.38] -0.213* (0.027) [-19.00] -0.309* (0.042) [-102.16] -0.022 (0.038) [-3.58] 0.050 (0.083) [4.04] -0.121 (0.113) [-16.25] -0.326* (0.115) [-54.28] 0.038 (0.115) [4.96]
Total work volume -2.1x10-5
* (2.8x10-6 ) [-0.00] 6.2x10⁻⁸ (3.2x10⁻⁶ ) [0.00] -2.4x10-5 * (5.3x10-6 ) [-0.01] 5.8x10⁻⁶ (4.1x10⁻⁶ ) [0.00]
2.5x10⁻⁵ +
(1.2x10⁻⁵ ) [0.00] -2.7x10⁻⁵ (1.7x10⁻⁵ ) [-0.00] -9.0x10⁻⁶ (1.8x10⁻⁵ ) [-0.00] 9.5x10⁻⁶ (1.6x10⁻⁵ ) [0.00]
Married -0.069* (0.022) [-5.55] -0.097* (0.024) [-9.01] 0.209* (0.044) [82.19] 0.041 (0.032) [7.04] -0.097 (0.106) [-7.50] 0.016 (0.142) [2.29] 0.181 (0.166) [35.34] 0.030 (0.141) [3.87]
Unemployment rate 0.091* (0.011) [7.45] 0.123* (0.014) [11.78] 0.194* (0.023) [71.29] 0.262* (0.018) [43.89]
0.081 ^
(0.046) [6.52] 0.178* (0.065) [24.83] 0.228* (0.079) [41.29] 0.194* (0.066) [24.90]
Mentoring program 0.302*
(0.088) [28.75] 0.080 (0.107) [7.94] 1.484* (0.209) [1227.96] 0.135 (0.114) [24.13]
-1.654 +
(0.826) [-65.40] -0.246 (1.018) [-30.37] 0.071 (1.101) [13.28] 0.564 (0.713) [97.15] Transportation program 0.021 (0.070) [1.72]
-0.221 +
(0.090) [-19.43] 0.514* (0.143) [235.77] 0.152 (0.106) [27.19] 0.417 (0.278) [40.28] -0.435 (0.414) [-50.70]
1.277 +
(0.540) [426.97] 0.140 (0.341) [19.13] Work training program -0.247* (0.050) [-18.02] -0.236* (0.061) [-20.33] -0.508* (0.098) [-148.68] -0.436* (0.078) [-59.90] -0.010 (0.187) [-0.83] -0.298 (0.243) [-36.23] -0.264 (0.320) [-42.49] -0.818* (0.239) [-73.98]
School program 0.549*
(0.064) [55.61] 0.387* (0.075) [43.05] 0.107 (0.124) [40.99] 0.489* (0.092) [99.05]
-0.504 ^
(0.284) [-35.50] 1.139* (0.383) [230.04] -0.369 (0.402) [-60.56] 0.154 (0.361) [20.68]
Constant -2.820* (0.705) 0.754 (0.669) -0.803 (1.370) 0.181 (0.964) -32.689* (5.793) -38.671* (8.961) -37.912* (12.508) -26.814* (7.475)
Log-likelihood -38525 -37637 -15742 -29261 -2284 -1951 -1454 -1849
Predicted median tenure (days)
82 96 368 168 80 139 181 128
No. of observations failed
16,478 14,612 4,552 9,542 1,006 691 512 668
Notes: Dependent variable is log tenure. All estimations include state fixed-effects. Standard errors are in parentheses. Marginal effects are in brackets; they are evaluated at the median tenure. Standard errors for the marginal effects are available from the authors, but indicated levels of significance match those of the parameter coefficients. * indicates significant at the 99% level; +
indicates significant at the 95% level; ^
REFERENCES
Addison, John T., and Pedro Portugal 2004. “How Does the Unemployment Insurance
System Shape the Time Profile of Jobless Duration?,” Economics Letters 85 (2):
229-34.
Bartel, Ann P. 1982. “Wages, Nonwage Job Characteristics, and Labor Mobility.”
Industrial and Labor Relations Review 35(4): 578-89.
Becker, Gary S. 1975. Human Capita. 2nd ed. New York: National Bureau of Economic
Research.
Berg, Linnea, Lynn Olson, and Aimee Conrad. 1992 “Causes and Implications of Rapid Job Loss among Participants in a Welfare-to-Work Program.” Working Paper no. 92-1. Northwestern University, Center for Urban Affairs and Policy Research, Evanston, IL.
Bishop, John. 1981. "Employment in Construction and Distribution Industries: The
Impact of the New Jobs Tax Credit." 209-46 in Studies in Labor Markets, edited
by Sherwin Rosen. Chicago: University of Chicago Press.
Blank, Rebecca M. 1989. “Analyzing the Length of Welfare Spells.” Journal of Public
Economics 39(3): 245-73.
Blank, Rebecca M. 2002. "Evaluating Welfare Reform in the United States." Journal of
Economic Literature 40 (4): 1105-66.
Blank, Rebecca M. and Patricia Ruggles. 1994.“Short-Term Recidivism among
Public-Assistance Recipients.” American Economic Review 84 (2): 49-53.
Blau, Francine D. and Lawrence M. Kahn. 1981. “Race and Sex Differences in Quits by
Young Workers.” Industrial and Labor Relations Review 34 (4): 563-77.
Burtless, Gary T. 1985. "Are Targeted Wage Subsidies Harmful? Evidence from a Wage
Voucher Experiment." Industrial and Labor Relations Review 39 (1): 105-14.
Chapman, Kenneth S. and Lawrence Southwick Jr. 1991. “Testing the Matching
Hypothesis: The Case of Major-League Baseball.” American Economic Review
81 (5): 1352-60.
Cox, D.R. and D. Oakes. 1984 Analysis of Survival Data. Monographs on Statistics and
Applied Probability no. 21. New York: Chapman and Hall.
Dolton, Peter and Wilbert van der Klaauw. 1991. “The Turnover of Teachers: A
Competing Risks Explanation.” Review of Economics and Statistics 81 (3):
Even, William E., and David A. Macpherson. 1996. "Employer Size and Labor Turnover:
The Role of Pensions." Industrial and Labor Relations Review 49 (4): 707-28.
Greenberg, David H., Charles Michalopoulos; and Philip K. Robins. 2003. "A
Meta-Analysis of Government-Sponsored Training Programs." Industrial and Labor
Relations Review 57 (1): 31-53.
Grogger, Jeffrey. 2005. "Welfare Reform, Returns to Experience, and Wages: Using Reservation Wages to Account for Sample Selection Bias." Working Paper no. 11621. National Bureau of Economic Research, Cambridge, MA.
Gunderson, Jill Marie, and Julie L. Hotchkiss. "Welfare Recipiency, Job Separation, Outcomes and Post-separation Earnings: Insight from Linked Personnel and State Administrative Data." Federal Reserve Bank of Atlanta Working Paper no. 2006-7. Federal Reserve Bank of Atlanta.
Hamersma, Sarah. "The Effects of an Employer Subsidy on Employment Outcomes: A
Study of the Work Opportunity and Welfare-to-Work Tax Credits." Mimeo,
University of Florida (July 2005).
Hamersma, Sarah. 2003. "The Work Opportunity and Welfare-to-Work Tax Credits:
Participation Rates among Eligible Workers." National Tax Journal 56 (4):
725-38.
Hamersma, Sarah, and Carolyn Heinrich. 2005. "Temporary Help Service Frims' Use of Employer Tax Credits: Implications for Disadvantaged Workers' Labor Market
Outcomes." Working Paper. University of Florida, Department of Economics,
University of Florida, Gainesville.
Hollenbeck, Kevin M. and Richard J. Willke. 1991. "The Employment and Earnings
Impacts of the Targeted Jobs Tax Credit." Upjohn Institute Staff Working Paper
91-7. W.E. Upjohn Institute for Employment Research, Kalamazoo, MI.
Holzer, Harry J., Michael A. Stoll, and Douglas Wissoker. 2004. "Job Performance and
Retention among Welfare Recipients." Social Service Review 78 (3): 343-69.
Hotchkiss, Julie L. 1991. "The Relative Effects of Unemployment Insurance Parameters
on Search Strategy." Economics Letters 35 (1): 95-98.
Hotz, V. Joseph and John Karl Scholz. 2001. "The Earned Income Tax Credit."
Working Paper no. 8078.National Bureau of Economic Research, Cambridge,
MA.
Johnson, Rucker and Mary E. Corcoran. 2003. "The Road to Economic Self-Sufficiency:
Job Quality and Job Transition Patterns after Welfare Reform." Journal of Policy
Jovanovic, Boyan. 1979a. “Firm-Specific Capital and Turnover” Journal of Political Economy 87 (6): 1246-60.
Jovanovic, Boyan. 1979b. “Job Matching and the Theory of Turnover.” Journal of
Political Economy 87 (5): 972-90.
Katz, Lawrence F. 1998. "Wage Subsidies for the Disadvantaged." 21-53 in Richard B.
Freeman and Peter Gottschalk, eds. Generating Jobs: How to Increase Demand
for Less-Skilled Workers. New York: Russell Sage.
Kiefer, Nicholas M. 1988. “Economic Duration Data and Hazard Functions.” Journal of
Economic Literature 26 (2): 646-79.
Lane, Julia and David Stevens. 2001. “Welfare-to-Work Outcomes: The Role of the
Employer” Southern Economic Journal 67 (4): 1010-21.
Lane, Julia and Michael Parkin. 1998. “Turnover in an Accounting Firm.” Journal of
Labor Economics 16 (4): 702-17.
Lawless, J.F. 1982. Statistical Models and Methods for Lifetime Data. New York: John
Wiley.
Leete, Laura. 1996. “Beyond the Dead-End? Labor Market Outcomes among AFDC Recipients.” Paper prepared for the 1996 Annual Meeting of the Western Economic Association June.
Light, Audrey and Manuelita Ureta. 1992. “Panel Estimates of Male and Female Job
Turnover Behavior: Can Female Nonquitters Be Identified?” Journal of Labor
Economics 10 (2): 156-81.
Loprest, Pamela. 2001. “How Are Families Who Left Welfare Doing over Time? A
Comparison of Two Cohorts of Welfare Leavers.” Federal Reserve Bank of New
York Economic Policy Review 7 (2): 9-19.
Meitzen, Mark E. 1986. “Differences in Male and Female Job-quitting Behavior.”
Journal of Labor Economics 4 (2): 151-67.
Parrott, Sharon. 1998. Welfare Recipients Who Find Jobs: What Do We Know about
Their Employment and Earnings? Washington, D.C.: Center on Budget and Policy Priorities.
Perloff, Jeffrey M. and Michael L. Wachter. 1979. "The New Jobs Tax Credit: An
Evaluation of the 1977-78 Wage Subsidy Program." American Economic Review
Royalty, Anne Beeson. 1998. "Job-to-Job and Job-to-Nonemployment Turnover by
Gender and Education Level." Journal of Labor Economics 16 (2): 392-443.
Sicherman, Nachum. 1996. “Gender Differences in Departures from a Large Firm.”
Industrial and Labor Relations Review 49 (3): 484-505.
Söderberg, Hans and Johan Lyhagen. 1999. “Testing for Independence in Multivariate Duration Models.” Working Papers in Economics and Finance 302, Stockholm School of Economics, Stockholm, Sweden.
Tannenwald, Robert. 1982. "Are Wage and Training Subsidies Cost-Effective? Some
Evidence from the New Jobs Tax Credit." New England Economic Review,
September/October, 25-34.
Van Ophem, Hans, and Nicole Jonker. 1997. “The Duration of Higher Education: Semiparametric Estimation of a Dependent Competing Risks Model.” Working paper. University of Amsterdam, The Netherlands.
Wagner, Suzanne L., and Toby Herr. 2003. "'Something Old, Something New' Revisited: Project Match Experiments with Retention Incentives." Research and Policy Update, December. Project Match, Chicago.
Weiss, Andrew. “Determinants of Quit Behavior.” Journal of Labor Economics 2 (3):
371-87.
Wolman, Hal. 1996. Welfare to Work: The Need to Take Place Differences into
Account. Technical Analysis Paper no. 45. Washington, D.C.: U.S. Department of Health and Human Services, January 1996.
Zill, Nicholas, Kristin A. Moore, Christine W. Nord, and Thomas Stief. 1991. Welfare
Mothers as Potential Employees: A Statistical Profile Based on National Survey