Temporal evolution of pump beam self-focusing at the
High-Frequency Active Auroral Research Program
M. J. Kosch,1,2T. Pedersen,1E. Mishin,3M. Starks,1E. Gerken-Kendall,4D. Sentman,5 S. Oyama,5,6 and B. Watkins5
Received 9 January 2007; revised 22 April 2007; accepted 7 May 2007; published 15 August 2007.
[1] On 4 February 2005 the High-Frequency Active Auroral Research Program (HAARP)
facility was operated at 2.85 MHz to produce artificial optical emissions in the ionosphere while passing through the second electron gyroharmonic. All-sky optical recordings were performed with 15 s integration, alternating between 557.7 and 630 nm. We report the first optical observations showing the temporal evolution of large-scale pump wave self-focusing in the magnetic zenith, observed in the 557.7 nm images. These clearly show that the maximum intensity was not reached after 15 s of pumping, which is unexpected since the emission delay time is <1 s, and that the optical signature had intensified in a much smaller region within the beam after 45 s of pumping. In addition, adjacent regions within the beam lost intensity. Radar measurements indicate a plasma depletion of1% near the HF reflection altitude. Ray tracing of the pump wave through the plasma depletion region, which forms a concave reflecting radio wave mirror, reproduces the optical spatial morphology. A radio wave flux density gain of up to30 dB may occur. In addition, the ray trace is consistent with the observed artificial optical emissions for critical plasma frequencies down to 0.5 MHz below the pump frequency.
Citation: Kosch, M. J., T. Pedersen, E. Mishin, M. Starks, E. Gerken-Kendall, D. Sentman, S. Oyama, and B. Watkins (2007), Temporal evolution of pump beam self-focusing at the High-Frequency Active Auroral Research Program,J. Geophys. Res.,112, A08304, doi:10.1029/2007JA012264.
1. Introduction
[2] Pumping the ionosphere with power
high-frequency (HF) radio waves can induce several turbulent instabilities, which result in electron acceleration. These electrons excite the neutral atmospheric constituents by collisions. A fraction of this energy is released as photons with wavelengths identical to the natural auroras. Although the phenomenon has been known at middle and low latitudes since the 1970s, it has only been unambiguously observed at high latitudes fairly recently, notably at Euro-pean Incoherent Scatter Scientific Association (EISCAT) facility in Norway [Bra¨ndstro¨m et al., 1999] and at HAARP in Alaska [Pedersen and Carlson, 2001]. Almost immedi-ately, it was noticed that the optical emission was signifi-cantly more intense in the magnetic zenith. For vertical pumping at EISCAT [Kosch et al., 2000] and HAARP
[Pedersen and Carlson, 2001] the emission region was displaced toward the magnetic zenith13°and15°away, respectively. The brightest optical emission was sometimes outside the3 dB locus of the pump beam. These obser-vations could not be explained by neutral winds or plasma convection [Pedersen and Carlson, 2001; Kosch et al., 2002a]. Pump beam swinging experiments at EISCAT [Kosch et al., 2003] and HAARP [Pedersen et al., 2003] clearly show that the maximum optical response occurs in the magnetic zenith at high latitudes, with a gain exceeding an order of magnitude compared to all other directions [Pedersen et al., 2003]. The ‘‘magnetic zenith’’ effect appears to be true for all optical wavelengths and so operates for all electron energies.
[3] The mechanism for electron acceleration is closely
linked to pump-induced small-scale field-aligned plasma irregularities, called striations, which are symbiotic with upper-hybrid electrostatic waves acting perpendicular to the magnetic field line direction [Kosch et al., 2002b, and references therein]. Striations can be generated at very low pump powers (<4 MW effective radiated power) [Wright et al., 2006], hence upper-hybrid resonance is rather easily stimulated. Strong production of striations has been observed for pump frequencies above the second electron gyroharmonic (2.85 MHz in the F-layer) [Kosch et al., 2007]. When pumping occurs outside the so-called Spitze cone, zenith angle6°at EISCAT and8°at HAARP, the pump waves will refract down below the nominal HF reflection altitude [e.g.,Kosch et al., 2002a] whilst propa-Here
for
Full Article
1
Space Vehicles Directorate, Air Force Research Laboratory, Hanscom Air Force Base, Massachusetts, USA.
2
Department of Communication Systems, Lancaster University, Lan-caster, UK.
3
Institute for Scientific Research, Boston College, Chestnut Hill, Massachusetts, USA.
4
SRI International, Menlo Park, California, USA.
5
Geophysical Institute, University of Alaska, Fairbanks, Alaska, USA.
6Solar-Terrestrial Environment Laboratory, Nagoya University, Nagoya,
Japan.
gating away horizontally from the source. The magnetic zenith is always outside the Spitze cone; hence no Airy swelling can occur [e.g., Mishin et al., 2005] because the pump waves directed at the magnetic zenith do not reflect back on themselves. Since constructive interference between the primary upward and reflected downward propagating waves boosts the pump wave electric field by an order of magnitude, it is not immediately obvious why the optical response in the magnetic zenith, where no Airy swelling occurs, should be so much greater than in the vertical, where Airy swelling is routinely observed. However, since the upper-hybrid resonance altitude occurs typically <10 km below the HF reflection altitude, upper-hybrid resonance still occurs at high latitudes in the magnetic zenith. This is true for pump frequencies <6.1 MHz at EISCAT and <5.4 MHz at HAARP [Mishin et al., 2005]. These lower HF pump frequencies are generally used for artificial optical emission experiments, which typically occur in a decaying ionosphere at night.
[4] Gurevich et al.[2001, 2002] suggested that nonlinear
pump wave self-focusing on large-scale bunches of stria-tions in the magnetic zenith could explain the dramatic enhancement of electron acceleration at high latitudes.
Wright et al. [1988] found that large-scale plasma density depletion could occur when pumping the F-layer ionosphere over EISCAT. During artificial optical emission experiments at EISCAT [Rietveld et al., 2003] artificial plasma cavities with depletions of 10 – 20% have been observed (M. T. Rietveld, private communication, 2006). Similarly, also during artificial optical emission experiments at EISCAT [Kosch et al., 2002b], HF radio images of ionosonde backscatter often showed significant clustering around the magnetic zenith (M. T. Rietveld, private communication, 2006). This has been confirmed byDjuth et al.[2006] who found preferential production of large-scale plasma irregu-larities in the magnetic zenith over HAARP. Theory by
Guzdar et al. [1996] found that self-focusing favors large transverse scale sizes (>km) because diffraction effects suppress self-focusing at shorter wavelengths. Scintillation observations at EISCAT confirm this idea [Basu et al., 1997]. However, the growth time of km scale irregularities is minutes in contrast tens of seconds for 10 m scale irregularities and seconds for meter-scale irregularities [Basu et al., 1997].
[5] Magnetic field-aligned plasma depletion [Thome and Perkins, 1974] and pump beam self-focusing [Allen et al., 1974] has also been observed at midlatitudes. Plasma irregularities set in within 10 s of pumping [Utlaut et al., 1970] and self-focusing of the pump wave in the magnetic zenith can occur for small plasma depletions of order <1% [Georges, 1970]. Rocket and satellite measure-ments at Arecibo of pump-induced striations revealed small-scale plasma depletions up to 12% (mean 6%) [Kelley et al., 1995] and 3% [Farley et al., 1983], respectively, for low latitudes. Rocket measurements at EISCAT show small-scale pump-induced plasma depletions up to 2% (typically <1%) [Rose et al., 1985] for high latitudes.
[6] Extensive work has been done on pump beam
self-focusing and artificial optical emissions at Arecibo, located at low latitude (18.48°N), where the pump beam can not be steered into the magnetic zenith. Large-scale magnetic field-aligned artificial plasma cavities up to 50% depletion were
first reported byDuncan et al.[1988]. The first association between convecting artificial large-scale plasma cavities and artificial optical emissions was made by Bernhardt et al.
[1988a, 1989]. Bernhardt et al. [1988b] first reported the geomagnetic field alignment of the pump-induced artificial optical emissions. Chemical release rocket experiments in the ionospheric F-layer, expressly for the purpose of creating an artificial radio wave focusing lens, found the pump wave intensity increased by up to 20 dB [Bernhardt and Duncan, 1987;Bernhardt et al., 1995]. Although a large increase in optical emissions was predicted [Bernhardt et al., 1995], none was observed possibly due to the chemicals used.
[7] Self-focusing has also been studied theoretically
[Farley et al., 1983, and references therein], showing that heating of the ionosphere will lead to thermal self-focusing by hydrodynamic expansion of the plasma.Gurevich et al.
[1999] showed that pump wave trapping on bunches of striations is easily possible at high latitudes and also possible at low latitudes with some restrictions. Perkins and Goldman[1981] showed that self-focusing can occur in an under dense ionosphere.
[8] Pedersen et al.[2003],Mishin et al.[2005] andKosch et al.[2005] have all found that artificial optical emissions are produced in the magnetic zenith for pump frequencies up to 500 kHz above the nominal plasma critical frequency (foF2), i.e. in an under dense ionosphere. This provides evidence for electron heating by upper-hybrid resonance since the mechanism operates at an altitude several kilo-meters below the HF reflection level and therefore can be stimulated in an under dense ionosphere [Kosch et al., 2005;
Mishin et al., 2005]. Ionospheric HF pumping is accompa-nied by large increases in electron temperature of 1000 – 2000 K at low latitudes [Djuth et al., 1987;Newman et al., 1988] and 3000 – 4000 K at high latitudes [Leyser et al., 2000;Rietveld et al., 2003]. At high latitudes, it takes tens of seconds for the heat to propagate along the magnetic field line, covering200 to >600 km altitude.
[9] Mishin et al.[2004a, 2004b] have shown that plasma
depletion in the ionosphere can occur due to vibrationally excited N2in the presence of heated electrons. However, the
mechanism is slow and requires minutes at 400 km to 10 or more minutes at 300 km to produce the plasma depletion.
Guzdar et al.[1998] showed that for typical powers (100 – 300mW/m2) and frequencies (5 – 10 MHz) of ionospheric heaters, the plasma would become unstable to thermal filamentation within seconds, and a broad spectrum of plasma irregularity scale sizes, limited by diffraction, would appear. They predict that kilometer scale plasma irregular-ities grow initially but thermal self-focusing causes collapse to smaller scale sizes (tens to hundreds meters) with saturation setting in within tens of seconds. Heat conduction along the magnetic field line depletes the plasma density, permitting the pump wave to propagate beyond the original reflection altitude into the over dense plasma. This is consistent with observations of strong 10-m scale produc-tion of striaproduc-tions when pumping the ionospheric F-layer above the second gyroharmonic [Kosch et al., 2007].
2. Results and Discussion
[10] On 4 February 2005 the HAARP facility in Alaska
beam size 32 45°) between 0300 and 0550 UT immediately after sunset, with 11 MW effective radiated power (ERP) and pointing into the magnetic zenith (204° azimuth, 75° elevation). Starting at 0300 UT, a pump modulation of 60 s off, 60 s O-mode, 60 s off, and 60 s X-mode was used to perform a frequency pass through the second electron gyroharmonic whilst searching for O- and X-mode resonances with the Kodiak SuperDARN radar [e.g., Hughes et al., 2004] and HAARP Modular UHF Ionospheric Radar (MUIR) [Oyama et al., 2006] facilities. These results are reported by Kosch et al. [2007]. The colocated Digisonde provided ionospheric density profiles every 2 min in the range 1 – 6 MHz. The colocated 446 MHz MUIR, which had just been commissioned, used a simple long pulse transmission whilst recording plasma-line data on a single receiver channel only. The beam (3 dB beam size 8.6°) was pointing into the magnetic zenith with a transmitter long pulse of 998ms (150 km), receiver gating of 10ms (1.5 km), and a data dump time of 10 ms, which was subsequently integrated for 2 s. Observations were made for 0317 – 0339 and 0341 – 0436 UT. Pumping the ionosphere with powerful HF radio waves results in para-metric decay instabilities just below the HF reflection altitude [Fejer, 1979], which produce Langmuir and ion-acoustic waves to which MUIR is sensitive in the plasma-line and ion-plasma-line channels, respectively. Hence during the pump pulses, the radar can measure the pump wave reflec-tion altitude with high temporal resolureflec-tion.
[11] All-sky optical recordings were performed at
HAARP, alternating between the O1S (557.7 nm) and O1D (630.0 nm) emissions with 15 s integration, which were synchronized to start with 557.7 nm at pump on. This gives a 557.7 nm image integrated in the period 0 – 15 s and 30 – 45 s of each minute. A 13° field of view imager pointing into the magnetic zenith recorded the fine spatial structures of the 557.7 nm emissions using 30 s integration. The camera has 512512 pixels, giving a spatial resolu-tion of 200 m at 230 km altitude. In addition, simulta-neous O1S and O1D optical recordings with 20 s integration
and30°field of view were made from Poker Flat Research Range 300 km to the north, starting at 0325 UT. These data give an altitude profile of the artificial optical emissions over HAARP, covering 120 – 400 km. These images are not synchronized to HAARP because of technical difficulties. The short delay time of the O1S emission (0.7 s) makes it suitable for observing the temporal evolution of pump-induced optical emissions. The O1D optical emissions are not discussed here because of their relatively long lifetime (30 s) in the F-layer ionosphere [Gustavsson et al., 2001]. Optical viewing conditions were ideal at HAARP, with clear sky and natural aurora on the far northern horizon only (Kp = 0). The optical path from Poker Flat was contami-nated by haze, especially at low elevations. The riometer at HAARP recorded no HF absorption in the D-layer. We report the first optical observations of the temporal evolu-tion of large-scale pump wave self-focusing in the magnetic zenith, as observed in the 557.7 nm images.
[12] Figure 1 shows the reflection (plus symbols) and
upper-hybrid resonance altitudes (cross symbols) over HAARP at 2.85 MHz from colocated Digisonde data. The dotted horizontal line at 225 km altitude corresponds to the second electron gyroharmonic as determined from the IGRF magnetic field model. The solid diagonal line gives the solar terminator altitude. The solid bars indicate when O-mode pumping occurred. The interleaved X-mode pump-ing produced no observable optical effects. Clearly, as time progresses, the HF reflection and upper-hybrid resonance altitudes ascend. At0345 UT the upper-hybrid resonance altitude passed through the second electron gyroharmonic. At 0410 UT the ionospheric critical frequency reached 2.85 MHz, corresponding to the solar terminator ascending through the F-region peak altitude. Upper-hybrid resonance ceases after0435 UT.
[13] Figure 2 shows an altitude-time plot of the
[image:3.612.62.298.56.205.2]back-ground-subtracted 557.7 nm optical intensity as viewed from Poker Flat with the HF reflection (solid line) and
Figure 1. The reflection (plus symbols) and upper-hybrid
resonance altitudes (cross symbols) over HAARP at 2.85 MHz from colocated Digisonde data. The dashed horizontal line is the altitude corresponding to the second electron gyroharmonic. The solid diagonal line gives the solar terminator altitude. The solid bars indicate when O-mode pumping occurred.
Figure 2. Altitude-time plot of background-subtracted
557.7 nm optical data from Poker Flat with the pump wave reflection (solid line) and upper-hybrid resonance (dotted line) altitudes overlaid. A spatial median filter has been applied, corresponding to 4 min in the time domain and
[image:3.612.312.548.487.660.2]upper-hybrid resonance (dotted line) altitudes overlaid. A spatiotemporal median filter has been applied, cor-responding to 4 min in the time domain and 10 (25) km at low (high) altitudes. The quasi-horizontal optical structures are either stars or gravity waves. The figure clearly shows the pump-induced artificial optical emissions whose maximum intensity occurs below the upper-hybrid resonance altitude at200 – 210 km, consistent withKosch et al.[2002a, and references therein]. The optical intensity appears to extend from 160 to 300 km in altitude, consistent with the electron temperature enhancements observed by Rietveld et al. [2003]. The artificial optical emissions centered on the magnetic zenith continued until
0435 UT when upper-hybrid resonance became impossi-ble, which is well after HF reflection ceased (0410 UT). This is consistent with the observations of Pedersen et al.
[2003], Kosch et al. [2005] and Mishin et al. [2005]. At 0430 UT, foF2 = 2.55 MHz, i.e., 300 kHz below the pump frequency. Optical emissions of irregular structure were produced after 0430 until 0438 UT, consistent with the observations of Pedersen et al. [2003] and Kosch et al.
[2005]. At 0438 UT, foF2 = 2.4 MHz, i.e., 450 kHz below the pump frequency, and no further optical emissions were observed.
[14] Figure 3 shows the average background-subtracted
[image:4.612.61.299.56.212.2]and calibrated 557.7 nm optical intensity for cones of20° (solid curve) and2.5°(dashed curve) diameter centered on the magnetic zenith, extracted from the all-sky images. The wide cone covers most of the artificially induced optical emission region, whereas the narrow cone covers the central bright spot within the artificially induced optical emission (see Figure 4, discussed below). Technical problems resulted in several data gaps. Background subtraction is necessary due to the changing twilight illumination. The background was a piecewise linear fit to the data point at the end of each 4 min cycle. The uncertainty introduced is <0.5 Rayleighs (R). The intrinsic noise level of the optical data is <1 R. The 557.7 nm optical intensity in the magnetic zenith, peaking at 11 R, is approximately double that averaged
Figure 3. The average background-subtracted 557.7 nm
optical intensity integrated in a 20° (solid curve) and
[image:4.612.312.553.71.583.2]2.5°(dashed curve) degree cone about the HAARP beam center. The dots give the start time of each 15-s integration, spaced 30 s apart. The arrows highlight examples of the delayed 557.7 nm emission.
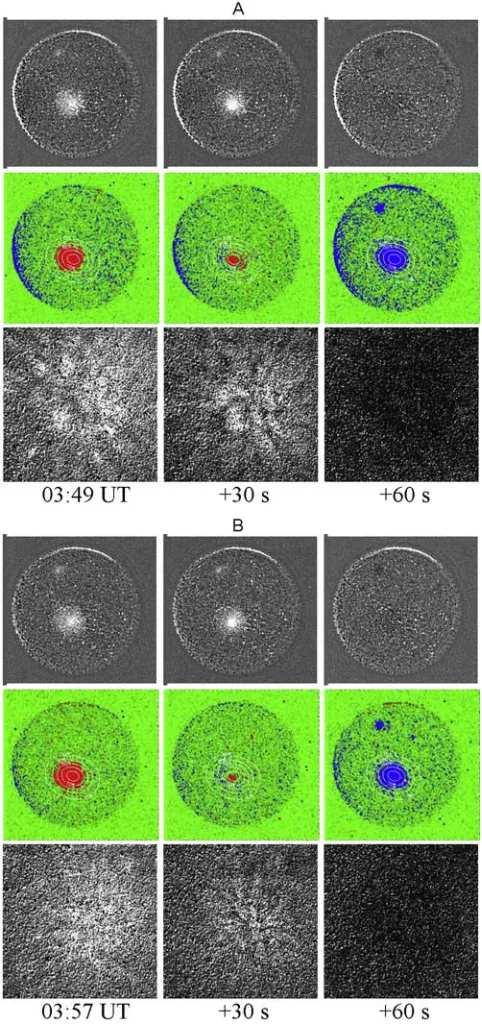
Figure 4. Example 557.7 nm images of the pump beam
over much of the beam, peaking at 7 R. The 630 nm emission is similar (not shown), peaking at 58 R in the magnetic zenith and24 R over much of the beam [Kosch et al., 2007]. Clearly, the optical emissions are enhanced during the O-mode pump pulses. No optical emissions are produced during the X-mode pump pulses. The sudden increase in 557.7 nm optical intensity at 0337 UT is correlated to the HF reflection altitude passing through the second gyroharmonic and is discussed in more detail by
Kosch et al.[2007]. The key point here is that the 557.7 nm optical emission does not reach its maximum intensity 15 s after pump on. This is especially obviously for the small integration cone and two instances are highlighted by arrows.Pedersen et al.[2003] noted this effect but offered no explanation. The observation is very surprising as the O1S emission is expected to reach its maximum intensity within 1 s.
[15] Figure 4 shows 557.7 nm all-sky images for the
times highlighted in Figure 3 (Figure 4a: 0349 UT, Figure 4b: 0357 UT). The monochrome all-sky images (top row) are background-subtracted and contrast-stretched 557.7 images corresponding to 0 – 15, 30 – 45, and 60 – 75 s after pump on, the last image occurring after pump off. The false color panels (middle row) show the first difference images of the top row, where red and blue are positive and negative intensity changes, respectively, and green corresponds to no change. This presentation method was developed to highlight small intensity changes [Kosch and Scourfield, 1992]. Overlaid are percentage power contours of the HAARP beam. The blue region on the southwest horizon is due to sunset. There is evidence of natural auroral activity on the extreme northern horizon. The bottom row of panels are first difference monochrome images from the 557.7 nm 13°narrow field of view imager, showing fine spatial scale structures. Whilst the raw all-sky images reveal only the presence of artificial optical emissions, the color difference images clearly show that the O1S intensity increases (red) in a cone of22°for 0 – 15 s after pump on. This is followed by the O1S intensity continuing to increase in a cone of9° for 30 – 45 s after pump on while the surrounding region either is unchanged, or even decreasing, in intensity. The (blue) regions of decreasing intensity appear in the form of a corona, which indicates magnetic field-aligned structures. Note the 3° equatorward displacement of the focused optical emission in the magnetic meridian plane. When the pump turns off, 60 – 75 s after pump on, the entire optical region decays (blue). This indicates that the O1S optical emission never decayed to the background level throughout the pump-on cycle. The morphology of the difference images is strong evidence for pump beam self-focusing in the magnetic zenith, despite the low temporal resolution of the optical data. The second region of decay-ing optical intensity north of HAARP is due to unrelated operations by the HIPAS heater,290 km away.
[16] The MUIR data (not shown) show a reflection altitude
during the HAARP transmissions consistent with the iono-sonde data shown in Figure 1. However, they also show a feature impossible to extract from the ionosonde data, namely, that the HF reflection altitude ascends by10 km during the pump pulses. Since the pump frequency remains constant, an upward altitude movement is indicative of a plasma depletion at the original reflection altitude. This
assumes that natural variations in the ionosphere are small, which is always the case during the 1-min pump pulses (see Figure 1). From the analyzed ionograms, the depletion level is 0.5 – 1.5%, consistent with previous observations [e.g.,
Georges, 1970;Rose et al., 1985].
[17] Various attempts to reproduce the optical results by
ray tracing through a single beam-sized refractive plasma density cavity have all been unsuccessful. Different cross-sectional profiles, vertical extents and depletion depths have been tried (not shown). Generally, the small plasma deple-tion observed produces far too little ray bending to explain the focusing observed regardless of the plasma cavity shape. Only plasma depletions of several tens percent appear to work, and these are not consistent with the MUIR data. Hence we conclude that our observations are not explained by simple geometric optics of a single refracting plasma cavity.
[18] Since the plasma depletion is a function of the
electron temperature enhancement [e.g., Guzdar et al., 1998], it will be a function of radio wave power delivered into the ionosphere. Given the typical cross-sectional profile of a focused HF beam, the plasma depletion will maximize in the beam center. This will result in a concave HF mirror at the point of reflection, which will result in focusing. The exact relationship between HF beam power, electron tem-perature enhancement and plasma depletion is unknown for pumping on the second electron gyroharmonic (i.e.,
2.85 MHz in the F-layer). However, the presence of strong pump-induced striations (20 – 30 dB above back-ground) [Kosch et al., 2007] provides evidence of plasma heating [Robinson et al., 1996]. The plasma depletion cross-sectional profile was not measured since MUIR was not scanning. Hence as a reasonable starting point, we have performed HF ray tracing assuming a Gaussian plasma density depletion profile, consistent with the shape of the optical intensity cross-sectional profile [Pedersen et al., 2003]. The cross-sectional profile varies in width with altitude in accordance with the diverging pump beam. The beam parallel profile is flat topped ±100 km about the upper-hybrid resonance height, which is where the electron heat source is located, with a 25 km Gaussian roll-off at each end, consistent the optical emission shown in Figure 2. As stated earlier, the depletion profile below the HF reflection height introduces negligible refraction. The de-pletion profile above the HF reflection altitude has no effect on the HF rays. However, the depletion cross-sectional profile at HF reflection is important.
[19] Figure 5 shows ray tracing results using a Chapman
layer fitted to the real ionospheric density altitude profile for the cases shown in Figure 4. Figures 5a and 5b are for peak plasma depletions of 1% and 2%, respectively. The projec-tion is in the magnetic meridian and the ray tracing is performed for the HAARP beam configuration, i.e., ±16° about the magnetic field direction. The different colors divide the beam into equal thirds. The dashed black line denotes the magnetic field line through HAARP. In both cases, rays from the central part of the beam (green) focus, although this is not immediately obvious for 1% depletion (Figure 5a). Figure 5b shows the concave mirror as a small bump in the reflection caustic. This permits the HF rays to propagate above the original reflection level, consistent with
density calibrated using the real HAARP power profile, corresponding to the 1% and 2% depletion cases (Figures 5a and 5b), respectively. The dashed white line denotes the magnetic field line through HAARP. The flux densities at the reflection caustic are not reliable because of the singu-larity in the ray trace. However, the flux density at maxi-mum focus (5 dB) shows a gain of up to 30 dB compared to the region of unfocused upward propagating rays (35 dB).
[20] The HF focus forms below the reflection caustic,
consistent with Kosch et al. [2002a] and Figure 2, and displaced southward of where the magnetic field line intersects the reflection caustic, consistent with Figure 4. The 1% plasma depletion forms its focus at <230 km (Figure 5c), which is close to the upper-hybrid resonance altitude (225 km). Hence this geometry is most likely to produce strong plasma turbulence, consistent with the optical data. The flux density foci form long tails
[image:6.612.69.545.63.443.2]descend-ing in altitude. However, the number and location of these features depends on the depletion depth and the shape of the HF mirror, which is unknown. In addition, if the pump energy is converted into electron acceleration and photons, then the flux densities below the upper-hybrid resonance altitude after reflection may be significantly lower. The quality of the pump wave focus will also depend on how smooth the reflecting caustic is. Since prevailing conditions were Kp = 0, geomagnetic conditions were extremely quiet. However, the Kodiak SuperDARN radar, which is sensitive to 10 m scale irregularities, did show natural background backscatter (30 – 35 dB), which was significantly en-hanced by pumping (50 – 60 dB) [Kosch et al., 2007] (not shown). Such natural backscatter at HAARP around sunset [Djuth et al., 2005] and pump-enhanced backscatter [e.g., Kosch et al., 2002b] are common. Obviously, the irregularities make for a nonideal reflecting surface and real flux density gain is most likely less than 30 dB. In addition,
Figure 5. (a and b) Ray tracing of the HAARP pump beam for ±16°about the magnetic zenith direction.
it is not known how much pump energy is lost to upper-hybrid resonance during upward propagation, although anomalous absorption measurements at 3.515 MHz suggest this could be
15 dB in the quiet ionosphere [Stubbe et al., 1982]. Pump energy is converted into electron acceleration before reflec-tion as witnessed by the artificial optical emissions produced prior to focusing and around the focused spot.
[21] The 1% plasma depletion ray trace (Figures 5a and
5c) give a good approximation to the optical observations and is consistent with the MUIR radar data. The equator-ward displacement of maximum focus (5°), the apparent angular size of the maximum focus as seen from HAARP (5°), and the height of maximum focus (<230 km) are all remarkably similar to the optical data shown in Figures 2 and 4. We can approximately estimate the likely pump wave flux density gain for our experiment.Pedersen et al.[2003] showed a quasilinear relationship exists between O1D (630.0 nm) photon production and pump power below
10 MW ERP. This has never been tested for the O1S (557.7 nm) emission. However, assuming the quasilinear
relationship holds for 557.7 nm for our low ERP experiment and anomalous absorption due to striations reduces the pump wave flux by 15 dB [Stubbe et al., 1982], then for a focused optical spot of double the intensity (3 dB) of the surrounding emission region (Figure 3) the concave HF mirror must result in a flux density gain of 18 dB. This crude estimate is consistent with the idealized gain of 30 dB from ray tracing (Figure 5).
[22] Figure 6 shows ray tracing results for an underdense
[image:7.612.67.549.59.450.2]ionosphere (after 0410 UT) assuming a 1% Gaussian-shaped plasma depletion. As before, the projection is in the magnetic meridian and the ray tracing is performed for the HAARP beam configuration, i.e., ±16°about the mag-netic field direction. The solid line denotes the magmag-netic field line connected to HAARP, located at 0 km. The different colors divide the beam into equal thirds. Figures 6a, 6b, 6c, and 6d are for foF2 = 2.85 (0410 UT), 2.75 (0414 UT), 2.65 (0424 UT), and 2.55 (0430 UT) MHz, respectively. Focusing is still possible for foF2 > 2.55 MHz (Figure 6d) prior to 0430 UT, consistent with Perkins and Goldman
Figure 6. Ray tracing of the HAARP pump beam for ±16°about the magnetic zenith direction for a
[1981] as well as our optical data (see Figure 3), but the concave mirror disappears for foF2 <= 2.55 MHz (Figure 6d) after 0430 UT. Figure 1 shows that upper-hybrid resonance stopped at 0435 UT. Irregular optical emissions were observed until 0438 UT, these being due to natural large-scale plasma irregularities within which upper-hybrid reso-nance was still possible [Kosch et al., 2005]. Hence after 0430 UT, the production artificial optical emissions were still possible but only by the upward propagating pump waves, i.e., not by downward propagating waves after reflection.
[23] For a pump frequency of 2.85 MHz and 1% plasma
depletion in their thermal self-focusing model,Guzdar et al.
[1998] estimate the minimum transverse scale-size of large-scale plasma irregularities to be 170 m. The fine scale structures revealed by the 13°narrow field of view imager (Figure 4, bottom rows) have a scale size of 2 – 6 km assuming an altitude of 230 km, i.e., the upper-hybrid resonance altitude at the time of the observations in Figure 4. Our result is consistent with the 1 – 5 km scale size observed by Djuth et al. [2005]. Since these observations are taken close to the magnetic field direction, no significant parallax is expected. However, ionospheric plasma flow will cause the irregularities to move, taking with them the wave-plasma interaction regions. Hence the oxygen atoms pro-ducing the photons will smear out any fine-scale structures over the 30 s integration period. Unfortunately, no Dig-isonde skymap or SuperDARN radar data are available. However, Coupled Thermosphere Ionosphere Plasmasphere (CTIP) modeling (performed at the Community Coordinated Modeling Center at http://ccmc.gsfc.nasa.gov) indicates that the plasma speed was109 m/s at 230 km altitude for the time of the observations. The smallest observable structure is determined by the pixel resolution of the imager, which is
200 m at 230 km. This will appear smeared out by 30
109 ffi 3265 m, which is consistent with our minimum estimate above. The larger optical structures (6 km) would come from kilometer-scale plasma irregularities. Hence these optical data are consistent withGuzdar et al.’s [1998] model. We note that the large-scale irregularities are mostly likely not produced from a smooth ionospheric background because the time between O-mode pump pulses (3 min) is too short to prevent preconditioning of the plasma.
[24] The presence of hundreds of meters to
kilometer-scale structures in the optical data, the focusing of the artificial optical emissions from22°to a9°cone within tens of seconds, and the increase in HF reflection altitude resulting from a 1% plasma depletion are all consistent with the predictions ofGuzdar et al.[1998] and their theory of thermal self-focusing. Their mechanism appears to ex-plain the rapid plasma depletion observed, which then leads to the formation of the concave mirror at the reflection caustic and HF ray focusing. Our HAARP experiment does not fall in the range of their numerical simulations (HAARP =
20mW/m2, simulation = 100 – 300mW/m2, and HAARP = 2.85 MHz, simulation 5 – 10 MHz). Whilst the pump fre-quency does not appear important, pump power determines the electron temperature enhancement and plasma depletion depth in their model. However, we note that with a pump frequency of 2.85 MHz HAARP produces an O1D optical emission of 100 – 300 R for 11 MW ERP [Djuth et al., 2005;
Kosch et al., 2005], whereas for pump frequencies >4 MHz
EISCAT produces O1D optical intensities of order 100 R for pump powers of 70 – 200 MW ERP [Kosch et al., 2000, 2002b;Rietveld et al., 2003]. Since the O1D 630 nm pump-induced optical emission is at least partly a function of electron temperature [e.g.,Ashrafi et al., 2006;Gustavsson et al., 2002], we conclude that low pump powers at HAARP are compensated by pumping the ionosphere near the second electron gyroharmonic, which seems to produce significant electron temperature enhancements. Hence our observations are consistent with the model ofGuzdar et al.
[1998]. In addition, since the plasma depletion is controlled by the electron temperature enhancement, in principle, the focal length of the HF mirror can be controlled by correctly shaping the pump beam and varying the output power. Both are possible at HAARP.
3. Conclusion
[25] Using images of artificially induced 557.7 nm optical
emissions, we show the temporal evolution of large-scale self-focusing of the pump beam in the magnetic zenith of the high-latitude ionosphere. The optical emission collapses from a22°cone down to9°within tens of seconds. The rapid plasma depletion of 1% is consistent with thermal self-focusing. The optical spatial morphology can not be explained by plasma refraction of the HF beam. However, it can be explained by the formation an HF concave reflecting mirror at the reflecting caustic in the ionosphere. This is generated in the plasma by the pump beam itself by heating the electrons. An HF flux gain of up to 30 dB may be achieved if the reflecting caustic is smooth.
[26] Acknowledgments. The authors thank the following persons for their invaluable contributions: L. Snyder for setting up a fast-sweeping Digisonde mode synchronized to HAARP, permitting real time determina-tion of the correct pump frequency to find the second gyrofrequency. M. McCarrick for operating the HAARP facility. R. Esposito for upgrading the HAARP all-sky imager to improve its sensitivity. The HAARP program is a Department of Defense project managed jointly by the U.S. Air Force and U.S. Navy. This research was supported in part by AFRL contract F19628-02-C-0087 with Boston College and AFOSR under tasks 2311SD and 2311AS. M.J.K acknowledges support by the National Research Council Research Associateship program. M.J.K. is an Honorary Research Fellow, University of Kwazulu-Natal, Durban, South Africa.
[27] Amitava Bhattacharjee thanks the reviewers for their assistance in evaluating this paper.
References
Allen, E. M., G. D. Thome, and P. B. Rao (1974), HF phased array ob-servations of heater-induced spread-F,Radio Sci.,9, 905 – 916. Ashrafi, M., M. J. Kosch, and F. Honary (2006), Heater-induced altitude
descent of the EISCAT UHF ion-line overshoot: Observations and mod-eling,Adv. Space Res.,38, 2645 – 2652.
Basu, S., E. Costa, R. C. Livingston, K. M. Groves, H. C. Carlson, P. K. Chaturvedi, and P. Stubbe (1997), Evolution of subkilometer scale iono-spheric irregularities generated by high-power HF waves, J. Geophys. Res.,102, 7469 – 7475.
Bernhardt, P. A., and L. M. Duncan (1987), The theory of ionospheric focused heating,J. Atmos. Terr. Phys.,49, 1107 – 1117.
Bernhardt, P. A., L. M. Duncan, C. A. Tepley, R. A. Behnke, and J. P. Sheerin (1988a), Spatial and temporal evolution of 630.0 nm airglow enhancements during ionospheric heating experiments,Adv. Space Res., 8(1), 271 – 277.
Bernhardt, P. A., L. M. Duncan, and C. A. Tepley (1988b), Artificial air-glow excited by high-power radio waves,Science,242, 1022 – 1027. Bernhardt, P. A., C. A. Tepley, and L. M. Duncan (1989), Airglow
enhance-ments associated with plasma cavities formed during ionospheric heating experiments,J. Geophys. Res.,94, 9071 – 9092.
Bra¨ndstro¨m, B. U. E., T. B. Leyser, A. Steen, M. T. Rietveld, B. Gustavsson, T. Aso, and M. Ejiri (1999), Unambiguous evidence of HF pump-enhanced airglow at auroral latitudes,Geophys. Res. Lett.,26, 3561 – 3564.
Djuth, F. T., B. Thide, H. M. Ierkic, and M. P. Sulzer (1987), Large F region electron-temperature enhancements generated by high-power HF radio waves,Geophys. Res. Lett.,14, 953 – 956.
Djuth, F. T., T. R. Pedersen, E. A. Gerken, P. Bernhardt, C. A. Selcher, W. A. Bristow, and M. J. Kosch (2005), Ionospheric modification at twice the electron cyclotron frequency,Phys. Rev. Lett.,94, 125001. Djuth, F. T., B. W. Reinisch, D. F. Kitrosser, J. H. Elder, A. L. Snyder, and
G. S. Sales (2006), Imaging HF-induced large-scale irregularities above HAARP,Geophys. Res. Lett.,33, L04107, doi:10.1029/2005GL024536. Duncan, L. M., J. P. Sheerin, and R. A. Behnke (1988), Observations of ionospheric cavities generated by high-power radio waves,Phys. Rev. Lett.,61, 239 – 242.
Farley, D. T., C. LaHoz, and B. G. Fejer (1983), Studies of the self-focussing instability at Arecibo,J. Geophys. Res.,88, 2093 – 2102.
Fejer, J. (1979), Ionospheric modification and parametric instabilities,Rev. Geophys.,17, 135 – 153.
Georges, T. M. (1970), Amplification of ionospheric heating and triggering of ‘‘spread F’’ by natural irregularities,J. Geophys. Res.,75, 6436 – 6438. Gurevich, A. V., H. Carlson, M. Kelley, T. Hagfors, A. Karashtin, and K. P. Zybin (1999), Nonlinear structuring of the ionosphere modified by powerful radio waves at low latitudes,Phys. Lett. A,251, 311 – 321. Gurevich, A. V., H. Carlson, and K. P. Zybin (2001), Nonlinear structuring
and southward shift of a strongly heated region in ionospheric modifica-tion,Phys. Lett. A,288, 231 – 239.
Gurevich, A. V., K. P. Zybin, H. C. Carlson, and T. Pedersen (2002), Magnetic zenith effect in ionospheric modifications,Phys. Lett. A,305, 264 – 274.
Gustavsson, B., T. Sergienko, M. T. Rietveld, F. Honary, A. Steen, B. U. E. Bra¨ndstro¨m, T. B. Leyser, A. L. Aruliah, T. Aso, M. Ejiri, and S. Marple (2001), First tomographic estimate of volume distribution of HF-pump enhanced airglow emission,J. Geophys. Res.,106, 29,105 – 29,124. Gustavsson, B., B. U. E. Bra¨ndstro¨m, A. Steen, T. Sergienko, T. B. Leyser,
M. T. Rietveld, T. Aso, and M. Ejiri (2002), Nearly simultaneous images of HF-pump enhanced airglow at 6300 A and 5577 A,Geophys. Res. Lett.,29(24), 2220, doi:10.1029/2002GL015350.
Guzdar, P. N., P. K. Chaturvedi, K. Papadopoulos, M. J. Keskinen, and S. L. Ossakow (1996), The self-focusing instability in the presence of density irregularities in the ionosphere,J. Geophys. Res.,101, 2453 – 2460. Guzdar, P. N., P. K. Chaturvedi, K. Papadopoulos, and S. L. Ossakow
(1998), The thermal self-focussing instability near the critical surface in the high-latitude ionosphere,J. Geophys. Res.,103, 2231 – 2237. Hughes, J. M., W. A. Bristow, and R. T. Parris (2004), SuperDARN
ob-servations of spectral enhancements excited during an ionospheric heat-ing experiment, Geophys. Res. Lett., 31, L08808, doi:10.1029/ 2004GL019613.
Kelley, M. C., T. L. Arce, J. Salowey, M. Sulzer, W. T. Armstrong, M. Carter, and L. Duncan (1995), Density depletions at the 10-m scale induced by the Arecibo heater,J. Geophys. Res.,100, 17,367 – 17,376.
Kosch, M. J., and M. W. J. Scourfield (1992), Resolution of temporal and spatial ambiguities of intensity variations within pulsating aurorae, J. Geophys. Res.,97, 14,877 – 14,883.
Kosch, M. J., M. T. Rietveld, T. Hagfors, and T. Leyser (2000), High-latitude HF-induced airglow displaced equatorwards of the pump beam, Geophys. Res. Lett.,27, 2817 – 2820.
Kosch, M. J., M. T. Rietveld, T. K. Yeoman, K. Cierpka, and T. Hagfors (2002a), The high-latitude artificial aurora of 21 February 1999: An analysis,Adv. Polar Upper Atmos. Res.,16, 1 – 12.
Kosch, M. J., M. T. Rietveld, A. J. Kavanagh, C. Davis, T. Yeoman, F. Honary, and T. Hagfors (2002b), High-latitude pump-induced optical emissions for frequencies close to the third electron gyro-harmonic, Geo-phys. Res. Lett.,29(23), 2112, doi:10.1029/2002GL015744.
Kosch, M. J., M. T. Rietveld, F. Honary, and T. Hagfors (2003), High latitude artificial aurora from HEATING: A unique phenomenon?, paper presented at 28th Annual European Meeting on Atmospheric Studies by Optical Methods, Sodankyla Geophys. Obs., Oulu, Finland.
Kosch, M. J., T. Pedersen, J. Hughes, R. Marshall, E. Gerken, A. Senior, D. Sentman, M. McCarrick, and F. Djuth (2005), Artificial optical emis-sions at HAARP for pump frequencies near the third and second gyro-harmonic,Ann. Geophys.,23, 1585 – 1592.
Kosch, M. J., T. Pedersen, E. Mishin, S.-I. Oyama, J. Hughes, A. Senior, B. Watkins, and B. Bristow (2007), Coordinated optical and radar obser-vations of ionospheric pumping for a frequency pass through the second electron gyro-harmonic at HAARP,J. Geophys. Res., 112, A06325, doi:10.1029/2006JA012146.
Leyser, T. B., B. Gustavsson, B. U. E. Bra¨ndstro¨m, A. Steen, F. Honary, M. T. Rietveld, T. Aso, and M. Ejiri (2000), Simultaneous measurements of high-frequency pump-enhanced airglow and ionospheric temperatures at auroral latitudes,Adv. Polar Upper Atmos. Res.,14, 1 – 11.
Mishin, E. V., W. J. Burke, and A. A. Viggiano (2004a), Stormtime sub-auroral density troughs: Ion-molecule kinetics effects,J. Geophys. Res., 109, A10301, doi:10.1029/2004JA010438.
Mishin, E. V., W. J. Burke, and T. Pedersen (2004b), On the onset of HF-induced airglow at HAARP,J. Geophys. Res.,109, A02305, doi:10.1029/ 2003JA010205.
Mishin, E. V., W. J. Burke, and T. Pedersen (2005), HF-induced airglow at magnetic zenith: theoretical considerations,Ann. Geophys.,23, 47 – 53. Newman, A. L., H. C. Carlson, G. P. Mantas, and F. T. Djuth (1988),
Thermal response of the F region ionosphere for conditions of large HF-induced electron-temperature enhancements, Geophys. Res. Lett., 15, 311 – 314.
Oyama, S.-I., B. Watkins, F. T. Djuth, M. J. Kosch, P. Bernhardt, and C. J. Heinselman (2006), Persistent enhancement of the HF pump-induced plasma line measured with a UHF diagnostic radar at HAARP,J. Geo-phys. Res.,111, A06309, doi:10.1029/2005JA011363.
Pedersen, T. R., and H. C. Carlson (2001), First observations of HF heater-produced airglow at the High Frequency Active Auroral Research Pro-gram facility: Thermal excitation and spatial structuring,Radio Sci.,36, 1013 – 1026.
Pedersen, T. R., M. McCarrick, E. Gerken, C. Selcher, D. Sentman, H. C. Carlson, and A. Gurevich (2003), Magnetic zenith enhancement of HF radio-induced airglow production at HAARP,Geophys. Res. Lett.,30(4), 1169, doi:10.1029/2002GL016096.
Perkins, F. W., and M. V. Goldman (1981), Self-focusing of radio waves in an underdense ionosphere,J. Geophys. Res.,86, 600 – 608.
Rietveld, M. T., M. J. Kosch, N. R. Blagoveshchenskaya, V. A. Kornienko, T. B. Leyser, and T. K. Yeoman (2003), Ionospheric electron heating, optical emissions and striations induced by powerful HF radio waves at high latitudes: Aspect angle dependence, J. Geophys. Res., 108(A4), 1141, doi:10.1029/2002JA009543.
Robinson, T. R., F. Honary, A. J. Stocker, T. B. Jones, and P. Stubbe (1996), First EISCAT observations of the modification of F-region electron tem-peratures during RF heating at harmonics of the electron gyro frequency, J. Atmos. Terr. Phys.,58, 385 – 395.
Rose, G., B. Grandal, E. Neske, W. Ott, K. Spenner, J. Holtet, K. Maseide, and J. Trøim (1985), Experimental results from the HERO project: In situ measurements of ionospheric modifications using sounding rockets, J. Geophys. Res.,90, 2851 – 2860.
Stubbe, P., H. Kopka, T. B. Jones, and T. Robinson (1982), Wide band attenuation of radio waves caused by powerful HF waves: Saturation and dependence on ionospheric variability,J. Geophys. Res.,87, 1551 – 1555. Thome, G. D., and F. W. Perkins (1974), Production of ionospheric stria-tions by self-focusing of intense radio waves,Phys. Rev. Lett.,32, 1238 – 1240.
Utlaut, W. F., E. J. Violette, and A. K. Paul (1970), Some ionosonde ob-servations of ionosphere modification by very high power, high fre-quency ground-based transmission,J. Geophys. Res.,75, 6429 – 6435. Wright, D. M., J. A. Davies, T. K. Yeoman, T. R. Robinson, and H. Shergill
(2006), Saturation and hysteresis effects in ionospheric modification experiments observed by the CUTLASS and EISCAT radars,Ann. Geo-phys.,24, 543 – 553.
Wright, J. W., H. Kopka, and P. Stubbe (1988), A large-scale ionospheric depletion by intense radio waves heating,Geophys. Res. Lett.,15, 1531 – 1533.
E. Gerken-Kendall, SRI International, Menlo Park, CA 94025, USA. M. J. Kosch, Department of Communication Systems, Lancaster University, Lancaster LA1 4WA, UK. ([email protected])
E. Mishin, Institute for Scientific Research, Boston College, Chestnut Hill, MA 02167, USA.
S. Oyama, D. Sentman, and B. Watkins, Geophysical Institute, University of Alaska, Fairbanks, AK 99775, USA.