International Journal of Emerging Technology and Advanced Engineering
Website: www.ijetae.com (ISSN 2250-2459,ISO 9001:2008 Certified Journal, Volume 4, Issue 1, January 2014)
1
Effect of Depth of Cut, Cutting Speed and Work-piece
Overhang on Induced Vibration and Surface Roughness in the
Turning of 41Cr4 Alloy Steel
C.O. Izelu
1, S.C. Eze
2, B.U. Oreko
3,
B.A Edward
41Senior Lecturer, 4Lecturer, Department of Mechanical engineering, FUPRE, Effurun, Delta State, Nigeria 2
PG Student, Department of Mechanical Engineering, NDA, Kaduna, Kaduna State, Nigeria
3
Lecturer, Department of Welding engineering and offshore Technology, PTI, Effurun, Delta State, Nigeria
Abstract– The effect of turning parameters on induced
vibration and work surface roughness of 41Cr4 alloy steel was experimentally examined. Response Surface Methodology in conjunction with third order composite factorial Design is used to evaluate the effect of turning parameters on induced vibration amplitude and surface roughness. The results, from the turning operations performed in the experiment, gave rise to a predictive second order response surface equation. Besides, it was observed that turning parameters (dept of cut, cutting speed and work piece overhang) had significant effect on the surface roughness of work piece, and to a relative degree, influenced induced vibration. It also shows that the induced vibration and surface roughness of work-piece is directly proportional to the depth of cut, cutting speed and work piece overhang.
Keyword– Turning Parameter, Alloy Steel, induced
vibration, surface roughness
I. INTRODUCTION
Vibration is a frequent problem, which affects results of the machining, and in particular, surface finish in turning operation (Sayeed Ahmed G. M. [1]). Tool life is also influenced by vibration. Severe acoustic noise in the working environment frequently results as a dynamic motion between the cutting tool and the work piece. In all cutting operations like turning, boring and milling vibrations are induced due to deformation of the work piece. Several machining parameters, such as cutting speed, feed rate, work piece material, and cutting tool geometry have significant effects on the process quality. This implies several disadvantages, economical as well as environmental (Thomas L. Lago [2]).
Keraita J. N. [3] reported that in machining operation, the quality of surface finish is an important requirement for many turned work pieces.
Thus, the choice of optimized cutting parameters becomes very important to control the required surface quality. Chen and Smith [4] observed that metal cutting is one of the most significant manufacturing processes in the area of material removal. To optimize the system, several researchers have developed mathematical models to predict the surface roughness in terms of various process parameters during turning of different materials.
For instance, Kopac and Bahor [5] examined the changes in surface roughness of AISI 1060 and AISI 4140 steels and analyzed the effect of cutting parameters by using RSM. Choudhury and El-Baradie [6] developed surface roughness prediction model in turning of high strength steel by factorial design of experiments. Nalbant et al [7] examined Taguchi method in the optimization of cutting parameters for surface roughness in turning. Sahin Y. Motorcu [8] used RSM to model the surface roughness of machined hardened AISI 1040 steel using triangular and square tools. Ozel and Karpat [9] used regression analysis to predict Artificial Neural Network (ANN) for predictive modeling of surface roughness and tool wear in turning. Mansour et al [10] studied a surface roughness model that utilizes RSM for milling of steel in dry condition.
International Journal of Emerging Technology and Advanced Engineering
Website: www.ijetae.com (ISSN 2250-2459,ISO 9001:2008 Certified Journal, Volume 4, Issue 1, January 2014)
2
II. EXPERIMENTATION AND METHOD OF ANALYSISA.Materials and Equipment
The following Materials and equipment are used to perform theexperiment; Work-piece type 41Cr4 alloy steel round bar of 25Ø x 150 mm with the following specifications; (UTS = 902.83 N/mmm2, BHN = 278.55 and chemical composition of 0.4%C, 0.25 S, 0.65 Mn, 1.0 Cr) (Fig 1); conventional lathe Machine (Fig 2) with carbide (F30 Type) cutting tool (Fig 3) of dimension (25x25x12.5mm) type (HSS-718) with the following angles; back and side rake angle is 10o, 12o respectively, side relief angle is 5o and side cutting edge angle is 15o using the stardard angle given in Jaton N.W[11].
[image:2.612.355.532.277.515.2]Figure 1: Work-Piece Material
Figure 2: Lathe machine
Figure 3: Cutting Tool
B.Induced Machining Vibration
Self-excited vibration or self- induced vibration, which is also known as chatter, is the basis under consideration. It is caused by the interaction of the chip removal process and the structure of the machine tool that results in disturbances in the cutting zone.
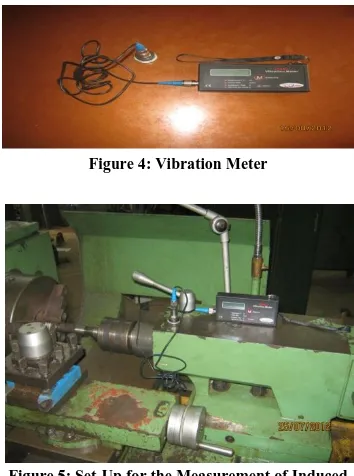
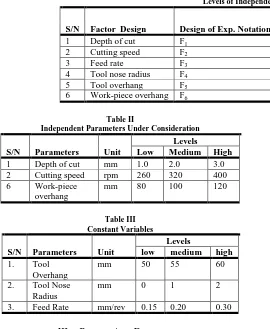
Chatter always gives rise to defects on the machined surface; vibration especially self-excited vibration is associated with the machined surface roughness A Vibration Meter 908Be series type measurement devise (Fig 4), was used for measuring the amplitude and velocity of a point on the cutting tool. The tool vibration level was measured using a vertical data of a transducer mounted near to the tip and connected to the devices. The data include displacement and velocity of the indicated point on the tool for each sample. The acceleration was calculated by using general equation relating amplitude to acceleration.
Figure 4: Vibration Meter
Figure 5: Set-Up for the Measurement of Induced Vibration
C.Work Surface Roughness
[image:2.612.74.261.297.641.2]An inside surface Roughness tester, ISR-16 type instrument (Fig 6) was used for the measurement of surface roughness. Three different positions for each sample at 120o with each other and the average of the three reading are considered as surface texture of the turned surface.
[image:2.612.364.525.614.686.2]International Journal of Emerging Technology and Advanced Engineering
Website: www.ijetae.com (ISSN 2250-2459,ISO 9001:2008 Certified Journal, Volume 4, Issue 1, January 2014)
3
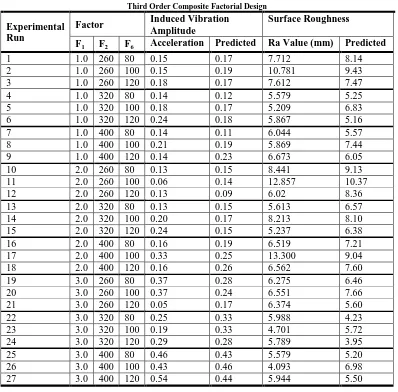
D.Response Surface MethodA third order composite factorial design and Response Surface Methodology RSM were chosen, so that different interactions between independent variables could be effectively investigated. The levels of the independent variables are as shown in Table I. The independent variables considered in the study are dept of cut F1, cutting speed F2, and work-piece overhang F6 as shown in Table II.
[image:3.612.321.549.234.658.2]The constant variables are given in Table III. The dependent variables are the resulting surface finish and the acceleration in both radial and feed directions. In order to minimize the effect of tool wear, which could affect the surface roughness, the tool was changed after 4 cuts. The newly installed tool was run for a few machining times to eliminate rapid tool wear.
Table I
Levels of Independent Variables
S/N Factor Design Design of Exp. Notation Symbol Unit
Levels
Low Medium High
1 Depth of cut F1 T mm 1.0 2.0 3.0
2 Cutting speed F2 N rpm 260 320 400
3 Feed rate F3 F mm/rev 0.15 0.20 0.30
4 Tool nose radius F4 R mm 0 1 2
5 Tool overhang F5 ht mm 50 55 60
[image:3.612.46.563.241.650.2]6 Work-piece overhang F6 hw mm 80 100 120
Table II
Independent Parameters Under Consideration
S/N Parameters Unit
Levels
Low Medium High
1 Depth of cut mm 1.0 2.0 3.0
2 Cutting speed rpm 260 320 400
6 Work-piece
overhang
mm 80 100 120
Table III Constant Variables
S/N Parameters Unit
Levels
low medium high
1. Tool
Overhang
mm 50 55 60
2. Tool Nose
Radius
mm 0 1 2
3. Feed Rate mm/rev 0.15 0.20 0.30
III. RESULT AND DISCUSSION
The study was undertaken to investigate the effect of turning parameters (dept of cut, cutting speed and work piece overhang) on induced vibration and surface roughness by turning 41Cr4 alloy steel. Machining data for dept of cut, cutting speed and work piece overhang on induced vibration and surface roughness, were tabulated accordingly in table IV. The result from the turning operating performed in the experiment gave rise to a predictive RSM equation for induced vibration (A) and surface roughness (Ra) respectively, given as:
6 2 6 1 2 1 2 6 2 2 2 1 6 2 1 6 2 1 031 . 0 028 . 0 053 . 0 020 . 0 023 . 0 077 . 0 002 . 0 054 . 0 079 . 0 172 . 0 , , F F F F F F F F F F F F F F F A (1)
6 2 6 1 2 1 2 6 2 2 2 1 6 2 1 6 2 1288
.
0
046
.
0
328
.
0
629
.
1
601
.
1
827
.
1
093
.
0
669
.
0
558
.
0
104
.
8
,
,
F
F
F
F
F
F
F
F
F
F
F
F
F
F
F
Ra
(2)Figure 7: Machine Work-Pieces
[image:3.612.48.318.246.575.2]International Journal of Emerging Technology and Advanced Engineering
Website: www.ijetae.com (ISSN 2250-2459,ISO 9001:2008 Certified Journal, Volume 4, Issue 1, January 2014)
4
The design of experiment took into consideration 27 experimental run consist of three (3) levels (low, medium, high) (Table III) of the following independent variables; depth of cut F1 (1.0, 2.0, 3.0 mm), cutting speed F2 (260, 320, 400 rpm) and work piece overhang F6(80, 100, 120 mm), to produce different response surface roughness as shown in Table IV.From experimental results, turning variables (dept of cut, cutting speed and work piece overhang) has significant effect on the surface roughness of work piece and to a relative degree influences induced vibration. It also shows that the induced vibration and surface roughness of work-piece is proportional to the depth of cut, cutting speed and work piece overhang.
[image:4.612.109.507.237.629.2]
Table IV
Third Order Composite Factorial Design Experimental
Run
Factor Induced Vibration Amplitude
Surface Roughness
F1 F2 F6 Acceleration Predicted Ra Value (mm) Predicted
1 1.0 260 80 0.15 0.17 7.712 8.14
2 1.0 260 100 0.15 0.19 10.781 9.43
3 1.0 260 120 0.18 0.17 7.612 7.47
4 1.0 320 80 0.14 0.12 5.579 5.25
5 1.0 320 100 0.18 0.17 5.209 6.83
6 1.0 320 120 0.24 0.18 5.867 5.16
7 1.0 400 80 0.14 0.11 6.044 5.57
8 1.0 400 100 0.21 0.19 5.869 7.44
9 1.0 400 120 0.14 0.23 6.673 6.05
10 2.0 260 80 0.13 0.15 8.441 9.13
11 2.0 260 100 0.06 0.14 12.857 10.37
12 2.0 260 120 0.13 0.09 6.02 8.36
13 2.0 320 80 0.13 0.15 5.613 6.57
14 2.0 320 100 0.20 0.17 8.213 8.10
15 2.0 320 120 0.24 0.15 5.237 6.38
16 2.0 400 80 0.16 0.19 6.519 7.21
17 2.0 400 100 0.33 0.25 13.300 9.04
18 2.0 400 120 0.16 0.26 6.562 7.60
19 3.0 260 80 0.37 0.28 6.275 6.46
20 3.0 260 100 0.37 0.24 6.551 7.66
21 3.0 260 120 0.05 0.17 6.374 5.60
22 3.0 320 80 0.25 0.33 5.988 4.23
23 3.0 320 100 0.19 0.33 4.701 5.72
24 3.0 320 120 0.29 0.28 5.789 3.95
25 3.0 400 80 0.46 0.43 5.579 5.20
26 3.0 400 100 0.43 0.46 4.093 6.98
27 3.0 400 120 0.54 0.44 5.944 5.50
The average values of induced vibration and surface roughness (Ra) result were also plotted on a graph to give a better understanding of the results. The relationship between depth of cut ( F1), Cutting speed (F2) and work-piece overhang (F4) with acceleration amplitude and the surface roughness of work piece for cutting condition is plotted in Figs. 8 and 9 respectively.
International Journal of Emerging Technology and Advanced Engineering
Website: www.ijetae.com (ISSN 2250-2459,ISO 9001:2008 Certified Journal, Volume 4, Issue 1, January 2014)
[image:5.612.63.274.142.282.2]5
Figure 8: Response Surface plot of the induced vibration dataFigure 9: Response Surface plot of the surface roughness data
IV. CONCLUSION
From the experimental results, turning parameter (dept of cut, cutting speed and work piece overhang) has significant effect on the surface roughness of work piece and to a relative degree influences induced vibration. It also shows that the induced vibration and surface roughness of work-piece is proportional to the depth of cut, cutting speed and work piece overhang.
REFERENCES
[1] Sayeed Ahmed G.M, Hakeemuddin Ahmed, Syed Safiuddin Samad, 2013. „Experimental Investigation of Effect of Tool Length on Surface Roughness during Turning Operation and its Optimization‟ IOSR Journal of Mechanical and Civil Engineering (IOSR-JMCE) e-ISSN: 2278 1684,p-e-ISSN: 2320-334X, Volume 7, Issue 2), PP 73-80 [2] Thomas L. Lago, Sven Olsson, Lars Hakansson and Ingvar
Claesson., 2002, “Performance of a Chatter Control System For Turning and Boring Applications”, 4th GRACM Congress on Computational Mechanics, GRACM, Patras 27-29 June, PP. 3-4 [3] Keraita J. N., Oyango H. J. and Misoi G. K., 2001, “Lathe Stability
Charts Via Acoustic Emission Monitering”, African Journal of Science and Technology (AJST), Science and Engineering Series., Vol. 2, No.2, PP. 81-93.
[4] Chen, J.C. & Smith, R., 1997, “Experimental Design and Analysis in Understanding Machining Mechanisms". Journal of Industrial Technology
[5] Kalpac J. and Bahor M. 1999, “Interaction of Technological History of a work piesce material and machining parameters on the desired qualityof surface roughness of a product” Journal of Materials Processing Technology, 145, PP. 381-387.
[6] Choudhry I.A. and El-Baradie M.A., 1997, “Surface Roughness Prediction in the turning of high strength steelby factorial design in experiments of turning process”, Journal of Materials Processing Technology, 67 PP. 55-61
[7] Nalbant M, Gokkaya H, and Sur G “Applicacation of Taguchi method in optimizing cutting parameters for surface roughness in turning”, Journal of Materials and design (in Press)
[8] Sahin Y. Motorcu, 2008, “Surface Roughness model in Machining hardened steel with cubic boron nitride tool” International Journal of refractory Metals and Hard Materials, 26, PP. 84-90
[9] Ozel T. and Karfat Y., 2005, “Predictive modeling of Surface roughness and tool Wear in hard turning using regression and neutral network”, International Journal of Machine tools and Manufacture, 45 PP. 467-479
[10] Mansour A, Abdalla H, and Meche F., 2002, “Surface Roughness model for end milling a semi free cutting carbon caschardening steel (EN32) in dry condition”, Journal of Materials Processing Technology, 124 PP. 183-191
[11] Jaton Nakia Wince, 2002 , “Modeling Chip Formation in Orthogonal Metal Cutting Using Finite Element Analysis ”, Msc. Thesis, Dep. of Mech. Eng., The Mississippi State University., PP. 11-12, 69
2 -0.50
0.00 0.50 1.00
-2 -1 0 1 2
F2 (Cutting
Speed)
A
(
A
cc
e
le
rati
o
n
A
mp
litu
d
e
)
F1 (Depth of Cut) and F6 (Workpiece Overhang)
Induced Vibration as Predicted by the Depth of Cut, Cutting Speed and
Workpiece Overhang
2 -10.000.00
10.00 20.00
-2 -1 0 1 2
F2 (Cutting
Speed)
R
a (
Su
rf
ac
e
R
o
u
gh
n
e
ss)
F1 (Depth of Cut) and F6 (Workpiece Overhang)
Surface Roughness as Predicted by the depth of Cut, Cutting Speed and
[image:5.612.62.272.305.465.2]