R E S E A R C H
Open Access
Community transcriptomics reveals universal
patterns of protein sequence conservation in
natural microbial communities
Frank J Stewart
1, Adrian K Sharma
2, Jessica A Bryant
2, John M Eppley
2and Edward F DeLong
2*Abstract
Background:Combined metagenomic and metatranscriptomic datasets make it possible to study the molecular evolution of diverse microbial species recovered from their native habitats. The link between gene expression level and sequence conservation was examined using shotgun pyrosequencing of microbial community DNA and RNA from diverse marine environments, and from forest soil.
Results:Across all samples, expressed genes with transcripts in the RNA sample were significantly more conserved than non-expressed gene sets relative to best matches in reference databases. This discrepancy, observed for many diverse individual genomes and across entire communities, coincided with a shift in amino acid usage between these gene fractions. Expressed genes trended toward GC-enriched amino acids, consistent with a hypothesis of higher levels of functional constraint in this gene pool. Highly expressed genes were significantly more likely to fall within an orthologous gene set shared between closely related taxa (core genes). However, non-core genes, when expressed above the level of detection, were, on average, significantly more highly expressed than core genes based on transcript abundance normalized to gene abundance. Finally, expressed genes showed broad similarities in function across samples, being relatively enriched in genes of energy metabolism and underrepresented by genes of cell growth.
Conclusions:These patterns support the hypothesis, predicated on studies of model organisms, that gene expression level is a primary correlate of evolutionary rate across diverse microbial taxa from natural environments. Despite their complexity, meta-omic datasets can reveal broad evolutionary patterns across taxonomically,
functionally, and environmentally diverse communities.
Background
Variation in the rate and pattern of amino acid substitu-tion is a fundamental property of protein evolusubstitu-tion. Understanding this variation is intrinsic to core topics in evolutionary analysis, including phylogenetic recon-struction, quantification of selection pressure, and iden-tification of proteins critical to cellular function [1,2]. A diverse range of factors has been postulated to affect the rate of sequence evolution within individual genomes, including mutation and recombination rate [3], genetic contributions to fitness (that is, gene essentiality) [4],
timing of replication [5], number of protein-protein interactions [6-8], and gene expression level [9]. Among these, gene expression level has emerged as the stron-gest predictor of evolutionary rate across diverse taxa, with highly expressed genes experiencing high sequence conservation [9-14]. However, these studies have focused on model organisms or small numbers of target species. The links between gene expression and broader evolu-tionary properties, including evoluevolu-tionary rate, and the mechanistic basis for these relationships remain poorly described for the vast majority of organisms, notably non-model taxa from diverse natural communities.
Deep-coverage sequencing of microbial community DNA and RNA (metagenomes and metatranscriptomes) provides an unprecedented opportunity to explore protein-coding genes across diverse organisms from * Correspondence: [email protected]
2Department of Civil and Environmental Engineering, Massachusetts Institute
of Technology, Parsons Laboratory 48, 15 Vassar Street, Cambridge, MA 02139, USA
Full list of author information is available at the end of the article
natural populations. Such studies have yielded valuable insight into the genetic potential and functional activity of natural communities [15-19], but thus far have been applied only sparingly to questions of evolution. Further-more, only a subset of studies present coupled DNA-RNA datasets for comparison [17,19-21]. When analyzed in tan-dem, coupled DNA-RNA datasets facilitate categorization of the relative transcription levels of different gene cate-gories, potentially revealing properties of sequence evolu-tion driven in part by expression level variaevolu-tion. However, it remains uncertain whether broad evolutionary correlates of gene expression, potentially including sequence conser-vation, would even be detectable in community-level sam-ples, which contain sequences from potentially thousands of widely divergent taxa. Here, we compare microbial metagenomic and metatranscriptomic datasets from mar-ine and terrestrial habitats to explore fundamental proper-ties of sequence evolution in the expressed gene set.
Specifically, we use coupled microbial (Bacteria and Archaea) metagenomic and metatranscriptomic datasets to explore the hypothesis that highly expressed genes are more conserved than minimally expressed genes. In lieu of conservation estimates based on alignments of ortho-logous genes, which are not feasible using fragmentary shotgun data containing tens of thousands of genes, sequence conservation was estimated based on amino acid identity relative to top matches in a reference data-base. Our results indicate a strong inverse relationship between evolutionary rate and gene expression level in natural microbial communities, measured here by proxy using transcript abundance. Furthermore, these results demonstrate broad consistencies in protein-coding gene expression, amino acid usage, and metabolic function across ecologically and taxonomically diverse microor-ganisms from different environments. This study illus-trates the utility of environmental meta-omic datasets for informing theoretical predictions based (largely) on model organisms in controlled laboratory settings.
Results and discussion
Expressed genes evolve slowly
The relationship between gene expression (transcript abundance) and sequence conservation was examined for protein-coding genes in coupled metagenome and metatranscriptome datasets generated by shotgun pyro-sequencing of microbial community DNA and RNA, respectively. These datasets represent varied environ-ments, including the oligotrophic water column from two subtropical open ocean sites in the Bermuda Atlan-tic Time Series (BATS) and Hawaii Ocean Time Series (HOT) projects, the oxygen minimum zone (OMZ) formed in the nutrient-rich coastal upwelling zone off northern Chile, and the surface soil layer from a North American temperate forest (Tables 1 and 2). Prior
studies have experimentally validated the metatranscrip-tomic protocols used here (RNA amplification, cDNA synthesis, pyrosequencing; see Materials and methods), confirming that estimates of relative transcript abun-dance inferred from pyrosequencing accurately parallel measurements based on quantitative PCR [15,17,19]. Here, amino acid identity relative to a top match refer-ence sequrefer-ence identified by BLASTX against the National Center for Biotechnology Information non-redundant protein database (NCBI-nr) is used to esti-mate sequence conservation.
In all the samples, amino acid identities, averaged across all genes per dataset, were significantly higher for RNA-derived sequences (metatranscriptomes) compared to DNA-derived sequences (metagenomes), with an aver-age difference of 8.9% between paired datasets (range, 4.4
to 14.7%;P< 0.001,t-test; Table 2). Further analysis of a
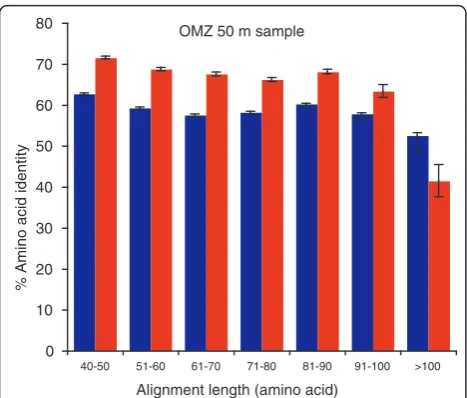
representative sample (OMZ, 50 m) showed that RNA identities remained consistently elevated across a gradi-ent of high-scoring segmgradi-ent pair (HSP) alignmgradi-ent lengths (Figure 1). This pattern suggests that the DNA-RNA dif-ference was not driven by the (on average) shorter read lengths in the RNA transcript pool (length data not shown), which could have imposed selection for reads with higher identity in order to meet the bit score cutoff (see Materials and methods). This pattern was not observed in the highest alignment length bin (>100 amino acids), likely due to the small number of genes
(n= 53) detected among the RNA reads falling into this
category (for example, 0.4% of those in the 40 to 50 amino acid bin; see error bars in Figure 1).
To further rule out that the DNA-RNA discrepancy was due to methodological differences in DNA- and RNA-derived samples (for example, error rate variation due to differential sample processing; see Materials and methods), we examined amino acid identities in expressed and non-expressed genes derived from the DNA dataset only. Hereafter, we operationally define
‘non-expressed’genes as those detected only in the DNA
datasets, whereas‘expressed’genes are those detected in
both the DNA and RNA datasets (gene counts per frac-tion are provided in Table 3). Across all datasets, mean identities for DNA-derived non-expressed genes were significantly lower (mean difference, 10.6%; range, 3.7 to
19.4%; P< 0.001,t-test; Table 2) than those of
unchanged when ribosomal proteins were excluded from the datasets (Table 4), as has been done previously to avoid bias due to the high expression and conservation of these proteins [14]. These data confirm a significantly higher level of sequence conservation in expressed versus non-expressed genes, broadly defined based on the pre-sence or abpre-sence of transcripts.
Given the differences observed between expressed and non-expressed categories, a positive correlation between conservation and the relative level of gene expression may also be anticipated [9]. Here, per-gene expression level was measured as the ratio of gene transcript abun-dance in the RNA relative to gene abunabun-dance in the DNA, with abundance normalized to dataset size. Corre-lations between amino acid identity and expression ratio were not observed in any of the samples when all genes
representing all taxa were combined (r2 = 0 to 0.02; see
Figure 2 for a representative dataset). This pattern sug-gests that for a substantial portion of the metatranscrip-tome, transcriptional activity cannot be used as a predictor of evolutionary rate. This is likely due in part to the difficulty of accurately estimating expression ratios for low frequency genes, which constitute the
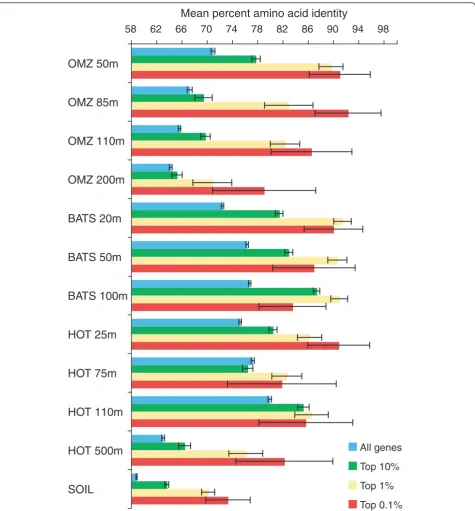
majority of the metatranscriptome at the sequencing depths used in this study [22,23]. However, across all samples, mean amino acid identity consistently increased with expression ratio when genes were binned into broad categories: all genes, top 10%, top 1%, and top 0.1% most highly expressed (Figure 3). These data indicate that while transcript abundance is a poor quan-titative indicator of sequence conservation on a gene-by-gene basis in community datasets, the most highly expressed genes are, on average, more highly conserved than those expressed at lower levels.
Genome-level corroboration
[image:3.595.56.539.101.417.2]It is possible that differences in the relative representation of genes in the BLAST databases may cause the incongru-ity in sequence conservation between expressed and non-expressed genes. Specifically, if non-expressed genes are more abundant in the database (which may be likely if these genes are also more abundant in nature), an expressed gene sampled from the environment will have a higher likelihood of finding a close match in the database, relative to a non-expressed gene. We therefore examined the dis-crepancy between expressed and non-expressed gene sets
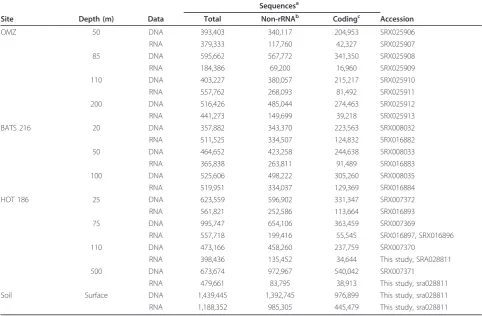
Table 1 Read counts and accession numbers of pyrosequencing datasets
Sequencesa
Site Depth (m) Data Total Non-rRNAb Codingc Accession
OMZ 50 DNA 393,403 340,117 204,953 SRX025906
RNA 379,333 117,760 42,327 SRX025907
85 DNA 595,662 567,772 341,350 SRX025908
RNA 184,386 69,200 16,960 SRX025909
110 DNA 403,227 380,057 215,217 SRX025910
RNA 557,762 268,093 81,492 SRX025911
200 DNA 516,426 485,044 274,463 SRX025912
RNA 441,273 149,699 39,218 SRX025913
BATS 216 20 DNA 357,882 343,370 223,563 SRX008032
RNA 511,525 334,507 124,832 SRX016882
50 DNA 464,652 423,258 244,638 SRX008033
RNA 365,838 263,811 91,489 SRX016883
100 DNA 525,606 498,222 305,260 SRX008035
RNA 519,951 334,037 129,369 SRX016884
HOT 186 25 DNA 623,559 596,902 331,347 SRX007372
RNA 561,821 252,586 113,664 SRX016893
75 DNA 995,747 654,106 363,459 SRX007369
RNA 557,718 199,416 55,545 SRX016897, SRX016896
110 DNA 473,166 458,260 237,759 SRX007370
RNA 398,436 135,452 34,644 This study, SRA028811
500 DNA 673,674 972,967 540,042 SRX007371
RNA 479,661 83,795 38,913 This study, sra028811
Soil Surface DNA 1,439,445 1,392,745 976,899 This study, sra028811
RNA 1,188,352 985,305 445,479 This study, sra028811
a
Generated on a Roche 454 GS FLX instrument.b
All non-rRNA reads; duplicate reads (reads sharing 100% nucleotide identity and length) excluded.c
only for DNA reads whose top hits match the same refer-ence genome. Under a null hypothesis of uniform evolu-tionary rates across a genome, all genes in a sample whose closest relative is the same reference genome should exhi-bit uniform divergence from the reference.
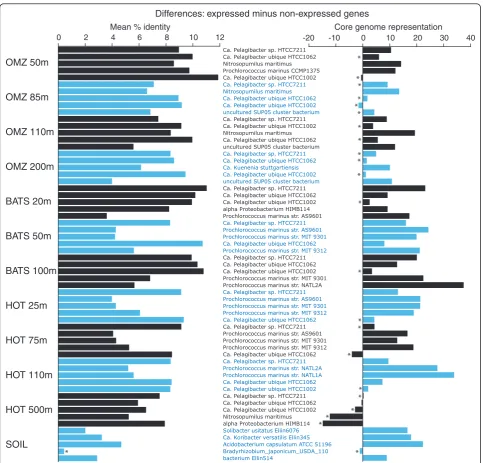
The link between expression level and sequence con-servation was observed at the level of individual genomes. Figure 4 (left panel) shows the discrepancy in amino acid identity between expressed versus non-expressed genes that match the top five most abundant reference taxa (whole genomes) in each sample. In all genomes, exclud-ingBradyrhizobium japonicumfrom the soil sample, the mean amino acid identity of expressed genes was
signifi-cantly greater than that of non-expressed genes (P <
0.001,t-test). These taxon-specific patterns argue against
an overall bias due to varying levels of gene representa-tion in the database. Rather, assuming that the sequences that match the expressed and non-expressed gene frac-tions of a given reference genome are indeed present in the same genome in the sampled environment (an
assumption that might be unwarranted if these two gene fractions experience varying rates of recombination or horizontal transfer among divergent taxa - see below), these results suggest that differential conservation levels, and not sampling artifacts, are driving the overall discre-pancy between expressed and non-expressed genes.
Core genes are overrepresented in the expressed gene fraction
Our data confirm an inverse relationship between expres-sion level and evolutionary rate in natural microbial com-munities. However, it remains unclear to what extent
gene expression level depends on a gene’s functional
importance to organism fitness (that is, essentiality)
ver-sus other potential explanations, such as‘translational
accuracy or robustness’[24]. It has been argued that
orthologous genes retained across divergent taxa (‘core’
[image:4.595.57.540.114.428.2]genes) may mediate basic cellular functions and that such genes are more likely to be more essential than non-core (taxon-specific) genes [25-27]. Here, we
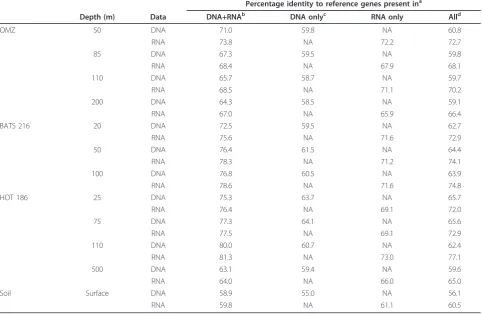
Table 2 Mean percentage amino acid identity of 454 reads matching database reference genes (NCBI-nr) shared between and unique to DNA and RNA samples
Percentage identity to reference genes present ina
Depth (m) Data DNA+RNAb DNA onlyc RNA only Alld
OMZ 50 DNA 71.0 59.8 NA 60.8
RNA 73.8 NA 72.2 72.7
85 DNA 67.3 59.5 NA 59.8
RNA 68.4 NA 67.9 68.1
110 DNA 65.7 58.7 NA 59.7
RNA 68.5 NA 71.1 70.2
200 DNA 64.3 58.5 NA 59.1
RNA 67.0 NA 65.9 66.4
BATS 216 20 DNA 72.5 59.5 NA 62.7
RNA 75.6 NA 71.6 72.9
50 DNA 76.4 61.5 NA 64.4
RNA 78.3 NA 71.2 74.1
100 DNA 76.8 60.5 NA 63.9
RNA 78.6 NA 71.6 74.8
HOT 186 25 DNA 75.3 63.7 NA 65.7
RNA 76.4 NA 69.1 72.0
75 DNA 77.3 64.1 NA 65.6
RNA 77.5 NA 69.1 72.9
110 DNA 80.0 60.7 NA 62.4
RNA 81.3 NA 73.0 77.1
500 DNA 63.1 59.4 NA 59.6
RNA 64.0 NA 66.0 65.0
Soil Surface DNA 58.9 55.0 NA 56.1
RNA 59.8 NA 61.1 60.5
a
Mean percentage identity across all genes (unique accession numbers) identified via BLASTX against NCBI-nr (HSP alignment regions only; bit score cutoff = 50).
b
Genes present in both DNA and RNA datasets, that is,‘expressed’genes.c
Genes present only in the DNA dataset, that is,‘non-expressed’genes.d
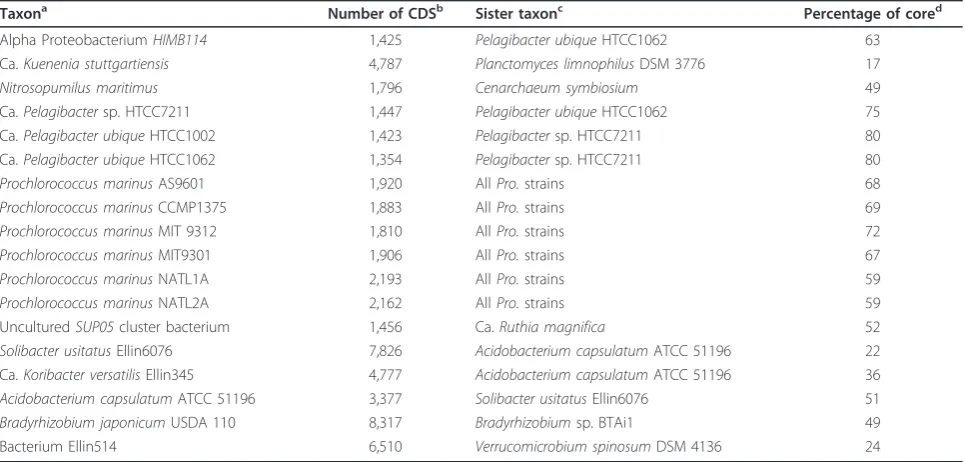
calculated the proportional representation of expressed and non-expressed genes in the core genome, determined separately for each of the top five most abundant
organ-isms in each of the samples (18 taxa total). Each taxon’s
core genome is composed of a relative orthologous gene set determined from comparison to a closely related sis-ter taxon (or taxa; Table 5). The exact number of genes
within each core set would likely vary if different sister taxa were used for comparison [28]. Here, the proportion of each genome that fell within the core set varied widely, from 17 to 80% (Table 5), reflecting natural variation and variation in the availability of whole genomes from differ-ent taxonomic groups.
Expressed genes were significantly more likely to fall within a core gene set shared across taxa. Figure 4 (right panel) shows the difference in core genome representa-tion (percentage of genes within core set) between expressed and non-expressed gene fractions for each reference organism. In 52 of the 60 comparisons (87%), the percentage of expressed genes falling within the core set was greater than that for the non-expressed gene fraction; of these differences, 38 (73%) were significant
(P< 0.0009, chi-square). In some taxa, such as
Prochlor-ococcus marinusstr. NATL2A, core genome representa-tion was over 30% greater among expressed genes relative to non-expressed genes. In contrast, for the HOT 500 m dataset, expressed genes were not enriched in core genes, which we speculate may be due to the activity of the microbial community at this depth (see Conclusions section below). Overall, however, the data support the broad trend that highly expressed genes are more likely to belong to an orthologous set shared across multiple taxa.
The differential representation of core genes within expressed and non-expressed genes may influence the relative sequence conservation levels of these two gene fractions. Gene acquisition from external sources (for example, homologous recombination, horizontal gene transfer (HGT)) is an important source of genetic varia-tion in bacteria [29]. A conserved core genome is tradi-tionally thought to undergo lower rates of recombination and HGT relative to more flexible genomic regions (for example, genomic islands) [30], though the horizontal transfer of core genes may also be common in some taxa [31]. A central limitation to shotgun sequencing datasets is that disparate sequences cannot be definitively linked to the same genome, making it challenging to evaluate the relative contributions of HGT, homologous recombi-nation, and mutation to sequence divergence. Conse-quently, it is possible that the higher levels of sequence divergence observed in the non-expressed gene set are due in part to enhanced rates of HGT among the non-core genes that predominate in this gene set.
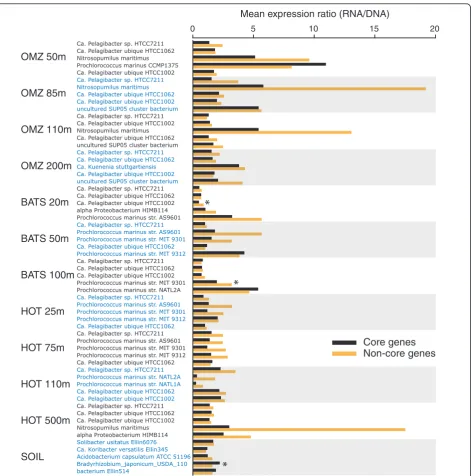
Surprisingly, within the expressed gene fraction, non-core genes were more highly expressed than non-core genes. Among the datasets representing the five most abundant
taxa per sample (n= 60, as above), 80% showed higher
expression levels (expression ratio) of non-core genes rela-tive to core genes (Figure 5). Averaged across all of these taxa, the expression ratio was 34% higher in non-core
[image:5.595.57.291.87.286.2]genes relative to core genes (2.5 versus 1.9;n= 13,324 and
Table 3 Unique reference genes shared between and unique to DNA and RNA datasets
Reference genes present ina
Depth (m) DNA+RNAb DNA onlyc RNA only
OMZ 50 11,374 113,747 21,445
85 5801 172,055 6766
110 17,843 109,924 31,697
200 12,688 126,574 17,408
BATS 216 20 29,841 90,866 60,287
50 26,954 110,131 38,145
100 31,416 119,795 36,871
HOT 186 25 28,459 135,390 44,243
75 18,098 142,892 21,800
110 12,148 125,882 12,315
500 14,345 248,534 13,573
Soil Surface 104,453 283,180 107,475
a
Number of unique NCBI-nr reference genes (accession numbers) identified as top matches to query reads via BLASTX (bit score > 50); in instances when a read matched multiple genes with equal bit scores, all genes were counted.
b
Genes present in both DNA and RNA datasets, that is,‘expressed’genes.
c
Genes present only in the DNA dataset, that is,‘non-expressed’genes. BATS, Bermuda Atlantic Time Series; BLAST, Basic Local Alignment Search Tool; HOT, Hawaii Ocean Time Series; NCBI-nr, National Center for Biotechnology Information non-redundant protein database; OMZ, oxygen minimum zone.
0 10 20 30 40 50 60 70 80
40-50 51-60 61-70 71-80 81-90 91-100 >100
Alignment length (amino acid)
% Amino acid identity
[image:5.595.56.290.490.662.2]OMZ 50 m sample
30,096, respectively;P< 0.00001). This pattern seemingly conflicts with studies based on cultured organisms. For example, a prior comparative survey of 17 bacterial pro-teomes showed a relative enrichment of peptides repre-senting proteins encoded within the core genome [28]. Also, essential proteins necessary for organism survival have been shown to be expressed at higher abundances
than nonessential proteins in cultures of bothEscherichia
coli[32] andPseudomonas aeruginosa[33]. This
observa-tion indirectly links core genome representaobserva-tion and gene expression, as essential orthologs have been shown to be more broadly represented among diverse taxonomic groups than nonessential genes [34]. Our data, represent-ing diverse taxa from the natural environment, raise the hypothesis that core genes are more likely to be expressed (above the level of detection at the sequencing depths used here). However, non-core genes, when expressed, are more likely to be expressed at higher levels. The high expression of non-core genes, also observed previously for
Prochlorococcus[19], may reflect the importance of taxon-specific genes for adaptation to individual niches in a het-erogenous environment [30].
Functional patterns in expressed gene sets
The degree to which expressed gene sets share functional similarity across microbial communities from diverse
habitats is unclear. Hewson et al. [16] observed shared
[image:6.595.58.540.112.259.2]functional gene content among metatranscriptome sam-ples taken from the same depth zone (upper photic layer) at eight sites in the open ocean. Also, the four OMZ metatranscriptome datasets analyzed in this study have been shown to cluster separately from the corresponding metagenome datasets based on functional category abun-dances, suggesting similar expressed gene content across depths [35]. However, this clustering was likely influenced in part by variation in per-gene sequence abundance (evenness) between the metagenomes and metatranscrip-tome, and did not explicitly compare expressed and non-expressed gene fractions. Here, we explored functional differences between expressed and non-expressed genes (as defined above) within metagenome (DNA) samples, for which the relative read copy number per gene is
Table 4 Mean percentage amino acid identity of OMZ 50-m reads with top matches to distinct reference databases (GOS, KEGG, NCBI-nr) and with ribosomal proteins removed
Percentage identity to reference genes present inb
Databasea Data DNA+RNAc DNA onlyd RNA only Alle
All data
GOS DNA 89.3 82.1 NA 82.8
GOS RNA 90.8 NA 87.5 89.3
KEGG DNA 67.8 58.3 NA 59.7
KEGG RNA 71.0 NA 69.4 69.6
NR DNA 71.0 59.8 NA 60.8
NR RNA 73.8 NA 72.2 72.7
Without ribosomal proteinsf NR DNA 70.7 59.6 NA 60.6
NR RNA 73.6 NA 71.9 72.5
a
BLAST database against which reads were compared.bMean percentage identity across all genes identified via BLASTX against NCBI-nr (HSP alignment regions only; bit score cutoff = 50).c
Genes present in both DNA and RNA datasets, that is,‘expressed’genes.d
Genes present only in the DNA dataset, that is,‘ non-expressed’genes.e
Genes shared between datasets (in DNA + RNA) plus genes unique to a dataset.f
Ribosome-associated proteins removed manually from datasets. BATS, Bermuda Atlantic Time Series; BLAST, Basic Local Alignment Search Tool; GOS, Global Ocean Sampling; HOT, Hawaii Ocean Time Series; HSP, high-scoring segment pair; KEGG, Kyoto Encyclopedia of Genes and Genomes; NA, not applicable; NR, National Center for Biotechnology Information non-redundant protein database (NCBI-nr); OMZ, oxygen minimum zone.
y = 1.5389Ln(x) + 71.846
10 100 1000
0.01 0.1 1 10 100 1000
y = 7.2772Ln(x) + 62.017 R2 = 0.0835
10 100 1000
1 10 100 1000 R2 = 0.0132
All data
Top 10% most highly expressed genes
P
ercent amino acid identity
Expression ratio (RNA/DNA)
BATS 20 m
[image:6.595.57.292.434.652.2]more uniform than for metatranscriptome samples. To do so, the proportional abundance of KEGG gene cate-gories and functional pathways was examined for five samples representing contrasting environments: the oxy-cline and lower photic zone of the coastal OMZ (50 m), the suboxic, mesopelagic core of the OMZ (200 m), the upper photic zone in the oligotrophic North Pacific
(HOT 25 m), the deep, mesopelagic zone (HOT 500 m), and the soil from Harvard Forest.
Hierarchical clustering based on correlations in gene category and functional pathway abundances indicated clear divisions among datasets. Not surprisingly, both the expressed and non-expressed fractions from the soil sample grouped apart from the ocean samples,
58 62 66 70 74 78 82 86 90 94 98
All genes
Top 10%
Top 1%
Top 0.1%
OMZ 50m
OMZ 85m
OMZ 110m
OMZ 200m
BATS 50m
BATS 100m
BATS 20m
HOT 25m
HOT 75m
HOT 110m
HOT 500m
SOIL
[image:7.595.62.538.87.599.2]Mean percent amino acid identity
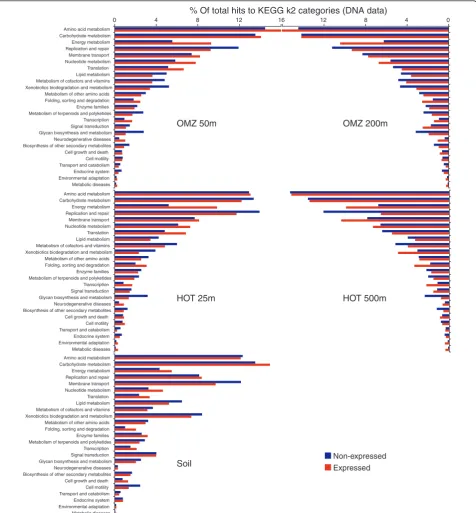
highlighting functional differences between ocean and soil communities (Figures 6 and 7). Among the four ocean metagenomes, expressed gene sets clustered together to the exclusion of the non-expressed genes from the same samples (Figure 6). Indeed, shifts in func-tional gene usage between expressed and non-expressed fractions were broadly similar across all samples (Figures 8 and 9). Instances in which all five samples showed the same direction of change (increase or decrease) in
KEGG gene category abundance occurred in 14 of the 25 functional categories shown in Figure 8 (marked by open stars), significantly higher (nine times) than ran-dom expectations if ignoring potential covariance
between categories (P < 0.0002, chi-square). Notably,
across all five samples, the expressed gene set was sig-nificantly enriched in genes involved in energy and nucleotide metabolism, transcription, and protein fold-ing, sortfold-ing, and degradation (Figure 8). In contrast, the
0 2 4 6 8 10 12 -20 -10 0 10 20 30 40
Ca. Pelagibacter sp. HTCC7211 Ca. Pelagibacter ubique HTCC1062 Nitrosopumilus maritimus Prochlorococcus marinus CCMP1375 Ca. Pelagibacter ubique HTCC1002 Ca. Pelagibacter sp. HTCC7211 Nitrosopumilus maritimus Ca. Pelagibacter ubique HTCC1062 Ca. Pelagibacter ubique HTCC1002 uncultured SUP05 cluster bacterium Ca. Pelagibacter sp. HTCC7211 Ca. Pelagibacter ubique HTCC1002 Nitrosopumilus maritimus Ca. Pelagibacter ubique HTCC1062 uncultured SUP05 cluster bacterium Ca. Pelagibacter sp. HTCC7211 Ca. Pelagibacter ubique HTCC1062 Ca. Kuenenia stuttgartiensis Ca. Pelagibacter ubique HTCC1002 uncultured SUP05 cluster bacterium Ca. Pelagibacter sp. HTCC7211 Ca. Pelagibacter ubique HTCC1062 Ca. Pelagibacter ubique HTCC1002 alpha Proteobacterium HIMB114 Prochlorococcus marinus str. AS9601 Ca. Pelagibacter sp. HTCC7211 Prochlorococcus marinus str. AS9601 Prochlorococcus marinus str. MIT 9301 Ca. Pelagibacter ubique HTCC1062 Prochlorococcus marinus str. MIT 9312 Ca. Pelagibacter sp. HTCC7211 Ca. Pelagibacter ubique HTCC1062 Ca. Pelagibacter ubique HTCC1002 Prochlorococcus marinus str. MIT 9301 Prochlorococcus marinus str. NATL2A Ca. Pelagibacter sp. HTCC7211 Prochlorococcus marinus str. AS9601 Prochlorococcus marinus str. MIT 9301 Prochlorococcus marinus str. MIT 9312 Ca. Pelagibacter ubique HTCC1062 Ca. Pelagibacter sp. HTCC7211 Prochlorococcus marinus str. AS9601 Prochlorococcus marinus str. MIT 9301 Prochlorococcus marinus str. MIT 9312 Ca. Pelagibacter ubique HTCC1062 Ca. Pelagibacter sp. HTCC7211 Prochlorococcus marinus str. NATL2A Prochlorococcus marinus str. NATL1A Ca. Pelagibacter ubique HTCC1062 Ca. Pelagibacter ubique HTCC1002 Ca. Pelagibacter sp. HTCC7211 Ca. Pelagibacter ubique HTCC1062 Ca. Pelagibacter ubique HTCC1002 Nitrosopumilus maritimus alpha Proteobacterium HIMB114 Solibacter usitatus Ellin6076 Ca. Koribacter versatilis Ellin345 Acidobacterium capsulatum ATCC 51196 Bradyrhizobium_japonicum_USDA_110 bacterium Ellin514
Mean % identity Core genome representation
Differences: expressed minus non-expressed genes
OMZ 50m
OMZ 85m
OMZ 110m
OMZ 200m
BATS 50m
BATS 100m BATS 20m
HOT 25m
HOT 75m
HOT 110m
HOT 500m
*
* * * *
* * *
* *
*
*
*
* *
*
* * * * *
* *
[image:8.595.57.541.86.549.2]SOIL
non-expressed gene set was enriched in genes mediating lipid metabolism and glycan biosynthesis and metabo-lism; in all ocean samples but not the soil sample, DNA replication and repair was also significantly
overrepre-sented among non-expressed genes (P < 0.0004,
chi-square). At the finer resolution provided at the KEGG pathway level, genes involved in oxidative phosphoryla-tion, chaperones and protein folding catalysis, transla-tion factors, and photosynthesis were consistently and
significantly (P < 0.0001, chi-square) overrepresented
among expressed genes in all samples, whereas genes of peptidoglycan biosynthesis, mismatch repair, and amino sugar and nucleotide sugar metabolism were proportion-ally more abundant in the non-expressed fraction (Figure 9). These data indicate broad similarities in functional gene expression across diverse microbial communities, with expressed gene pools biased towards tasks of energy metabolism and protein synthesis but relatively underrepresented by genes of cell growth (for example, lipid metabolism, DNA replication).
Database-independent analysis
Our characterization of relative evolutionary rates in expressed versus non-expressed genes is based on sequence divergence relative to closest relatives in the sequence database (NCBI-nr). It is unclear to what extent this same trend may be detected within clusters of related sequences within our samples, independent of comparison to an external reference database. We there-fore examined variability in amino acid divergence
within clusters of expressed and non-expressed protein-coding sequences for five representative samples, includ-ing shallow and deep depths from the OMZ and HOT oceanic sites, and the surface soil sample (Table 6).
Mean identity per cluster was consistently higher for DNA sequences in non-expressed clusters compared to DNA sequences from expressed clusters (mean difference 5.3%; Table 6). This pattern is opposite to that observed in comparisons of sequences to external reference data-bases (above). However, we argue that this inverse pat-tern is indeed consistent with our hypothesis that expressed genes are more likely to be part of a core set shared across taxa (Figure 4). If this hypothesis is true, then the DNA-only cluster set (non-expressed genes) will be relatively enriched in non-core genes, including those present in only one taxon/genome and lacking any known homologs (for example, orphans) [36,37]. In environmental sequence sets, if these sequences appear multiple times, they are more likely to be identical, or nearly so, because they come from a single taxon popula-tion and therefore cluster only with themselves (homo-logs from other taxa are by definition absent and will not fall into the cluster).
[image:9.595.57.540.100.331.2]In contrast, if expressed genes are more likely to fall within the core genome, clusters containing both DNA- and RNA-derived sequences (that is, expressed sequences) will be relatively enriched in homologs that occur across multiple divergent taxa. By definition, therefore, DNA+RNA clusters will be relatively enriched in sequences differing at both the population
Table 5 Proportion of reference taxon genes shared with sister taxon (that is, core gene set)
Taxona Number of CDSb Sister taxonc Percentage of cored
Alpha ProteobacteriumHIMB114 1,425 Pelagibacter ubiqueHTCC1062 63
Ca.Kuenenia stuttgartiensis 4,787 Planctomyces limnophilusDSM 3776 17
Nitrosopumilus maritimus 1,796 Cenarchaeum symbiosium 49
Ca.Pelagibactersp. HTCC7211 1,447 Pelagibacter ubiqueHTCC1062 75 Ca.Pelagibacter ubiqueHTCC1002 1,423 Pelagibactersp. HTCC7211 80 Ca.Pelagibacter ubiqueHTCC1062 1,354 Pelagibactersp. HTCC7211 80
Prochlorococcus marinusAS9601 1,920 AllPro.strains 68
Prochlorococcus marinusCCMP1375 1,883 AllPro.strains 69
Prochlorococcus marinusMIT 9312 1,810 AllPro.strains 72
Prochlorococcus marinusMIT9301 1,906 AllPro.strains 67
Prochlorococcus marinusNATL1A 2,193 AllPro.strains 59
Prochlorococcus marinusNATL2A 2,162 AllPro.strains 59
UnculturedSUP05cluster bacterium 1,456 Ca.Ruthia magnifica 52
Solibacter usitatusEllin6076 7,826 Acidobacterium capsulatumATCC 51196 22 Ca.Koribacter versatilisEllin345 4,777 Acidobacterium capsulatumATCC 51196 36
Acidobacterium capsulatumATCC 51196 3,377 Solibacter usitatusEllin6076 51
Bradyrhizobium japonicumUSDA 110 8,317 Bradyrhizobiumsp. BTAi1 49
Bacterium Ellin514 6,510 Verrucomicrobium spinosumDSM 4136 24
a
Representative taxon at high abundance in each sample.b
Number of CDS is the number of protein-coding genes in the sequenced reference genome of each taxon.c
Sister taxon used for identification of core genome (see main text).d
level and at higher taxonomic levels (for example,‘
spe-cies’), while DNA-only clusters will be enriched in
sequences differing only at the population level. Given this explanation, we would predict that DNA+RNA clusters (with RNA sequences excluded) are larger than DNA-only clusters and that the DNA-only cluster set as a whole is enriched in high identity clusters. Indeed, DNA+RNA clusters are, on average, approxi-mately 20 to 33% larger than DNA-only clusters (RNA
sequences not included in counts) and DNA-only clus-ter sets, notably those of the OMZ samples, are enriched in clusters with identities greater than 98% (Figure 10). These data indicate that expressed gene clusters recruit a larger and more diverse set of sequences, consistent with the hypothesis that expressed genes are more likely to represent core genes shared across taxa. More generally, the contrast between this self-clustering approach and the
BLAST-Ca. Pelagibacter sp. HTCC7211 Ca. Pelagibacter ubique HTCC1062 Nitrosopumilus maritimus Prochlorococcus marinus CCMP1375 Ca. Pelagibacter ubique HTCC1002 Ca. Pelagibacter sp. HTCC7211 Nitrosopumilus maritimus Ca. Pelagibacter ubique HTCC1062 Ca. Pelagibacter ubique HTCC1002 uncultured SUP05 cluster bacterium Ca. Pelagibacter sp. HTCC7211 Ca. Pelagibacter ubique HTCC1002 Nitrosopumilus maritimus Ca. Pelagibacter ubique HTCC1062 uncultured SUP05 cluster bacterium Ca. Pelagibacter sp. HTCC7211 Ca. Pelagibacter ubique HTCC1062 Ca. Kuenenia stuttgartiensis Ca. Pelagibacter ubique HTCC1002 uncultured SUP05 cluster bacterium Ca. Pelagibacter sp. HTCC7211 Ca. Pelagibacter ubique HTCC1062 Ca. Pelagibacter ubique HTCC1002 alpha Proteobacterium HIMB114 Prochlorococcus marinus str. AS9601 Ca. Pelagibacter sp. HTCC7211 Prochlorococcus marinus str. AS9601 Prochlorococcus marinus str. MIT 9301 Ca. Pelagibacter ubique HTCC1062 Prochlorococcus marinus str. MIT 9312 Ca. Pelagibacter sp. HTCC7211 Ca. Pelagibacter ubique HTCC1062 Ca. Pelagibacter ubique HTCC1002 Prochlorococcus marinus str. MIT 9301 Prochlorococcus marinus str. NATL2A Ca. Pelagibacter sp. HTCC7211 Prochlorococcus marinus str. AS9601 Prochlorococcus marinus str. MIT 9301 Prochlorococcus marinus str. MIT 9312 Ca. Pelagibacter ubique HTCC1062 Ca. Pelagibacter sp. HTCC7211 Prochlorococcus marinus str. AS9601 Prochlorococcus marinus str. MIT 9301 Prochlorococcus marinus str. MIT 9312 Ca. Pelagibacter ubique HTCC1062 Ca. Pelagibacter sp. HTCC7211 Prochlorococcus marinus str. NATL2A Prochlorococcus marinus str. NATL1A Ca. Pelagibacter ubique HTCC1062 Ca. Pelagibacter ubique HTCC1002 Ca. Pelagibacter sp. HTCC7211 Ca. Pelagibacter ubique HTCC1062 Ca. Pelagibacter ubique HTCC1002 Nitrosopumilus maritimus alpha Proteobacterium HIMB114 Solibacter usitatus Ellin6076 Ca. Koribacter versatilis Ellin345 Acidobacterium capsulatum ATCC 51196 Bradyrhizobium_japonicum_USDA_110 bacterium Ellin514
0 5 10 15 20
Core genes Non-core genes OMZ 50m
OMZ 85m
OMZ 110m
OMZ 200m
BATS 50m
BATS 100m BATS 20m
HOT 25m
HOT 75m
HOT 110m
HOT 500m
SOIL
Mean expression ratio (RNA/DNA)
[image:10.595.67.540.86.563.2]*
*
*
Figure 5Mean expression level of core and non-core genes across the five most abundant taxa per sample. Per gene expression level is measured as a ratio - (Transcript abundance in RNA sample)/(Gene abundance in the DNA sample) - with abundance normalized to dataset size.
based comparisons (above) demonstrates how diver-gence measurements taken relative to an external top match reference can differ from those relative to a top match internal reference from the same dataset, with the latter more likely to involve comparisons between highly related sequences from the same strains/ populations.
GC content and amino acid usage differ between expressed and non-expressed genes
The discrepancy in sequence conservation between expressed and non-expressed genes coincided with dif-ferences in nucleotide composition and amino acid usage between these two sequence pools. GC content was substantially higher in the soil compared to the ocean samples (approximately 20 to 25% enrichment) and consistent between the DNA and RNA pools (Table 7). In contrast, across all 11 ocean samples, RNA-derived protein-coding sequences were significantly ele-vated in GC relative to those from the DNA (mean RNA-DNA difference, 6%; Table 7), suggesting a broad shift towards GC enrichment in the expressed gene pool. Surprisingly, however, DNA sequences corre-sponding to expressed genes consistently had a lower GC content than DNA reads matching non-expressed
genes (mean difference, 1.9%). These data suggest that the DNA versus-RNA discrepancy in GC content may be driven by a subset of transcripts in the RNA pool, likely those at high abundance. Indeed, analysis of the RNA reads from one sample (OMZ 50 m) showed a progressive increase in GC content with transcript abundance (when transcripts are subdivided into four categories (top 10%, 1%, 0.1% 0.01%) based on the rank abundance of the genes they encode (data not shown).
Consistent with the GC pattern, amino acid usage of protein-coding sequences differed significantly between the DNA and RNA samples (Table 8, Figures 11, 12, 13, and 14). Notably, with the exception of three ocean samples (HOT 500 m, OMZ 110 m and 200 m) and the outlying soil sample, RNA datasets from diverse regions and depths grouped separately from DNA samples when clustered based on amino acid frequencies (Figure 12), suggesting a global distinction between the metage-nomic and metatranscriptomic amino acid sequence pools in marine microbial communities. Indeed, of 240 comparisons of amino acid proportions in DNA versus RNA datasets (12 DNA/RNA samples × 20 amino acids), 227 (95%) involved a significant change in amino acid frequency, with 114 involving an increase and 113 involving a decrease in frequency from DNA to RNA
OMZ 50m
OMZ 200m
HOT 500m
HOT 25m
OMZ 50m
OMZ 200m
HOT 500m
HOT 25m
Soil
Soil
0.84 0.88 0.92 0.96 1.0 Pearson correlation
OMZ 50m
HOT 25m
OMZ 200m
HOT 500m
OMZ 50m
OMZ 200m
HOT 500m
HOT 25m
Soil
Soil
0.84 0.88 0.92 0.96 1.0 Pearson correlation
KEGG gene categories
(
n
= 38)
[image:11.595.53.540.90.382.2]KEGG metabolic pathways
(
n
= 313 )
(P < 0.0002, chi-square; Table 8, Figure 13). (The high proportion of significant changes is due to the large sample sizes in the analysis.) On average, alanine, gly-cine, and tryptophan (high GC content) underwent the largest proportional increases from DNA to RNA, while lysine, isoleucine, and asparagine (low GC content) all
decreased substantially in frequency. These shifts were largely consistent among ocean samples, but clearly dis-tinct from the pattern observed in soil, where several amino acids changed in frequency in the direction oppo-site to that in the ocean samples.
Non-expressed Expressed
% Of total hits to KEGG k2 categories (DNA data)
0 4 8 12 16 12 8 4 0
OMZ 50m OMZ 200m
Amino acid metabolism Carbohydrate metabolism Energy metabolism Replication and repair Membrane transport Nucleotide metabolism Translation Lipid metabolism Metabolism of cofactors and vitamins Xenobiotics biodegradation and metabolism
Metabolism of other amino acids Folding, sorting and degradation Enzyme families Metabolism of terpenoids and polyketides
Transcription Signal transduction Glycan biosynthesis and metabolism
Neurodegenerative diseases Biosynthesis of other secondary metabolites Cell growth and death
Cell motility Transport and catabolism Endocrine system Environmental adaptation Metabolic diseases
HOT 25m HOT 500m
[image:12.595.60.537.89.603.2]Soil
Among the ocean datasets, DNA-RNA shifts in amino acid frequency were strongly related to amino acid GC content (Figure 11a; see Materials and methods). Amino acids with an intermediate GC content (0.5) constituted equivalent fractions, 40% and 36%, of the total number of amino acid frequency increases and decreases, respec-tively. Strikingly, amino acids with GC content below 0.5 were significantly less abundant in the RNA, being involved in 61% of all decreasing DNA-RNA amino acid frequency changes. In contrast, frequency increases were dominated by amino acids enriched in GC: 50% of increases involved amino acids with GC greater than 0.5, significantly higher than the representation of these
amino acids in changes involving a decrease (3%). A similar, but less dramatic, shift in amino acid usage is observed when the DNA reads were binned into expressed and non-expressed gene sets (Figure 11b). In general, the magnitude of the proportional shift in amino acid usage decreases with depth in the water col-umn (Figure 14). This pattern may reflect an overall decrease in microbial activity with depth, such that the transcriptome, less weighted by highly expressed and highly conserved genes, more closely resembles the metagenome as activity declines. Together, these results suggest a significant shift towards GC-rich amino acids in the expressed gene pool.
Amino acid metabolism Carbohydrate metabolism Energy metabolism Replication and repair Membrane transport Nucleotide metabolism Translation Lipid metabolism Metabolism of cofactors and vitamins Xenobiotics biodegradation and metabolism Metabolism of other amino acids Folding, sorting and degradation Enzyme families Metabolism of terpenoids and polyketides Transcription Signal transduction Glycan biosynthesis and metabolism Neurodegenerative diseases Biosynthesis of other secondary metabolites Cell growth and death Cell motility Transport and catabolism Endocrine system Environmental adaptation Metabolic diseases
-6 -4 -2 0 2 4 6
% Proportional change (expressed minus non-expressed)
[image:13.595.57.541.89.506.2]OMZ 50m OMZ 200m HOT 25m HOT 500m Soil
HO
T 25m
OMZ 50m OMZ 200
m
HO
T 500m
Soil
03020 RNA polymerase [PATH:ko03020] 00194 Photosynthesis proteins [BR:ko00194] 00195 Photosynthesis [PATH:ko00195] 00190 Oxidative phosphorylation [PATH:ko00190] 00061 Fatty acid biosynthesis [PATH:ko00061] 02035 Bacterial motility proteins [BR:ko02035]
00860 Porphyrin and chlorophyll metabolism [PATH:ko00860] 00290 Valine, leucine and isoleucine biosynthesis [PATH:ko00290] 00240 Pyrimidine metabolism [PATH:ko00240]
00250 Alanine, aspartate and glutamate metabolism [PATH:ko00250] 00620 Pyruvate metabolism [PATH:ko00620]
00630 Glyoxylate and dicarboxylate metabolism [PATH:ko00630] 05010 Alzheimer's disease [PATH:ko05010]
01004 Lipid biosynthesis proteins [BR:ko01004]
00260 Glycine, serine and threonine metabolism [PATH:ko00260] 00720 Reductive carboxylate cycle (CO2 fixation) [PATH:ko00720] 00640 Propanoate metabolism [PATH:ko00640]
03036 Chromosome [BR:ko03036]
04112 Cell cycle - Caulobacter [PATH:ko04112] 00270 Cysteine and methionine metabolism [PATH:ko00270] 00910 Nitrogen metabolism [PATH:ko00910]
02020 Two-component system [PATH:ko02020] 00450 Selenoamino acid metabolism [PATH:ko00450] 00380 Tryptophan metabolism [PATH:ko00380]
00550 Peptidoglycan biosynthesis [PATH:ko00550]
03010 Ribosome [PATH:ko03010] 03011 Ribosome [BR:ko03011]
03070 Bacterial secretion system [PATH:ko03070] 03060 Protein export [PATH:ko03060] 03012 Translation factors [BR:ko03012] 02044 Secretion system [BR:ko02044]
00710 Carbon fixation in photosynthetic organisms [PATH:ko00710] 00230 Purine metabolism [PATH:ko00230]
00480 Glutathione metabolism [PATH:ko00480]
00970 Aminoacyl-tRNA biosynthesis [PATH:ko00970]
03032 DNA replication proteins [BR:ko03032]
00400 Phenylalanine, tyrosine and tryptophan biosynthesis [PATH:ko00400] 03030 DNA replication [PATH:ko03030]
00900 Terpenoid backbone biosynthesis [PATH:ko00900] 03420 Nucleotide excision repair [PATH:ko03420]
00760 Nicotinate and nicotinamide metabolism [PATH:ko00760]
03400 DNA repair and recombination proteins [BR:ko03400]
03430 Mismatch repair [PATH:ko03430] 00300 Lysine biosynthesis [PATH:ko00300]
00010 Glycolysis / Gluconeogenesis [PATH:ko00010]
03440 Homologous recombination [PATH:ko03440]
01002 Peptidases [BR:ko01002]
03410 Base excision repair [PATH:ko03410] 00360 Phenylalanine metabolism [PATH:ko00360]
00500 Starch and sucrose metabolism [PATH:ko00500]
02022 Two-component system [BR:ko02022]
00030 Pentose phosphate pathway [PATH:ko00030]
00520 Amino sugar and nucleotide sugar metabolism [PATH:ko00520]
03018 RNA degradation [PATH:ko03018] 00920 Sulfur metabolism [PATH:ko00920] 03110 Chaperones and folding catalysts [BR:ko03110] 00680 Methane metabolism [PATH:ko00680] 00350 Tyrosine metabolism [PATH:ko00350] 00903 Limonene and pinene degradation [PATH:ko00903] 00561 Glycerolipid metabolism [PATH:ko00561]
00051 Fructose and mannose metabolism [PATH:ko00051]
00330 Arginine and proline metabolism [PATH:ko00330] 00770 Pantothenate and CoA biosynthesis [PATH:ko00770] 00410 beta-Alanine metabolism [PATH:ko00410]
00340 Histidine metabolism [PATH:ko00340]
02010 ABC transporters [PATH:ko02010] 02000 Transporters [BR:ko02000] 00310 Lysine degradation [PATH:ko00310] 00071 Fatty acid metabolism [PATH:ko00071] 00650 Butanoate metabolism [PATH:ko00650]
00632 Benzoate degradation via CoA ligation [PATH:ko00632] 00660 C5-Branched dibasic acid metabolism [PATH:ko00660] 00020 Citrate cycle (TCA cycle) [PATH:ko00020]
00280 Valine, leucine and isoleucine degradation [PATH:ko00280]
00670 One carbon pool by folate [PATH:ko00670]
[image:14.595.59.541.88.638.2]* * * * * * * * * * * * * * * * * * * * * * * * * * * * * * * * * * * * * * * * * * * * * * * * * * * * * * * * * * * * * * * * * * * * * * * * * * * * * * * * * * * * * * * * * *
Prior studies describe a relationship among gene expression level, sequence conservation, and amino acid usage [38-42]. Specifically, significant enrichment in GC-rich amino acids among highly expressed genes has been demonstrated for individual bacterial taxa, includ-ingProchlorococcus [38,39]. GC richness in expressed genes is potentially driven by a combination of factors, including selection against metabolically costly amino acids (for example, AT-enriched phenylalanine and tyro-sine) [40], or selection against AT-richness in highly expressed genes. Alternatively, this pattern may stem from an overall enhanced conservation level in highly expressed genes [12]. Assuming an underlying GC-to-AT mutational bias, which may be a universal trend in bacteria [41,42], selectively constrained genes are pre-dicted to retain a GC-rich signature relative to less-con-strained genes. Therefore, the proportional increase in GC-enriched amino acids in expressed genes compared to non-expressed genes in this study is consistent with our observation of enhanced sequence conservation in the expressed community gene pool, and confirms a fundamental distinction in amino acid usage related to gene expression level.
Conclusions
Microbial metagenomes and metatranscriptomes are amalgams of thousands of taxonomically and function-ally diverse microorganisms, each of which experiences unique evolutionary pressures. Such complexity might be expected to preclude the detection of bulk evolution-ary signals in meta-omic data. Here, we show broad trends in protein coding sequence conservation that transcend variation in both taxonomic composition and habitat type.
Specifically, we confirm that the hypothesized positive relationship between gene expression level and sequence conservation, which has been well established for indivi-dual taxa under experimental conditions [11], is a uni-versal trend across diverse microbial communities in both marine and terrestrial environments. Detecting this trend required binning genes into broad categories
(expressed versus non-expressed) based on the detection of transcripts, which depended, in part, on the depth of sequencing per sample. Deeper sequencing would reveal a greater proportion of the expressed gene pool and potentially lead to more accurate measurements of expression level for low frequency genes [22,23]. How-ever, the tremendous taxonomic diversity inherent in microbial communities, as well as the temporal hetero-geneity of the environment in which these communities exist, likely confounds any attempt to predict protein conservation based on transcript abundance on a gene-by-gene basis using meta-omic data. Nonetheless, the broad discrepancy in sequence conservation between expressed and non-expressed gene fractions is signifi-cant, operates consistently across diverse taxa (Figure 4), and confirms that expression level is a primary determi-nant of evolutionary rate in naturally occurring microorganisms.
The mechanism linking evolutionary rates and expres-sion level is still debated. Sequence conservation in highly expressed proteins has been hypothesized to be driven by selection acting to minimize the costs of protein misfold-ing, which should increase in tandem with expression level (protein copy number per cell) [14], though the harmful effects of misfolding have been brought into
question [43]. This selection for‘translational robustness/
accuracy’is predicted to be largely decoupled from a
pro-tein’s functional importance [13,14,24]. Here, using
[image:15.595.55.540.101.190.2]mRNA abundance as a proxy for expression level, our results demonstrate broad commonalities in expressed gene content across communities in widely different habitats (ocean versus soil). These data indicate a trend toward genes of protein synthesis and energy metabolism in the more actively expressed gene fraction and toward genes of cell replication and growth in the less expressed fraction. Additionally, this finding, in the context of our results demonstrating enhanced sequence conservation among expressed genes, indirectly suggests that the expression-conservation relationship may partially be constrained by protein function. However, these data cannot be used to justify this conclusion, since both gene
Table 6 Counts and mean percentage identity of amino acid sequence clusters for four representative samples
Cluster countsa Mean percentage identityd
Sample Total Singleton DNA+RNAb DNA onlyc RNA onlyc DNA+RNA DNA only
OMZ 50 m 213,683 180,311 1804 26,505 5063 77.0 85.2
OMZ 200 m 257,388 209,564 2712 40,401 4711 79.4 83.7
HOT 75 m 353,573 297,850 5681 44,163 5879 80.3 82.9
HOT 500 m 500,413 425,524 4677 66,151 4061 73.7 79.7
Soil 1,277,816 1,046,744 29,980 141,158 59,934 72.6 87.5
a
CD-HIT clustering parameters: sequence identity 55% over local aligned region, with a length difference cutoff of 90%, and clustering to the most similar cluster (g = 1).b
Clusters containing both DNA- and RNA-derived sequences.c
Clusters containing only DNA- or RNA-derived sequences.d
expression level and functional importance may indepen-dently co-vary with protein evolution rates, as has been
demonstrated for isolates of Pseudomonas aeruginosa
[33]. Though characterizing the mechanism linking gene expression level and evolutionary rate is beyond the scope of this study, metatranscriptomic data may inform future studies exploring the relative effect of protein function on sequence conservation.
We show that the expressed gene set, compared to the non-expressed set, is more likely to contain genes that
belong to an orthologous core genome shared across closely related sister taxa. This pattern was broadly con-sistent across the marine samples and the soil sample. Interestingly, the overrepresentation of expressed genes within the core set was not observed in the HOT 500 m sample (Figure 4), which we hypothesize may be related to an overall decline of metabolic activity at deeper depths within the water column. Microbial transcrip-tomes can vary significantly in response to the growth phase of the organism [44-46]. In less actively growing
85.2% OMZ 50m 83.7% OMZ 200m 82.9% HOT 75m 79.7% HOT 500m DNA-only clusters
DNA-only clusters
DNA+RNA clusters 2.5 OMZ 50m
3.0 OMZ 50m 2.6 OMZ 200m
3.1 OMZ 200m 2.5 HOT 75m
3.0 HOT 75m 2.5 HOT 500m
3.3 HOT 500m
0
5
10
15
20
25
30
35
40
45
0
10
20
30
40
50
60
70
2.5 Soil
2.9 Soil
72.6% Soil
77.0% OMZ 50m 79.4% OMZ 200m 80.3% HOT 75m 73.7% HOT 500m DNA+RNA clusters
86.5% Soil
99 97 95 93 91 89 87 85 83 81
Mean %ID per cluster
2
3
4
5
6
7
8
9
10
Sequences per cluster
P
ercentage of total clusters
P
ercentage of total clusters
(a)
[image:16.595.65.537.89.546.2](b)
communities (for example, stationary phase), expression level might be more uniform across the genome (that is, background expression), with both core and non-core genes having a relatively equal probability of detection. In contrast, in actively growing communities, the
distribution of transcripts might become dominated by a subset of highly expressed genes (for example, genes mediating energy metabolism, membrane transport), as we have observed in other samples. If such genes fall within the core genome, core genome representation in the expressed gene set would be predicted to be greater in more active communities.
[image:17.595.56.291.111.283.2]Our datasets highlight similarities in gene expression and sequence evolution across very different microbial habitats, but differ markedly in other attributes. Notably, the soil community was a clear outlier with respect to functional gene content (Figures 6, 7, and 9) and amino acid usage (Figures 12 and 13), likely due to the distinct community composition of this habitat (Figure 4). How-ever, given our analysis of a single soil metatranscrip-tome, and the use of different RNA extraction kits for soil versus marine samples (see Materials and methods), we urge caution when comparing microbial community composition between soil and marine datasets. A more comprehensive comparison of taxonomy and functional gene expression would involve extended metatranscrip-tome sampling across multiple soil types (and locations), as well as optimization of RNA extraction protocols to ensure unbiased lysis of all microorganisms. Such an analysis was not the focus of this study. However, the inclusion of the soil sample confirmed a positive rela-tionship between expression level and sequence conser-vation at both the genome and community levels
Table 7 GC percentages (averaged over all reads) in open reading frames identified using Metagene
DNA reads RNA reads
Site Depth (m) Alla DNA onlyb DNA+RNAc Alla
OMZ 50 37.6 38.2 36.0 42.8
85 38.2 38.4 36.7 44.9
110 41.1 42.6 38.1 42.8
200 40.9 41.9 38.6 45.6
BATS 216 20 34.5 35.4 33.8 42.8
50 35.2 36.4 33.9 40.3
100 33.7 34.7 32.9 37.8
HOT 186 25 35.5 36.0 34.8 44.0
75 34.9 35.2 34.4 41.4
110 36.0 36.4 35.0 40.0
500 43.2 43.1 43.5 50.6
Soil Surface 62.7 63.1 62.5 62.6
a
All reads identified as‘protein-coding’via significant BLASTX matches to NCBI-nr (bit-score > 50), with GC content then estimated for Metagene-called open reading frames within this read set.b
Reads matching genes detected only in the DNA data.cReads matching genes detected in both the DNA and RNA data. BATS, Bermuda Atlantic Time Series; BLAST, Basic Local Alignment Search Tool; GC, guanine-cytosine; HOT, Hawaii Ocean Time Series; HSP, high-scoring segment pair; NCBI-nr, National Center for Biotechnology Information non-redundant protein database; OMZ, oxygen minimum zone.
Table 8 Proportional changeain amino acid usage in RNA datasets compared to DNA datasets
Amino acid OMZ BATS 216 HOTS 186
GCb 50 m 85 m 110 m 200 m 20 m 50 m 100 m 25 m 75 m 110 m 500 m Soil
Ala 0.83 31.5 30.2 21.8 20.1 35.5 27.6 28.0 45.4 44.2 26.2 26.8 5.5
Gly 0.83 26.8 24.7 17.8 16.4 18.7 16.1 16.7 19.0 23.4 14.4 -10.2 0.0
Pro 0.83 11.0 11.7 3.3 7.4 13.1 6.6 8.7 10.1 2.4 4.0 6.8 5.1
Arg 0.72 -3.3 -3.2 -11.7 1.8 23.2 14.2 9.7 11.9 0.9 4.1 -6.7 1.3
Trp 0.67 34.0 49.5 27.0 21.2 12.2 9.2 11.9 18.2 25.7 17.1 -9.3 16.3
Cys 0.50 -0.5 -5.1 -6.9 2.1 -2.6 -6.6 -9.5 -10.3 -8.9 -11.8 17.5 3.9
Asp 0.50 3.3 5.6 0.9 8.0 3.0 -0.8 -0.2 -0.1 0.4 -2.0 -2.9 -3.6
Glu 0.50 -7.0 -11.1 -2.4 2.8 0.7 -1.2 -1.0 -6.6 -8.9 -5.6 -21.7 -9.0
His 0.50 -4.1 -5.4 -7.8 -0.6 4.1 -1.4 -3.4 9.7 0.9 -4.5 -28.3 2.9
Gln 0.50 -1.3 1.3 -2.9 2.5 9.3 6.4 6.8 9.3 3.8 4.2 -10.8 -2.7
Ser 0.50 -5.4 -2.8 -3.4 -2.9 -8.5 -7.4 -5.2 -7.6 -6.3 -2.0 6.4 4.1
Thr 0.50 14.9 17.8 11.3 7.5 7.9 10.0 10.7 14.2 14.6 9.8 -17.4 1.3
Val 0.50 17.7 18.8 12.2 11.5 16.0 15.0 13.2 18.1 20.2 11.4 7.5 -4.1
Leu 0.39 -9.7 -11.0 -10.4 -8.1 -6.6 -6.7 -5.3 -7.2 -6.9 -2.2 7.8 4.4
Met 0.33 14.2 20.0 7.6 6.6 13.0 14.5 6.1 17.5 20.3 5.3 -0.5 -1.6
Phe 0.17 -10.5 -9.1 -6.9 -10.2 -15.9 -11.3 -9.6 -8.4 -5.8 -1.6 -3.6 4.3
Lys 0.17 -22.3 -28.6 -9.5 -17.8 -13.7 -8.4 -6.6 -25.1 -23.4 -11.5 15.9 -26.3
Asn 0.17 -23.6 -20.5 -14.8 -18.0 -25.1 -20.2 -19.2 -24.9 -23.0 -17.4 13.6 0.9
Tyr 0.17 -8.4 -6.7 -5.3 -4.8 -15.2 -9.3 -11.0 -1.9 -5.6 -7.7 25.7 5.4
Ile 0.11 -19.3 -21.8 -11.8 -18.2 -22.5 -18.2 -18.5 -23.0 -20.6 -17.5 -3.7 0.4
a
((Proportion in RNA) - (Proportion in DNA))/(Proportion in DNA) × 100.b
[image:17.595.56.539.443.713.2]% Of total changes (increase or decrease)
% Of total changes (increase or decrease)
DNA versus RNA reads
(a)
(b)
0 5 10 15 20 25 30 35 40 45
0.11 0.17 0.33 0.39 0.5 0.67 0.72 0.83
0 5 10 15 20 25 30 35 40 45
0.11 0.17 0.33 0.39 0.5 0.67 0.72 0.83 Amino acid GC content
Amino acid GC content
DNA reads - expressed versus non-expressed genes
Increase
[image:18.595.61.537.87.625.2]Decrease
(Figures 3 and 4), as well as an overrepresentation of core genes within the highly expressed gene set (Figure 4). Though it is possible that such patterns may not be observed in other sample types, or following dif-ferent extraction protocols, our results provide strong evidence for universal features of protein-coding gene evolution in natural microbial communities.
The composition of metatranscriptomic and metage-nomic sequence datasets depends not only on intrinsic biological factors (for example, community composition, metabolic state) but also on the physical and chemical environment at the time of sampling. Furthermore, interpretation of the resulting data can vary based on the analytical method (for example, database-dependent versus -independent analyses, as shown here) and on the availability and biases of the reference sequences to which the data are compared. Here, we attempt to rule out potential database artifacts by analyses at both the community and genome level. In so doing, our results
suggest that environmental meta-omic datasets, despite their inherent complexity, can inform theoretical evolu-tionary predictions and reveal universal trends across ecologically and phylogenetically diverse microbial communities.
Materials and methods
We examined protein-coding sequences in coupled microbial metagenomes and metatranscriptomes from multiple depths at three distinct oceanographic sites and from surface soil in a temperate forest (Table 1). Ocean datasets (excluding the HOT 110 m RNA sample, which was sequenced in this study) were generated in prior stu-dies using the Roche 454 Genome Sequencer with FLX series chemistry and extracted from public databases (see Table 1 for accession numbers). Sequences from the soil sample were generated in this study (detailed below) and are available in the NCBI Sequence Read Archive under accession [SRA028811].
Soil
Soil
OMZ 50m OMZ 85m BATS 20m BATS 100m HOT 25m HOT 75m BATS 50m HOT 110m HOT 500m OMZ 110m OMZ 200m
BATS 20m BATS 50m BATS 100m HOT 110m OMZ 50m OMZ 110m OMZ 200m OMZ 85m HOT 25m HOT 75m HOT 500m
Pearson correlation
[image:19.595.58.541.88.458.2]0.84 0.88 0.92 0.96 1.0 0.80
trp 0.67 gly 0.83
val 0.50
thr 0.50
met 0.33
pro 0.83 asp 0.50
cys 0.50 ala 0.83
his 0.50 gln 0.50
arg 0.72
tyr 0.17
ser 0.50 phe 0.17 glu 0.50
leu 0.39 lys 0.17
ile 0.11
asn 0.17
OMZ 110m OMZ 200m OMZ 50m OMZ 85m HO
TS 500m
BA
TS 20m
BA
TS 50m
BA
TS 100m
HO
TS 25m
HO
TS 75m
HO
TS 110m
Soil
P
earson correlation
1.0 0.3
0.4
0.5
0.6
0.7
0.8
[image:20.595.57.540.82.641.2]0.9
Soil sample collection and DNA/RNA isolation
Soil was collected from within a transition hardwood-white pine/hemlock forest in the Prospect Hill Tract of Harvard Forest (Massachusetts, USA; 42.54 N 72.18 W; elevation, 385 m) on 27 September 2010. Two cores were taken from 1 to 10 cm below the leaf horizon using a 10 mm diameter soil corer. These cores were homogenized, placed into 50 ml Falcon tubes, flash fro-zen in liquid nitrogen, and transported to the lab on dry ice. Visible pieces of plant material were removed from soil subsamples with sterile forceps. During plant removal, the subsamples were placed on a sterile sur-face, laid within a bed of dry ice. Total microbial DNA and RNA were then extracted from these subsamples using PowerSoil Total RNA and DNA isolation kits (MoBio, Carlsbad, CA, USA), according to the
manufac-turer’s protocol. This extraction protocol differs from
the method used to generate the marine datasets, which
employed themirVana™miRNA Isolation kit (Ambion,
Austin, TX, USA) for RNA isolation [17,19,23,35]. It is possible that these kits may lyse different microbial taxa at varying efficiencies. As this possibility has not been assessed, we urge caution when comparing the composi-tions of soil and marine communities based on meta-transcriptome data, though this was not the focus of our study. Total DNA was quantified and used directly for pyrosequencing. Total RNA was further processed, as described below.
rRNA subtraction, RNA amplification and cDNA synthesis Total RNA was amplified and prepared for pyrosequencing using established protocols. Briefly, the proportion of ribo-somal RNA transcripts (bacterial and archaeal 16S and 23S rRNA and eukaryotic 18S and 28S rRNA) in total soil RNA was reduced via a published subtractive hybridization pro-tocol using sample-specific rRNA probes [23]. Following rRNA subtraction, total RNA was amplified as described
previously using a modification of the MessageAmp™
II-Bacteria kit (Ambion) [17,19]. Briefly, total RNA was polya-denylated and converted to double-stranded cDNA via
reverse transcription. cDNA was then transcribedin vitro
(37°C, 12 to 14 h) to produce microgram quantities of sin-gle-stranded antisense RNA. The amplified products
(approximately 5 to 10μg aliquot) were converted back to
double-stranded cDNA using the SuperScript®III
First-Strand Synthesis System (Invitrogen, Carlsbad, CA, USA) for first-strand synthesis (random hexamer priming), and
the SuperScript™Double-Stranded cDNA synthesis kit
(Invitrogen) for second-strand synthesis. cDNA was then purified (QIAquick PCR purification kit, Qiagen, Valencia, CA, USA), digested with BpmI (37°C, 3 h) to remove poly (A) tails, and used directly for pyrosequencing.
Pyrosequencing
Soil DNA and cDNA were purified for sequencing via
the Agencourt®AMPure® kit (Beckman Coulter
Geno-mics, Danvers, MA, USA) and used for the generation
20 30 40 14 18 22 26 5 10 15 20 0 5 10 15 6 12 18 10 14 18 10 30 50
Proportional change in amino acid frequency (DNA to RNA)
ala gly met pro thr val trp
50 85 110 200
20 50 100
25 75 110 500 OMZ
BATS
HOTS
[image:21.595.58.537.88.315.2](m)
of single-stranded DNA libraries and emulsion PCR according to established protocols (454 Life Sciences, Roche, Branford, CT, USA). Clonally amplified library fragments were sequenced with full plate runs on a Roche Genome Sequencer FLX instrument using Tita-nium chemistry. Pyrosequencing datasets generated dur-ing this study have been deposited in the NCBI Sequence Read Archive under accession numbers listed in Table 1.
Data analysis
Homology searches
Pyrosequencing reads matching ribosomal RNA genes were identified in cDNA and DNA datasets by BLASTN searches against a custom database of pro-karyotic and eupro-karyotic small and large subunit rRNA sequences (5S, 16S, 18S, 23S and 28S rRNA) taken from microbial genomes and the ARB SILVA LSU and SSU databases [47]. Reads matching rRNA with bit scores >50 were identified and removed from further analysis. Replicate sequences sharing 100% nucleotide similarity and length, which may represent artifacts generated by the pyrosequencing protocol [23,48], were identified among non-rRNA sequences using the open-source program CD-HIT [49] and removed from each dataset. Non-replicate, non-rRNA sequences were characterized by BLASTX searches against NCBI-nr, KEGG, and assembled protein sequences taken from the GOS database. Protein-coding sequences were identified as the top reference (database) gene(s) matching each read above a bit score of 50. When reads matched multiple genes with equal bit score, each matching gene was considered a top hit, with its representation scaled proportionate to the number of genes sharing the same bit score.
Amino acid identities, relative taxon abundance, and expression ratio
Local amino acid identities were recovered from within the top HSP for each sequence having a significant match (bit score >50) to a reference gene in the nr data-base; gaps were not included in identity calculations. Identities of multiple reads matching the same reference gene were averaged to obtain per gene identities, and these values were then averaged across all reference genes per dataset. Relative taxon abundance per sample was determined as the number of sequence reads matching the same reference taxon as a top hit in BLASTX searches of NCBI-nr. The relative transcrip-tional activity (expression level) per expressed gene was normalized to account for variations in gene abundance in the DNA pool, as calculated by the expression ratio: (RNA reads per gene/Total RNA reads matching NCBI-nr)/(DNA reads per gene/Total DNA reads matching NCBI-nr)
Core genome
The proportional representation of expressed and non-expressed genes in the orthologous gene set shared between taxa was determined separately for the top five most abundant organisms in each of the samples. The
core genome ofProchlorococcussp., which was common
in our samples, was defined as those genes present
across all 12 of the sequenced Prochlorococcus strains,
based on the analysis of [50]. For all other taxa, a core gene set was more broadly defined by reciprocal BLASTP searches against a closely related sister taxon (bit score cutoff = 50). Sister taxa used for core genome identification, and the number of genes shared between taxa, are listed in Table 5.
Hierarchical clustering
Average-linkage clustering was performed in Cluster 3.0 using Pearson coefficients (centered) derived from pair-wise correlations of KEGG functional category abun-dances (Figures 6 and 9), amino acid proportions (Figure 12), or proportional changes in amino acid usage (Figure 13). KEGG category clustering was based on expressed and non-expressed gene sets within the DNA data only, as defined in the main text based on matches to nr reference proteins. Abundance per KEGG category was calculated as the total number of reads per category as a proportion of total reads matching the KEGG hierarchy at either the category (Figure 8) or pathway level (Figure 9).
Database-independent cluster analysis
Sequence divergence was determined for clusters of related sequences within pooled DNA + RNA datasets. To avoid spurious clustering of non-coding regions (for exam-ple, small RNAs (sRNAs)), amino acid sequences present in the DNA and RNA reads (those with significant
matches to the nr database) were identified using theab