Biological interaction networks have been the main focus of systems biology in recent years. These interactions form a spectrum of biological networks, including protein-protein interaction (PPI), transcription factor-target regu-lation, genetic interaction and metabolic networks. Each of these networks provides insight into different intra-cellular communication systems, from gene and post-translational regulation (transcription factor-target and kinase-substrate phosphorylation networks, respect ively) to physical interactions between proteins (PPI net works). Given their importance, studies have attempted to characterize the global evolutionary mechanisms that shape network architectures, which would help to under-stand the network design principles and evolu tionary forces that ultimately determine the network of a species. Such studies are possible as a result of the development of methods such as the yeast-two hybrid system [1,2], tandem affinity purification followed by mass spectro-metry [3,4], and chromatin immuno precipitation followed by either microarray chip (ChIP-chip) [5] or high-throughput sequencing (ChIP-seq) [6,7], which can rapidly interrogate the interaction network of a given species, leading to a dramatic increase in biological inter-action data for several species. Large, but yet incomplete, networks for Homo sapiens [1,2,8] and model eukaryotic organisms such as Saccharomyces cerevisiae [3-5,9-13],
Caenorhabditis elegans [6,14,15] and Drosophila melano-gaster [7,16-20]are available in many multispecies data repositories [21-24].
We review recent progress in the study of biological network evolution, with a particular focus on the PPI network, because this has been studied in more depth (other networks, such as the transcription factor-target network, are also available to varying degrees of comple-tion). While networks have been examined in the past using computational simulations [25,26], here we focus on studies based on experimental data primarily from high-throughput methods. The shift to using experi-mental data has enabled observation of different proper-ties of network evolution. For instance, early studies suggested that certain interactions tend to be conserved, and this finding was used to transfer anno tation knowledge and identify important cellular pathways between different species. We also discuss network hubs and motifs, which are conserved elements whose members are more likely to maintain the same functionality between species. Conversely, networks are evolutionarily very dynamic. We explore divergent network elements, such as how networks change over time between species (a phenomenon known as network rewiring). We review the different rates at which interaction networks, such as PPI and transcription factor-target networks, rewire, and explore why regulatory networks rewire at a more rapid rate than PPI networks. Finally, we look at methods to estimate the rate of network rewiring, given that different types of interaction networks have been elucidated to different degrees of completeness.
Building blocks of network evolution
To understand and discover global network properties either between different species or between different types of networks, such as transcription factor-target and PPI networks, the basic building blocks of network evolution need to be characterized. Using the analogy of a multiple sequence alignment, one can distinguish between conserved and divergent regions, both of which are important features for sequence evolution. There are many important conserved elements, such as protein domains [27,28] and sequence motifs [29]. Conversely, evolutionary change is due to sequence differences that can be attributed to different mechanisms such as point mutations, insertions and deletions. The respective
Abstract
We are beginning to uncover common mechanisms leading to the evolution of biological networks. The driving force behind these advances is the increasing availability of comparative data in several species.
© 2010 BioMed Central Ltd
Evolution of biological interaction networks:
from models to real data
Mark GF Sun
1and Philip M Kim
1,2,3,4*
RE VIE W
*Correspondence: [email protected]
1Department of Computer Science, University of Toronto, 160 College St, Toronto, ON, Canada M5S 3E1
Full list of author information is available at the end of the article
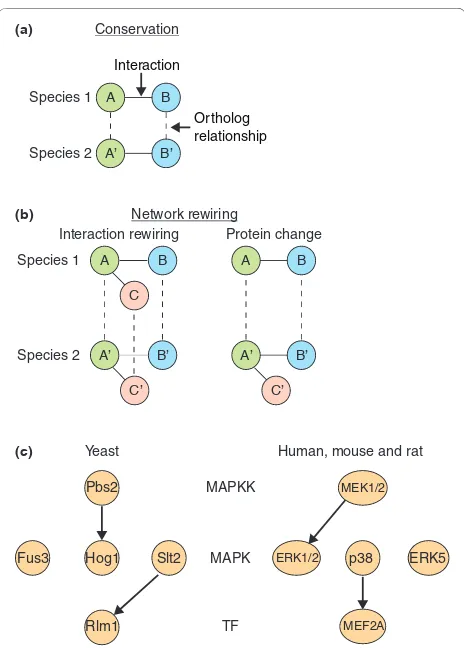
contribution of each mechanism can be quantified by measuring evolutionary rates. Similarly, in the com pari-son of biological networks between species, conserved and diverged elements can be found. Using the PPI network as an example, comparing PPI networks of different species reveals two types of conserved elements. First, conserved proteins can be found between PPI networks (that is, proteins in different species that share the same ancestral gene, whose identification can be made through orthology measures) [30-32]. Second, inter actions between orthologous protein pairs can be conserved; this conservation type is known as an ‘interolog’ for PPI networks [33,34] and a ‘regulog’ for transcription factor-target regulation networks (Figure 1a) [35]. Determining conserved interactions such as intero-logs has identified interactions in core processes, such as metabolism, and has enabled the prediction and know-ledge transfer of conserved interactions between species [34]. While PPI networks are typically depicted as un-directed graphs (shown in Figure 1a, with interactions lacking directionality), PPI networks such as those between domain-peptide interactions and regulatory networks, such as transcription factor-target and kinase-phosphorylation networks, are shown as directed graphs due to the asymmetry between interaction partners designated as source and target proteins. Differences between biological networks from different species can be attributed to network rewiring events, which are the changes in wiring or interaction between interaction partners. Two mechanisms of network rewiring exist: (1) ‘interaction rewiring’, which is the gain or loss of an interaction but retention of both binding partners; and (2) ‘protein change’, which is the gain (typically by gene duplication) or loss of either binding partner (Figure 1b). Such network rewiring mechanisms have helped to rationalize the evolution of pathways such as in the mitogen-activated protein kinase (MAPK) pathway in the comparison between S. cerevisiae and higher eukaryote interaction networks. It was shown that despite MAPKs being highly conserved, changes in interaction partners can occur. In yeast, Pbs2 activates Hog1, and Slt2 activates Rlm1. In humans (and other higher eukaryotes) these interactions rewire and MEK1/2 (the Pbs2 ortho-log) activates extracellular signal-regulated kinase 1/2 (ERK1/2; ortholog of Fus3), and p38α (the Hog1 ortho-log) activates myocyte-specific enhancer factor 2A (MEF2A; the Rlm1 ortholog) (Figure 1c) [36]. Interaction rewiring can arise due to mutations causing structural changes to either a binding partner’s interaction site, abolishing the existing interaction, or creating new surfaces to which a new interaction partner can bind. This can be demonstrated by performing point mutations to proteins maintaining multiple interaction partners on different interaction surfaces, thereby abolishing a single
[image:2.612.314.546.86.410.2]interaction surface and giving rise to different phenotypes [37]. For domains that recognize linear peptide motifs, mutations in this binding motif are more likely to occur due to its small length and their relatively high evolu-tionary variability.
Figure 1. Mechanisms of network evolution. Continuous lines represent an interaction and dashed lines represent orthologous relationships. (a) A conserved interaction between two species requires both interaction partners to be conserved by having identifiable orthologs. (b) Two mechanisms of network rewiring can be defined: interaction rewiring and protein change. Interaction rewiring is the gain or loss of an interaction but retention of both binding partners. Using species 1 as the reference, the illustrated interaction rewiring event in species 2 is an interaction loss between A’ and B’, shown by the gray line. Swapping the reference species results in an interaction gain between A and B. Protein change is the gain or loss of at least one of the binding partners. Using species 1 as the reference, the illustrated protein change is a protein gain of C’. The lack of an ortholog in species 1 indicates that C’ is specific to species 2. (c) Specificity swapping in the mitogen-activated protein kinase (MAPK) pathway in the comparison between Saccharomyces cerevisiae and higher eukaryote interaction networks (adapted from Mody et al. [36]). The yeast Pbs2 activates Hog1, and Slt2 activates Rlm1, while in humans (and other higher eukaryotes) these interactions rewire and MEK1/2 (the Pbs2 ortholog) activates extracellular signal-regulated kinase 1/2 (ERK1/2; ortholog of Fus3), and p38α (the Hog1 ortholog) activates myocyte-specific enhancer factor 2A (MEF2A; the Rlm1 ortholog). MAPKK, MAPK kinase; TF, transcription factor.
Species 1
Species 2
Interaction
Ortholog relationship (a) Conservation
A
A’ B
B’ Species 1
Species 2
(b)
A
A’
Interaction rewiring Protein change Network rewiring
(c) Yeast
Pbs2
Hog1
Fus3 Slt2
Rlm1
Human, mouse and rat
p38
ERK1/2 ERK5
MEF2A MAPKK
MAPK
TF C’ C’
C
MEK1/2
B
B’ A
A’
B
Models of network evolution
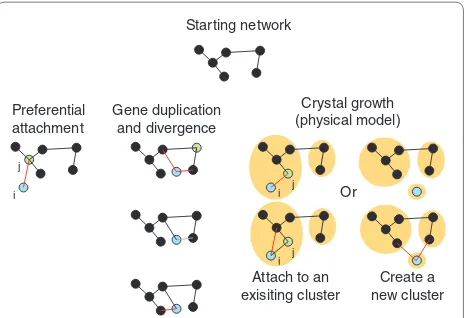
Similar to the history of molecular evolution, interest in network evolution began before the availability of sufficient high-throughput data for empirical study. Thus, early studies focused on top-down models of network evolution, and attempted to recapitulate global features of these experimentally determined networks by focusing on their topological properties. Biological networks maintain interesting topological properties, such as a scale-free topology (where only a few proteins or meta-bolic substrates maintain a high number of interacting partners), hierarchical modularity (a scale-free network composed of modular components) and degree-dissorta-tivity (the tendency of hub proteins to connect with non-hub proteins in PPI networks) [38-40]. To explore evolu-tionary mechanisms responsible for developing current biological networks, various models have been proposed to describe these observed network properties, thereby proposing how different network architectures and topologies are formed. Each of these models provides a unique perspective on network evolution and can be grouped by how the network is grown; they include (1) preferential attachment, (2) gene duplication and diver gence (DD), and (3) physical constraint models (for example, the crystal growth model).
Each of these models simulates network growth by iteratively adding nodes and interactions to the existing network in a specific fashion. The preferential attachment model only attempts to explain the observed scale-free topology within biological networks [38,39]. In this model, new proteins (nodes) are incrementally added to the network by connecting a new node (i) to an existing network node (j) with a probability proportional to the number of interactions the existing node (j) participates in (Figure 2). Therefore, new nodes are more likely to connect to existing nodes participating in a large number of interactions [41]. However, such a model fails to provide insight into the biological mechanisms giving rise to networks with the observed topologies. To provide a more biological model, gene duplication has been suggested as a means by which additional genetic material can be created to evolve and expand PPI net-works, giving rise to gene DD models [42]. It has been further observed that duplicated genes rapidly diverge, sharing only a subset of their interaction partners [43]. Taking these considerations into account, DD models expand the network iteratively by first randomly selecting a node within the network, then duplicating it along with all its interactions. Rewiring events are subsequently applied to the duplicated node, whereby some duplicated interactions are lost and new interactions involving the duplicated node are made (Figure 2). Such a case can be found in the functional history of the TFIID/SAS protein complexes in the yeast clade. After gene duplication of
the ancestral Taf14/Sas5 gene into Taf14 and Sas5, a specialization event occurred that resulted in the modulari zation of the original TFIID/SAS complex into distinct TFIID and SAS complexes of which Taf14 and Sas5 are members, respectively. Thus, Taf14 and Sas5 each retain some of the interactions of the ancestral gene, but lose some others [44]. Despite its simplicity, DD models can recapitulate the scale-free network topology by implicitly incorporating the preferential attachment rules [45-48]. This can be realized by noting that nodes with many interaction partners will likely have one of its partners chosen for duplication.
[image:3.612.315.548.89.248.2]Instead of focusing on topological rules such as prefer-ential attachment to generate networks with a desired network topology, other studies have focused on physical attributes or constraints that may guide network evolu tion. One of the first constraints developed was the notion that intrinsic protein fitness influences the growth of new nodes (that is, proteins that are more important to the cell gradually acquire more interactions). Such a method is capable of realizing scale-free networks; however, it only considers protein change, which is only one of the possible network rewiring mechanisms [49]. To capture additional topological attributes found in biological networks, a crystal growth model has been proposed [50], whereby network growth is governed by the availability of unoccupied protein interaction surface. In this model, new nodes are added to an existing cluster of nodes or used to start a new cluster upon which interactions to other nodes
Figure 2. Models of biological network evolution. Network evolution models can be grouped into three categories depending on how the models ‘grow’ the network. The green, blue and black nodes represent a selected node in the network, a new node added to the network, and the rest of the network, respectively. Red, gray and black lines represent gained, lost and unchanged interactions, respectively. Orange circles are different clusters, a parameter specific for the crystal growth model. From the starting network, the evolutionary models expand the network in different ways. The steps each model makes can be followed by reading the figure from top to bottom.
Preferential
attachment Gene duplicationand divergence
Crystal growth (physical model)
i j
i j
Starting network
Or
i j
Attach to an
are made based on the availability of unoccupied interaction surface area. If the new node (i) is added to an existing cluster, a two-step extension process is per-formed: (1) selecting a cluster member, node j, based on the available unoccupied inter action surface area; and (2) adding neighbors of node j randomly as interaction partners to the new node i (Figure 2). Interestingly, this physical constraint approach creates networks that not only have scale-free topology, but also hierarchic modularity and degree-dissortativity, properties found in experimentally derived PPI networks [50].
To comprehensively describe the evolutionary events giving rise to the network architectures we observe today, knowledge about the ancestral networks are required. While ancestral network reconstruction methods exist, they require the complete interaction networks [51]. Since complete interaction networks are currently un available, the validity of different evolutionary models is evaluated by their ability to recapitulate known topo logical network properties, thereby demonstrating that these models provide insight into the origins and putative mechanisms giving rise to the organization of present day networks. By these metrics, the crystal growth model is likely to capture the underlying principals resulting in different network architectures. Interestingly, the models presented here all randomly grow the network while capturing many network topological features without including any explicit selective pressure, suggesting a stochastic component is responsible for network evolu tion. Additionally, current models of network evolution only grow the interaction network. Once the nodes and interactions are created, they remain unaltered for the duration of the simulation. Future models should not only consider network growth but also network rewiring events to nodes other than the newly created node, thereby incorporating a larger number of observed network mechanisms.
Conserved network elements
Conserved network elements such as protein orthologs and interologs were some of the first features discovered in networks. These conserved elements can be considered analogous to conserved motifs or domains in protein sequences. Focusing on proteins, or conserved inter-actions between proteins and their binding partners, led to the discovery of several features that are evolutionarily conserved [33,52,53].
Conservation of hub proteins
The basic feature of a network is a highly connected protein. In biological networks with scale-free topology, such proteins, known as hubs, are of special importance [38]. Fraser and colleagues [52] found these hub proteins to be more conserved at the sequence level. This finding was initially considered contentious due to arguments of
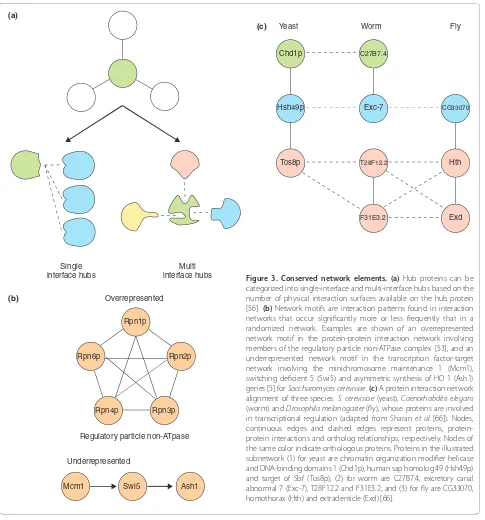
dataset biases [54] and confounding variables such as gene expression levels, which appeared to be a better predictor of protein evolutionary rate [55]. Ultimately, this was resolved by distinguishing between hub types by the number of interaction interfaces available on their surface. This demonstrated that multi-interface hubs but not single-interface hubs (Figure 3a) are more evolu tion-arily conserved compared with other proteins. Interest-ingly, multi-interface hubs were further shown to be more essential and more likely to be members of stable complexes than single-interface hubs. The actin-related protein 2 (Arp2p) protein is an example of a multi-inter-face hub and is part of the seven-member Arp2/3 complex, which is highly conserved across eukaryotes and is responsible for initiation of new actin filaments [56,57]. An example of a single-interface hub is the sucrose non-fermenting 1 (Snf1p) protein kinase, whose complex is important for yeast to grow in carbon sources other than glucose, rendering Snf1 null mutants viable in the presence of glucose [56,58]. This structural pers pec-tive provided a simple explanation for the previously observed date (single-interface) and party (multi-inter-face) hubs, whose interaction partners were expressed at different and at concurrent times, respectively [56,59].
Network motifs, conserved interaction patterns
The binary classification between hub and non-hub proteins only considers the total number of interactions in which a protein participates. The network motif is used to help describe interaction patterns among multiple proteins; where a network motif is an interaction pattern within an interaction network that occurs significantly more or less frequently than in a randomized network (Figure 3b). Network motifs are analogous to sequence motifs. They were first found in the Escherichia coli and S. cerevisiae transcription regulation networks and their discovery helped uncover local network sub-structures, such as feed-forward loops, highlighting a preference for specific protein arrangement within these regulation networks [60]. A subsequent study by Wuchty et al. [53] asked whether proteins participating within a network motif were more conserved. Using the presence of an ortholog in the comparison species to determine protein conservation, they found that proteins that are members of larger and more interconnected motifs are more likely to be conserved than proteins that are not. This is most probably because highly interconnected motifs tend to be protein complexes, whereby the inter action partners place evolutionary constraints on each other.
Network comparisons
conserved proteins are likely to maintain the same func-tionality. Thus, in a given species interaction network, functional knowledge about an interaction can likely be transferred to another species if both interaction partners are identifiable as orthologs. The additional constraint of an interaction further increases the likelihood that the conserved proteins maintain the same functionality across different species [61]. Hence, we can transfer an interaction by identifying its so-called interolog of the
queried interaction in a PPI network or the regulog in the transcription factor-target regulation network [33,35]. Taking this a step further, we can identify conserved pathways between species using network alignments. Similar to sequence alignments, network alignments must account for gaps and mismatches corresponding to the loss or gain of a protein and dissimilar proteins, respect-ively, in the alignment [62-65]. In this manner, it is possible to assign functionality by transferring knowledge (a)
Single
interface hubs interface hubsMulti
(b) Overrepresented
Underrepresented Rpn1p
Rpn2p
Rpn3p Rpn4p
Rpn6p
Mcm1 Swi5 Ash1
Regulatory particle non-ATpase
(c) Yeast Worm Fly
Chd1p
Hsh49p
Tos8p
C27B7.4
Exc-7
T28F12.2
F31E3.2
CG33070
Hth
[image:5.612.67.552.87.607.2]Exd
to conserved protein groups across species or to make interaction predictions based on sequence similarity and the concurrence of interaction partners. Using the protein interaction networks of three species, S. cerevisiae, C. elegans and D. melanogaster, interactions can be predicted with relatively high accuracy, resulting in a 40% to 52% success rate upon experimental validation. In this manner Sharan et al. [66] could predict and experi ment-ally validate the interaction between the non-ATPase subunit 2 (Nas2p) and the regulatory particle triphos-phatase 4 (Rpt4p) proteins in S. cerevisiae. One-to-many orthology relationships and lost or gained interactions add to the complexity of aligning conserved protein groups that modern approaches have overcome. For an example of a network alignment of the S. cerevisiae, C. elegans and D. melanogaster protein interaction net-works, see Figure 3c [66].
Divergent network elements
To observe evolutionary change, one has to look beyond conserved elements and examine divergent network features. The increase in the number and completeness of biological networks has now enabled researchers to study the differences between biological networks of species in more detail, highlighting the heterogeneous nature of interaction networks within the cell [67-69]. However, network incompleteness remains a concern - either false negatives or interactions that were never queried may lead to erroneous conclusions about changes between networks in two species. To study global properties of diverged interactions while minimizing the effect of varying network coverage for different species, early network rewiring studies used the interaction network of a single species to derive changing rates of interaction by comparing paralogs, which are proteins derived from genes that are related by a gene duplication event. This strategy has been used in experimental studies to characterize the functional divergence of transcription factors. Therefore, such studies can perform the same assay for different paralogous genes within the same species, thereby facilitating the ability to compare the elucidated interactions directly [70,71]. Generating more complete biological networks can be attained by compu-tational methods using experimentally determined binding specificity maps. However, these computational methods are currently restricted to proteins with domains that bind linear motifs such as SH3, kinase and transcription-factor domains [68,72,73]. Experimental identification of all interaction partners for the same protein orthologs across multiple species has been per-formed, but only for few proteins, such as the Ste12p and Tec1p transcription factors in three closely related yeast species [68], and the CEBPA and HNF4A transcription factors across five and three vertebrates, respectively
(both sets include human and mouse) [74]. Such work provides a high resolution network, enabling one to delineate the evolutionary mechanisms contributing to the formation of the network. Future technologies capable of interrogating the interaction network in a high-throughput manner for multiple species will enable more compre hen-sive and reliable network characterization across species.
Determining the network rewiring rates for interaction networks enables one to select appropriate species based on their divergence distance when performing com para-tive network analyses. For example, a recent evolutionary study showed that the kinase-substrate phosphorylation and PPI networks rewired at different rates in S. cerevisiae and H. sapiens (who shared a common ancestor 1 billion years ago) [75], the former at 2.2 × 10⁻⁵ interaction
changes per protein pair per million years and the latter at 1.1 × 10⁻⁶ interaction changes per protein pair per
million years [69]. When they considered only network rewiring events involving the loss of an interaction using S. cerevisiae as the reference, 100% (0/4,068) and 98.5% (30,247/30,695) of the kinase-substrate phosphorylation and PPI networks were lost, respectively [69], indicating that the use of highly divergent species for global system comparisons is likely to be inappropriate, especially for kinase-substrate phosphorylation networks.
Neutral changes play an important role in molecular evolution. Kimura’s neutral theory of molecular evolution postulates that most genomic mutations are neutral and do not affect the fitness of an organism [76]. In network evolution, changes to neutral interactions can be thought of in a similar way. Neutral interactions are non-func-tional interactions within a network and their existence can provide an explanation for the poor interaction conservation found across species [77]. Such neutral interactions and their associated network rewirings are especially thought to be common in kinase-substrate interactions, suggesting that only a fraction of kinase-substrate interactions are functional [67,78]. Likewise, spurious DNA-binding sites found in recent transcrip-tion-factor-binding studies with no apparent functional role are also likely to evolve in an unconstrained manner [79], resulting in an apparent rate of network rewiring faster than that found within the kinase-substrate interaction network [67]. This phenomenon is analogous to neutral changes in sequence evolution; these occur at a faster rate than negatively selected changes. Finding the rate of neutral interactions across different networks will help identify the extent to which these interactions shape networks and the evolutionary constraints they define com pared with those applied by selective pressures [77,80].
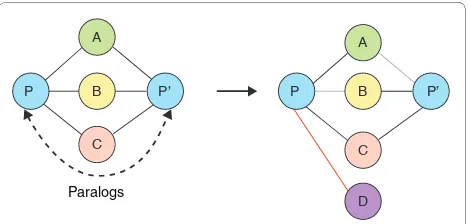
of their interaction networks. To mitigate the varying completeness across different species, early efforts focused on the network rewiring rates within the PPI network of a single species, such as that of S. cerevisiae. Under the assumption that new genomic content is created via gene duplication, then both protein paralogs will have the same interaction partners after the dupli-cation event. Therefore, any difference in interaction partners between the protein paralogs enables the identi-fi cation of network rewiring events (for example, changes in interaction partners) and hence estimation of the network rewiring rate within the PPI network (Figure 4). The divergence time between paralogous proteins can be estimated by triangulating the time of the gene duplica-tion event using different species as a reference. Initial estimates of the rate of acquiring new interactions were 3 × 10⁻⁶ interactions per protein pair per million years, equating to approximately 60 new interactions per million years for the yeast proteome. Rates of interaction loss were estimated to be significantly higher at 2.2 × 10⁻³ interactions per protein pair per million years, resulting in half of the interactions being lost after 300 million years [43]. Paralogs are likely to be under weaker purify-ing selection and more likely to diverge than non-duplicated genes [81]; therefore, this rate of interaction loss is expected to be an overestimate.
To obtain more accurate network rewiring rates, subse-quent studies utilized multiple species’ interaction maps of greater coverage [69,82], as the rates based on paralogs within the S. cerevisiae PPI network used only a small subset of the interactions [43]. Beltrao and Serrano [82] determined the interaction rewiring rate for the PPI networks for four species: S. cerevisiae, C. elegans,
D. melanogaster and H. sapiens. Because these species are highly divergent from each other (sharing a common ancestor over 1 billion years ago) [83], a direct com pari-son results in a small overlap between these PPI networks [84]. Since many of the PPI networks were elucidated using high-throughput methods with relatively high false-negative and false-positive rates, the observed small overlap is likely to be due to a combination of poor coverage and data quality [85]. In a similar vein to earlier work by Wagner [43], paralogs were used to estimate the network rewiring rates indirectly within the PPI network of each species by using a number of closely related species to establish orthology relationships to identify recently duplicated genes. Using this approach, the diver-gence time to a reference species was less than 100 million years and estimated that the network rewiring rate (including rates of both interaction gain and inter-action loss) was in the order of 1 × 10⁻⁵ interactions per protein pair per million years [82]; this is ten times faster than the rate found by Wagner [43]. The difference in the estimated rates shows the importance of selecting the
appropriate species when performing network compari-sons, because of the dependence between rates and divergence distance between the compared species.
Different biological networks change interaction partners at different rates
PPIs span a range of different interaction types from the binding of large globular domains [86] to the binding of domain-peptide-mediated interactions of SH3 domains [87]. Different types of interactions evolve at different rates, probably due to a number of biophysical differences in the protein interaction, such as the amount of protein surface participating in the interaction. Interactions between two globular proteins or between members of stable complexes often involve large interaction surface areas and tend to be conserved throughout evolution. This is mainly due to the large number of mutations needed to abolish this interaction [88]. Conversely, in the case of peptide mediated interactions, the interaction surface provided by the binding motif is small: between three and ten amino acids in length [29]. These short regions of interaction binding render it relatively dynamic, since a single or few mutations will abolish the interaction. Similarly, only a few mutations are required for the formation of a new binding site [89]. The rapid rate of binding site loss can be observed in the experi-mentally determined transcription factor-target binding sites of specific transcription factors [68,90-92] was highlighted in the comparison between yeast species, where up to 80% of the target binding sites are lost over about 300 million years of divergence [68,91]. However, using closely related species sharing a common ancestor 10 million years ago reveals that only 1% to 5% of the binding sites change [92,93]. Changes in specificity and target binding sites are not the only means by which interactions may diverge. Alternatively, changes to protein localization, expression timing and novel
inhibi-Figure 4. Estimating the rate of interaction rewiring using paralogs. Red, gray and black lines represent gained, lost and unchanged interactions, respectively. Immediately after gene duplication, the paralogs P and P’ will have the same interaction partners. Over the course of evolution, the paralogs will acquire and lose different interactions [43].
Paralogs
A
C
A
C
P P’ P B P’
[image:7.612.314.548.89.201.2]tors can also change interaction binding, either perma-nently or temporarily.
Different types of protein interactions have been associated with specific biological processes. For exam-ple, domain-peptide interactions are common in regula-tory networks, such as in cell signaling [87], transcription factor-target regulation and kinase-substrate phosphory-lation [89], which have been the focus of current studies. One would expect that these biological networks would rewire at a faster rate than the general PPI network, and this appears indeed to be the case [67,69]. Unfortunately, a direct comparison between network rewiring rates is difficult due to the different reference species used in the different studies. Owing to low coverage of current net-works, no authoritative answer can be given at this point as to the exact degree to which these biological networks differ in terms of network rewiring rates. Nevertheless, indirect methods can be applied to compare the network rewiring between multiple interaction networks from different reference species. Shou and colleagues [69] fitted a linear model to each biological network using different species as a reference, enabling them to extra-polate the rate of interaction rewiring to a predetermined divergence distance chosen to perform the comparison. Ordering the network rewiring rates for biological networks from the fastest to slowest after 800 million years of divergence, they found the following order: transcription factor-target > phosphorylation-substrate > genetic interactions ~ PPIs > metabolic pathway [69]. While the network rewiring rates for each biological net-work is likely to be underestimated due to the inability to observe multiple rewiring events since the last common ancestor, such a method is capable of elucidat ing the network ordering. It is tempting to speculate that this ordering suggests that regulatory networks of trans cription factor-target and phosphorylation-substrate net works rapidly reorganize to adapt to selective constraints while maintaining a core network that coordinates basic cellular functionality with regulatory inputs.
Conclusions and outlook
While theoretical models have driven initial advances in network evolution, ultimately, more comparative cross-species data are needed. Although technological advances have enabled early biological network comparisons, the availability and coverage of biological interaction network data remain as obstacles. The varying degrees of coverage between interaction networks of different species make it difficult to perform direct network comparisons. Several approaches have been developed to overcome this limita-tion, thus enabling network comparisons on a limited scale. Technologies permitting the elucidation of com-plete interaction networks for multiple species will allow the precise evolutionary mechanisms to be revealed.
Despite the current lack of complete interaction net-works, network alignment methods have been developed to compare the interaction networks of multiple species. Ultimately, such comparisons will lead to more sophis ti-cated evolutionary models that will enable the recon-struc tion of putative ancestral networks. Both conserved and divergent elements of biological network evolution have been identified, providing the raw material upon which evolution may act upon to form the observed biological interaction networks. Conserved network elements have provided insights into the essentiality of particular topological arrangements, such as the impor-tance of hub proteins for cell viability. Analyses into network rewiring have revealed a wide range of rewiring rates between different biological networks, providing the stepping stones for future network evolutionary models. Such models might enable identification of evolutionary events that are under selective pressure, analogous to models in molecular evolution. Ultimately, they will enable a mesoscale view of evolution and, as such, provide a link between molecular evolution and evolution at the whole organism level.
Abbreviations
DD, duplication and divergence; MAPK, mitogen-activated protein kinase; PPI, protein-protein interaction; Snf1, sucrose non-fermenting 1.
Competing interests
The authors declare that they have no competing interests.
Acknowledgements
The authors acknowledge support from the Natural Sciences and Engineering Research Council of Canada (NSERC); PMK received funding from an NSERC Discovery Grant (#386671) and MGS from a PGS Fellowship (PGSD3-410270-2011).
Author details
1Department of Computer Science, University of Toronto, 160 College St, Toronto, ON, Canada M5S 3E1. 2Department of Molecular Genetics, University of Toronto, 160 College St, Toronto, ON, Canada M5S 3E1. 3Banting and Best Department of Medical Research, 160 College St, University of Toronto, Toronto, ON, Canada M5S 3E1. 4Terrence Donnelly Centre for Cellular and Biomolecular Research, University of Toronto, 160 College Street, 160 College St, Toronto, ON, Canada M5S 3E1.
Published: 28 December 2011
References
1. Stelzl U, Worm U, Lalowski M, Haenig C, Brembeck FH, Goehler H, Stroedicke M, Zenkner M, Schoenherr A, Koeppen S, Timm J, Mintzlaff S, Abraham C, Bock N, Kietzmann S, Goedde A, Toksoz E, Droege A, Krobitsch S, Korn B, Birchmeier W, Lehrach H, Wanker EE: A human protein-protein interaction network: a resource for annotating the proteome. Cell 2005, 122:957-968. 2. Rual JF, Venkatesan K, Hao T, Hirozane-Kishikawa T, Dricot A, Li N, Berriz GF,
Gibbons FD, Dreze M, Ayivi-Guedehoussou N, Klitgord N, Simon C, Boxem M, Milstein S, Rosenberg J, Goldberg DS, Zhang LV, Wong SL, Franklin G, Li S, Albala JS, Lim J, Fraughton C, Llamosas E, Cevik S, Bex C, Lamesch P, Sikorski RS, Vandenhaute J, Zoghbi HY, et al.: Towards a proteome-scale map of the human protein-protein interaction network. Nature 2005, 437:1173-1178. 3. Gavin AC, Aloy P, Grandi P, Krause R, Boesche M, Marzioch M, Rau C, Jensen LJ,
4. Krogan NJ, Cagney G, Yu H, Zhong G, Guo X, Ignatchenko A, Li J, Pu S, Datta N, Tikuisis AP, Punna T, Peregrin-Alvarez JM, Shales M, Zhang X, Davey M, Robinson MD, Paccanaro A, Bray JE, Sheung A, Beattie B, Richards DP, Canadien V, Lalev A, Mena F, Wong P, Starostine A, Canete MM, Vlasblom J, Wu S, Orsi C, et al.: Global landscape of protein complexes in the yeast
Saccharomyces cerevisiae. Nature 2006, 440:637-643.
5. Lee TI, Rinaldi NJ, Robert F, Odom DT, Bar-Joseph Z, Gerber GK, Hannett NM, Harbison CT, Thompson CM, Simon I, Zeitlinger J, Jennings EG, Murray HL, Gordon DB, Ren B, Wyrick JJ, Tagne JB, Volkert TL, Fraenkel E, Gifford DK, Young RA: Transcriptional regulatory networks in Saccharomyces cerevisiae. Science 2002, 298:799-804.
6. Gerstein MB, Lu ZJ, Van Nostrand EL, Cheng C, Arshinoff BI, Liu T, Yip KY, Robilotto R, Rechtsteiner A, Ikegami K, Alves P, Chateigner A, Perry M, Morris M, Auerbach RK, Feng X, Leng J, Vielle A, Niu W, Rhrissorrakrai K, Agarwal A, Alexander RP, Barber G, Brdlik CM, Brennan J, Brouillet JJ, Carr A, Cheung MS, Clawson H, Contrino S, et al.: Integrative analysis of the Caenorhabditis elegans genome by the modENCODE project. Science 2010, 330:1775-1787. 7. modENCODE Consortium, Roy S, Ernst J, Kharchenko PV, Kheradpour P, Negre
N, Eaton ML, Landolin JM, Bristow CA, Ma L, Lin MF, Washietl S, Arshinoff BI, Ay F, Meyer PE, Robine N, Washington NL, Di Stefano L, Berezikov E, Brown CD, Candeias R, Carlson JW, Carr A, Jungreis I, Marbach D, Sealfon R, Tolstorukov MY, Will S, Alekseyenko AA, Artieri C, Booth BW, et al.: Identification of functional elements and regulatory circuits by Drosophila modENCODE. Science 2010, 330:1787-1797.
8. Keshava Prasad TS, Goel R, Kandasamy K, Keerthikumar S, Kumar S, Mathivanan S, Telikicherla D, Raju R, Shafreen B, Venugopal A, Balakrishnan L, Marimuthu A, Banerjee S, Somanathan DS, Sebastian A, Rani S, Ray S, Harrys Kishore CJ, Kanth S, Ahmed M, Kashyap MK, Mohmood R, Ramachandra YL, Krishna V, Rahiman BA, Mohan S, Ranganathan P, Ramabadran S, Chaerkady R, Pandey A: Human Protein Reference Database - 2009 update. Nucleic Acids Res 2009, 37(Database issue):D767-772.
9. Ito T, Chiba T, Ozawa R, Yoshida M, Hattori M, Sakaki Y: A comprehensive two-hybrid analysis to explore the yeast protein interactome. Proc Natl Acad Sci U S A 2001, 98:4569-4574.
10. Uetz P, Giot L, Cagney G, Mansfield TA, Judson RS, Knight JR, Lockshon D, Narayan V, Srinivasan M, Pochart P, Qureshi-Emili A, Li Y, Godwin B, Conover D, Kalbfleisch T, Vijayadamodar G, Yang M, Johnston M, Fields S, Rothberg JM:
A comprehensive analysis of protein-protein interactions in
Saccharomyces cerevisiae. Nature 2000, 403:623-627.
11. Gavin AC, Bosche M, Krause R, Grandi P, Marzioch M, Bauer A, Schultz J, Rick JM, Michon AM, Cruciat CM, Remor M, Hofert C, Schelder M, Brajenovic M, Ruffner H, Merino A, Klein K, Hudak M, Dickson D, Rudi T, Gnau V, Bauch A, Bastuck S, Huhse B, Leutwein C, Heurtier MA, Copley RR, Edelmann A, Querfurth E, Rybin V, et al.: Functional organization of the yeast proteome by systematic analysis of protein complexes. Nature 2002, 415:141-147. 12. Breitkreutz A, Choi H, Sharom JR, Boucher L, Neduva V, Larsen B, Lin ZY,
Breitkreutz BJ, Stark C, Liu G, Ahn J, Dewar-Darch D, Reguly T, Tang X, Almeida R, Qin ZS, Pawson T, Gingras AC, Nesvizhskii AI, Tyers M: A global protein kinase and phosphatase interaction network in yeast. Science 2010,
328:1043-1046.
13. Engel SR, Balakrishnan R, Binkley G, Christie KR, Costanzo MC, Dwight SS, Fisk DG, Hirschman JE, Hitz BC, Hong EL, Krieger CJ, Livstone MS, Miyasato SR, Nash R, Oughtred R, Park J, Skrzypek MS, Weng S, Wong ED, Dolinski K,
Botstein D, Cherry JM: Saccharomyces Genome Database provides mutant
phenotype data. Nucleic Acids Res 2010, 38(Database issue):D433-436. 14. Li S, Armstrong CM, Bertin N, Ge H, Milstein S, Boxem M, Vidalain PO, Han JD,
Chesneau A, Hao T, Goldberg DS, Li N, Martinez M, Rual JF, Lamesch P, Xu L, Tewari M, Wong SL, Zhang LV, Berriz GF, Jacotot L, Vaglio P, Reboul J, Hirozane-Kishikawa T, Li Q, Gabel HW, Elewa A, Baumgartner B, Rose DJ, Yu H, et al.:
A map of the interactome network of the metazoan C. elegans. Science
2004, 303:540-543.
15. Harris TW, Antoshechkin I, Bieri T, Blasiar D, Chan J, Chen WJ, De La Cruz N, Davis P, Duesbury M, Fang R, Fernandes J, Han M, Kishore R, Lee R, Muller HM, Nakamura C, Ozersky P, Petcherski A, Rangarajan A, Rogers A, Schindelman G, Schwarz EM, Tuli MA, Van Auken K, Wang D, Wang X, Williams G, Yook K, Durbin R, Stein LD, et al.: WormBase: a comprehensive resource for nematode research. Nucleic Acids Res 2010, 38(Database issue):D463-467. 16. Giot L, Bader JS, Brouwer C, Chaudhuri A, Kuang B, Li Y, Hao YL, Ooi CE,
Godwin B, Vitols E, Vijayadamodar G, Pochart P, Machineni H, Welsh M, Kong Y, Zerhusen B, Malcolm R, Varrone Z, Collis A, Minto M, Burgess S, McDaniel L, Stimpson E, Spriggs F, Williams J, Neurath K, Ioime N, Agee M, Voss E, Furtak K,
et al.: A protein interaction map of Drosophila melanogaster. Science 2003,
302:1727-1736.
17. Stanyon CA, Liu G, Mangiola BA, Patel N, Giot L, Kuang B, Zhang H, Zhong J, Finley RL Jr: A Drosophila protein-interaction map centered on cell-cycle regulators. Genome Biol 2004, 5:R96.
18. Formstecher E, Aresta S, Collura V, Hamburger A, Meil A, Trehin A, Reverdy C, Betin V, Maire S, Brun C, Jacq B, Arpin M, Bellaiche Y, Bellusci S, Benaroch P, Bornens M, Chanet R, Chavrier P, Delattre O, Doye V, Fehon R, Faye G, Galli T, Girault JA, Goud B, de Gunzburg J, Johannes L, Junier MP, Mirouse V, Mukherjee A, et al.: Protein interaction mapping: a Drosophila case study. Genome Res 2005, 15:376-384.
19. Murali T, Pacifico S, Yu J, Guest S, Roberts GG 3rd, Finley RL Jr: DroID 2011: a comprehensive, integrated resource for protein, transcription factor, RNA and gene interactions for Drosophila. Nucleic Acids Res 2011,
39(Database issue):D736-743.
20. Tweedie S, Ashburner M, Falls K, Leyland P, McQuilton P, Marygold S, Millburn G, Osumi-Sutherland D, Schroeder A, Seal R, Zhang H, FlyBase Consortium:
FlyBase: enhancing Drosophila gene ontology annotations. Nucleic Acids Res 2009, 37(Database issue):D555-559.
21. Salwinski L, Miller CS, Smith AJ, Pettit FK, Bowie JU, Eisenberg D: The Database of Interacting Proteins: 2004 update. Nucleic Acids Res 2004,
32(Database issue):D449-451.
22. Turner B, Razick S, Turinsky AL, Vlasblom J, Crowdy EK, Cho E, Morrison K, Donaldson IM, Wodak SJ: iRefWeb: interactive analysis of consolidated protein interaction data and their supporting evidence. Database(Oxford)
2010, 2010:baq023.
23. Ceol A, Chatr Aryamontri A, Licata L, Peluso D, Briganti L, Perfetto L, Castagnoli L, Cesareni G: MINT, the molecular interaction database: 2009 update. Nucleic Acids Res 2010, 38(Database issue):D532-539.
24. Stark C, Breitkreutz BJ, Chatr-Aryamontri A, Boucher L, Oughtred R, Livstone MS, Nixon J, Van Auken K, Wang X, Shi X, Reguly T, Rust JM, Winter A, Dolinski K, Tyers M: The BioGRID Interaction Database: 2011 update. Nucleic Acids Res 2011, 39(Database issue):D698-704.
25. McAdams HH, Arkin A: Simulation of prokaryotic genetic circuits. Annu Rev Biophys Biomol Struct 1998, 27:199-224.
26. Kauffman SA: Metabolic stability and epigenesis in randomly constructed genetic nets. J Theor Biol 1969, 22:437-467.
27. Finn RD, Mistry J, Tate J, Coggill P, Heger A, Pollington JE, Gavin OL, Gunasekaran P, Ceric G, Forslund K, Holm L, Sonnhammer EL, Eddy SR, Bateman A: The Pfam protein families database. Nucleic Acids Res 2010,
38(Database issue):D211-222.
28. Letunic I, Doerks T, Bork P: SMART 6: recent updates and new developments. Nucleic Acids Res 2009, 37(Database issue):D229-232. 29. Gould CM, Diella F, Via A, Puntervoll P, Gemund C, Chabanis-Davidson S,
Michael S, Sayadi A, Bryne JC, Chica C, Seiler M, Davey NE, Haslam N, Weatheritt RJ, Budd A, Hughes T, Pas J, Rychlewski L, Trave G, Aasland R, Helmer-Citterich M, Linding R, Gibson TJ: ELM: the status of the 2010 eukaryotic linear motif resource. Nucleic Acids Res 2010, 38(Database issue):D167-180.
30. Remm M, Storm CE, Sonnhammer EL: Automatic clustering of orthologs and in-paralogs from pairwise species comparisons. J Mol Biol 2001,
314:1041-1052.
31. Li L, Stoeckert CJ Jr, Roos DS: OrthoMCL: identification of ortholog groups for eukaryotic genomes. Genome Res 2003, 13:2178-2189.
32. Muller J, Szklarczyk D, Julien P, Letunic I, Roth A, Kuhn M, Powell S, von Mering C, Doerks T, Jensen LJ, Bork P: eggNOG v2.0: extending the evolutionary genealogy of genes with enhanced non-supervised orthologous groups, species and functional annotations. Nucleic Acids Res 2010, 38(Database issue):D190-195.
33. Walhout AJ, Sordella R, Lu X, Hartley JL, Temple GF, Brasch MA, Thierry-Mieg N, Vidal M: Protein interaction mapping in C. elegans using proteins involved in vulval development. Science 2000, 287:116-122.
34. Matthews LR, Vaglio P, Reboul J, Ge H, Davis BP, Garrels J, Vincent S, Vidal M:
Identification of potential interaction networks using sequence-based searches for conserved protein-protein interactions or ‘interologs’. Genome Res 2001, 11:2120-2126.
35. Yu H, Luscombe NM, Lu HX, Zhu X, Xia Y, Han JD, Bertin N, Chung S, Vidal M, Gerstein M: Annotation transfer between genomes: protein-protein interologs and protein-DNA regulogs. Genome Res 2004, 14:1107-1118. 36. Mody A, Weiner J, Ramanathan S: Modularity of MAP kinases allows
37. Zhong Q, Simonis N, Li QR, Charloteaux B, Heuze F, Klitgord N, Tam S, Yu H, Venkatesan K, Mou D, Swearingen V, Yildirim MA, Yan H, Dricot A, Szeto D, Lin C, Hao T, Fan C, Milstein S, Dupuy D, Brasseur R, Hill DE, Cusick ME, Vidal M:
Edgetic perturbation models of human inherited disorders. Mol Syst Biol
2009, 5:321.
38. Jeong H, Mason SP, Barabasi AL, Oltvai ZN: Lethality and centrality in protein networks. Nature 2001, 411:41-42.
39. Jeong H, Tombor B, Albert R, Oltvai ZN, Barabasi AL: The large-scale organization of metabolic networks. Nature 2000, 407:651-654. 40. Ravasz E, Somera AL, Mongru DA, Oltvai ZN, Barabasi AL: Hierarchical
organization of modularity in metabolic networks. Science 2002,
297:1551-1555.
41. Barabasi AL, Albert R: Emergence of scaling in random networks. Science
1999, 286:509-512.
42. Wagner A: How the global structure of protein interaction networks evolves. Proc Biol Sci 2003, 270:457-466.
43. Wagner A: The yeast protein interaction network evolves rapidly and contains few redundant duplicate genes. Mol Biol Evol 2001, 18:1283-1292. 44. Wapinski I, Pfeffer A, Friedman N, Regev A: Natural history and evolutionary
principles of gene duplication in fungi. Nature 2007, 449:54-61. 45. Kim J, Krapivsky PL, Kahng B, Redner S: Infinite-order percolation and giant
fluctuations in a protein interaction network. Phys Rev E Stat Nonlin Soft Matter Phys 2002, 66:055101.
46. Pastor-Satorras R, Smith E, Sole RV: Evolving protein interaction networks through gene duplication. J Theor Biol 2003, 222:199-210.
47. Chung F, Lu L, Dewey TG, Galas DJ: Duplication models for biological networks. J Comput Biol 2003, 10:677-687.
48. Evlampiev K, Isambert H: Conservation and topology of protein interaction networks under duplication-divergence evolution. Proc Natl Acad Sci U S A
2008, 105:9863-9868.
49. Caldarelli G, Capocci A, De Los Rios P, Munoz MA: Scale-free networks from varying vertex intrinsic fitness. Phys Rev Lett 2002, 89:258702.
50. Kim WK, Marcotte EM: Age-dependent evolution of the yeast protein interaction network suggests a limited role of gene duplication and divergence. PLoS Comput Biol 2008, 4:e1000232.
51. Pinney JW, Amoutzias GD, Rattray M, Robertson DL: Reconstruction of ancestral protein interaction networks for the bZIP transcription factors. Proc Natl Acad Sci U S A 2007, 104:20449-20453.
52. Fraser HB, Hirsh AE, Steinmetz LM, Scharfe C, Feldman MW: Evolutionary rate in the protein interaction network. Science 2002, 296:750-752.
53. Wuchty S, Oltvai ZN, Barabasi AL: Evolutionary conservation of motif constituents in the yeast protein interaction network. Nat Genet 2003,
35:176-179.
54. Jordan IK, Wolf YI, Koonin EV: No simple dependence between protein evolution rate and the number of protein-protein interactions: only the most prolific interactors tend to evolve slowly. BMC Evol Biol 2003, 3:1. 55. Bloom JD, Adami C: Apparent dependence of protein evolutionary rate on
number of interactions is linked to biases in protein-protein interactions data sets. BMC Evol Biol 2003, 3:21.
56. Kim PM, Lu LJ, Xia Y, Gerstein MB: Relating three-dimensional structures to protein networks provides evolutionary insights. Science 2006,
314:1938-1941.
57. Veltman DM, Insall RH: WASP family proteins: their evolution and its physiological implications. Mol Biol Cell 2010, 21:2880-2893. 58. Hubbard EJ, Yang XL, Carlson M: Relationship of the cAMP-dependent
protein kinase pathway to the SNF1 protein kinase and invertase expression in Saccharomyces cerevisiae. Genetics 1992, 130:71-80. 59. Han JD, Bertin N, Hao T, Goldberg DS, Berriz GF, Zhang LV, Dupuy D, Walhout
AJ, Cusick ME, Roth FP, Vidal M: Evidence for dynamically organized modularity in the yeast protein-protein interaction network. Nature 2004,
430:88-93.
60. Milo R, Shen-Orr S, Itzkovitz S, Kashtan N, Chklovskii D, Alon U: Network motifs: simple building blocks of complex networks. Science 2002,
298:824-827.
61. Bandyopadhyay S, Sharan R, Ideker T: Systematic identification of functional orthologs based on protein network comparison. Genome Res 2006,
16:428-435.
62. Kelley BP, Sharan R, Karp RM, Sittler T, Root DE, Stockwell BR, Ideker T:
Conserved pathways within bacteria and yeast as revealed by global protein network alignment. Proc Natl Acad Sci U S A 2003, 100:11394-11399. 63. Kalaev M, Smoot M, Ideker T, Sharan R: NetworkBLAST: comparative analysis
of protein networks. Bioinformatics 2008, 24:594-596.
64. Flannick J, Novak A, Srinivasan BS, McAdams HH, Batzoglou S: Graemlin: general and robust alignment of multiple large interaction networks. Genome Res 2006, 16:1169-1181.
65. Liao CS, Lu K, Baym M, Singh R, Berger B: IsoRankN: spectral methods for global alignment of multiple protein networks. Bioinformatics 2009,
25:i253-258.
66. Sharan R, Suthram S, Kelley RM, Kuhn T, McCuine S, Uetz P, Sittler T, Karp RM, Ideker T: Conserved patterns of protein interaction in multiple species. Proc Natl Acad Sci U S A 2005, 102:1974-1979.
67. Beltrao P, Trinidad JC, Fiedler D, Roguev A, Lim WA, Shokat KM, Burlingame AL, Krogan NJ: Evolution of phosphoregulation: comparison of
phosphorylation patterns across yeast species. PLoS Biol 2009, 7:e1000134. 68. Borneman AR, Gianoulis TA, Zhang ZD, Yu H, Rozowsky J, Seringhaus MR,
Wang LY, Gerstein M, Snyder M: Divergence of transcription factor binding sites across related yeast species. Science 2007, 317:815-819.
69. Shou C, Bhardwaj N, Lam HYK, Yan K, Kim PM, Snyder M, Gerstein M:
Measuring the evolutionary rewiring of biological networks. PLoS Comput Biol 2011, 7:e1001050.
70. Tan K, Feizi H, Luo C, Fan SH, Ravasi T, Ideker TG: A systems approach to delineate functions of paralogous transcription factors: role of the Yap family in the DNA damage response. Proc Natl Acad Sci U S A 2008,
105:2934-2939.
71. Grove CA, De Masi F, Barrasa MI, Newburger DE, Alkema MJ, Bulyk ML, Walhout AJ: A multiparameter network reveals extensive divergence between C. elegans bHLH transcription factors. Cell 2009, 138:314-327. 72. Tonikian R, Xin X, Toret CP, Gfeller D, Landgraf C, Panni S, Paoluzi S, Castagnoli
L, Currell B, Seshagiri S, Yu H, Winsor B, Vidal M, Gerstein MB, Bader GD, Volkmer R, Cesareni G, Drubin DG, Kim PM, Sidhu SS, Boone C: Bayesian modeling of the yeast SH3 domain interactome predicts spatiotemporal dynamics of endocytosis proteins. PLoS Biol 2009, 7:e1000218.
73. Freschi L, Courcelles M, Thibault P, Michnick SW, Landry CR: Phosphorylation network rewiring by gene duplication. Mol Syst Biol 2011, 7:504.
74. Schmidt D, Wilson MD, Ballester B, Schwalie PC, Brown GD, Marshall A, Kutter C, Watt S, Martinez-Jimenez CP, Mackay S, Talianidis I, Flicek P, Odom DT: Five-vertebrate ChIP-seq reveals the evolutionary dynamics of transcription factor binding. Science 2010, 328:1036-1040.
75. Peterson KJ, Cotton JA, Gehling JG, Pisani D: The Ediacaran emergence of bilaterians: congruence between the genetic and the geological fossil records. Philos Trans R Soc Lond B Biol Sci 2008, 363:1435-1443.
76. Kimura M: The Neutral Theory of Molecular Evolution. New York: Cambridge University Press; 1983.
77. Levy ED, Landry CR, Michnick SW: How perfect can protein interactomes be? Sci Signal 2009, 2:pe11.
78. Landry CR, Levy ED, Michnick SW: Weak functional constraints on phosphoproteomes. Trends Genet 2009, 25:193-197.
79. Li Q, Johnston SA: Are all DNA binding and transcription regulation by an activator physiologically relevant? Mol Cell Biol 2001, 21:2467-2474. 80. Lynch M: The evolution of genetic networks by non-adaptive processes.
Nat Rev Genet 2007, 8:803-813.
81. Shakhnovich BE, Koonin EV: Origins and impact of constraints in evolution of gene families. Genome Res 2006, 16:1529-1536.
82. Beltrao P, Serrano L: Specificity and evolvability in eukaryotic protein interaction networks. PLoS Comput Biol 2007, 3:e25.
83. Hedges SB: The origin and evolution of model organisms. Nat Rev Genet
2002, 3:838-849.
84. Gandhi TK, Zhong J, Mathivanan S, Karthick L, Chandrika KN, Mohan SS, Sharma S, Pinkert S, Nagaraju S, Periaswamy B, Mishra G, Nandakumar K, Shen B, Deshpande N, Nayak R, Sarker M, Boeke JD, Parmigiani G, Schultz J, Bader JS, Pandey A: Analysis of the human protein interactome and comparison with yeast, worm and fly interaction datasets. Nat Genet 2006, 38:285-293. 85. von Mering C, Krause R, Snel B, Cornell M, Oliver SG, Fields S, Bork P:
Comparative assessment of large-scale data sets of protein-protein interactions. Nature 2002, 417:399-403.
86. Chakrabarti P, Janin J: Dissecting protein-protein recognition sites. Proteins
2002, 47:334-343.
87. Pawson T, Nash P: Assembly of cell regulatory systems through protein interaction domains. Science 2003, 300:445-452.
88. Mintseris J, Weng Z: Structure, function, and evolution of transient and obligate protein-protein interactions. Proc Natl Acad Sci U S A 2005,
89. Neduva V, Russell RB: Linear motifs: evolutionary interaction switches. FEBS Lett 2005, 579:3342-3345.
90. Odom DT, Dowell RD, Jacobsen ES, Gordon W, Danford TW, MacIsaac KD, Rolfe PA, Conboy CM, Gifford DK, Fraenkel E: Tissue-specific transcriptional regulation has diverged significantly between human and mouse. Nat Genet 2007, 39:730-732.
91. Tuch BB, Galgoczy DJ, Hernday AD, Li H, Johnson AD: The evolution of combinatorial gene regulation in fungi. PLoS Biol 2008, 6:e38.
92. Bradley RK, Li XY, Trapnell C, Davidson S, Pachter L, Chu HC, Tonkin LA, Biggin MD, Eisen MB: Binding site turnover produces pervasive quantitative
changes in transcription factor binding between closely related
Drosophila species. PLoS Biol 2010, 8:e1000343.
93. Tamura K, Subramanian S, Kumar S: Temporal patterns of fruit fly (Drosophila) evolution revealed by mutation clocks. Mol Biol Evol 2004,
21:36-44.
doi:10.1186/gb-2011-12-12-235