A s y s t e m a ti c p r o c e d u r e t o
o p ti mi s e d o s e a n d i m a g e q u a li ty
fo r t h e m e a s u r e m e n t of i n t e
r-v e r t e b r a l a n g l e s fr o m l a t e r a l
s pi n al p r oj e c ti o n s u si n g C o b b
a n d s u p e r i m p o si tio n m e t h o d s
Al Q a r o o t , B, H o g g , P, Twi s t e , M a n d H o w a r d , D
h t t p :// dx. d oi.o r g / 1 0 . 3 2 3 3 /XST-1 4 0 4 4 9
T i t l e A s y s t e m a ti c p r o c e d u r e t o o p ti mi s e d o s e a n d i m a g e q u a li ty fo r t h e m e a s u r e m e n t of in t e r-v e r t e b r al a n g l e s f r o m l a t e r a l s pi n al p r oj e c ti o n s u si n g C o b b a n d s u p e r i m p o si tio n
m e t h o d s
A u t h o r s Al Q a r o o t, B, H o g g , P, Twis t e , M a n d H o w a r d , D
Typ e Ar ticl e
U RL T hi s v e r si o n is a v ail a bl e a t :
h t t p :// u sir. s alfo r d . a c . u k /i d/ e p ri n t/ 3 2 9 1 2 / P u b l i s h e d D a t e 2 0 1 4
U S IR is a d i gi t al c oll e c ti o n of t h e r e s e a r c h o u t p u t of t h e U n iv e r si ty of S alfo r d . W h e r e c o p y ri g h t p e r m i t s , f ull t e x t m a t e r i al h el d i n t h e r e p o si t o r y is m a d e f r e ely a v ail a bl e o nli n e a n d c a n b e r e a d , d o w nl o a d e d a n d c o pi e d fo r n o
n-c o m m e r n-ci al p r iv a t e s t u d y o r r e s e a r n-c h p u r p o s e s . Pl e a s e n-c h e n-c k t h e m a n u s n-c ri p t fo r a n y f u r t h e r c o p y ri g h t r e s t r i c ti o n s .
1 Article title:
A systematic procedure to optimise dose and image quality for the measurement of
inter-vertebral angles from lateral spinal projections using Cobb and superimposition
methods
Authors:
Dr Bashar Al Qaroota,b, Prof Peter Hogga, Dr Martin Twistea,c, and Prof David Howarda,d
a
Centre for Health Sciences Research, University of Salford, UK
b
Prosthetics and Orthotics department, The University of Jordan, Jordan
c
UNIPOD – United National Institute for Prosthetics & Orthotics Development,
University of Salford, UK
d
School of Computing, Science & Engineering, University of Salford, UK
Dr Bashar Al Qaroot Corresponding author
Prof Peter Hogg Dr Martin Twiste Prof David Howard
BSc, MSc, PhD BSc, MSc BSc, MSc, PhD BSc, PhD
Assistant Professor (University of Jordan) Honorary Research Fellow
(University of Salford)
Diagnostic Imaging Research Programme
Lead
Senior Lecturer Associate Head (Research) EPS
Office 204 Prosthetics and Orthotics
department Faculty of Rehabilitation
Sciences University of Jordan, Amman, 11942, Jordan.
T: +962(0)777 151 856 E: [email protected]
L608 Allerton Building University of Salford Salford, M5 4WT, UK
T: +44(0) 161 295 2492 E: [email protected]
PO53
Brian Blatchford Building University of Salford Salford M5 4WT, UK
T: +44(0) 161 295 7029 E: [email protected]
UG3 Newton Building University of Salford Salford M5 4WT, UK
T: +44(0) 161 295 3584 E: [email protected]
Abstract
Background: Patients with vertebral column deformations are exposed to high risks
2
serial X-ray images that are needed to measure and asses their spinal deformation
using Cobb or superimposition methods. Therefore, optimising such X-ray practice,
via reducing dose whilst maintaining image quality, is a necessity.
Objectives: With a specific focus on lateral thoraco-lumbar images for Cobb and
superimposition measurements, this paper outlines a systematic procedure to the
optimisation of X-ray practice.
Methods: Optimisation was conducted based on suitable image quality from minimal
dose. Image quality was appraised using a visual-analogue-rating-scale, and
Monte-Carlo modelling was used for dose estimation. The optimised X-ray practice was
identified by imaging healthy normal-weight male adult living human volunteers.
Results: The optimised practice consisted of: anode towards the head, broad focus,
no OID or grid, 80kVp, 32mAs and 130cm SID.
Conclusion: Images of suitable quality for laterally assessing spinal conditions using
Cobb or superimposition measurements were produced from an effective dose of
0.05mSv, which is 83% less than the average effective dose used in the UK for
lateral thoracic/lumbar exposures. This optimisation procedure can be adopted and
use for optimisation of other radiographic techniques.
Keywords
Optimisation of X-ray imaging, lateral thoraco-lumbar imaging, exposure dose
reduction, image quality preservation, Cobb method, superimposition method.
Introduction
3
ionising radiation exposure. This is why as low as reasonably achievable (ALARA)
dose should always be adopted, but not at the expense of image quality1, 2. Optimising X-ray practices is thus essential for imaging people. This is particularly
important when performing serial imaging3-5.
Serial imaging is often required when treating young patients with vertebral column
deformations (thereby imposing high risks such as breast cancer6). Imaging is commonly performed using plain X-ray7, 8 where images are used to monitor and assess a patient’s deformation using ‘Cobb’ or ‘superimposition’ method for
inter-vertebral angle7 or range of motion8 measurements, respectively. Optimisation associated with these measurement methods should be based on minimising dose
whilst maintaining image quality suitable for taking accurate measurements to
assess vertebral deformation.
Several publications6, 9-14 have outlined how manipulating some acquisition parameters may result in dose reduction whilst maintaining image quality for
accurate Cobb method measurements. Some found the posterio-anterior (rather
than anterio-posterior) projection is an effective way of reducing dose to critical
organs9. Others have demonstrated that dose can be reduced and image quality maintained by manipulating certain acquisition parameters, for instance: not using a
secondary radiation grid (or using an air gap technique)9-12; increasing both voltage and inherent beam filtration6, 14; and using digital imaging equipment11-13. However, no publication has considered in a single study outlining the combined effect of the
different acquisition parameters. Also, whilst posterio-anterior and anterio-posterior
projections of the spine have been considered within many publications, only some
4
have focused on dose reduction for the Cobb method, whereas none have
considered the superimposition method.
In an attempt to overcome this gap in the literature, this study has considered the
combined effect of the main acquisition parameters (discussed below) within one
optimisation procedure in order to identify the acquisition parameters settings that
result in adequate image quality from minimal dose. In this study, the lateral
thoraco-lumbar spine (9th thoracic to 3rd lumbar vertebra (T9 to L3)) was selected for imaging because spinal deformations are common in this region17.
This study, therefore, aims to outline a systematic procedure to the optimisation of
X-ray practice with a specific focus on lateral thoraco-lumbar (T9 to L3) images for
Cobb and superimposition measurements.
Methodology
For the purposes of optimisation, image quality was appraised using a bespoke
visual analogue rating scale (VARS), and dose was estimated using software
PCXMC 2.0.1.318 (STUK, Finland).
The VARS’ five criteria (given in Table 1) met the requirements for Cobb and
superimposition methods, and were informed by the European guidelines on quality
criteria for lateral lumbar radiographs19. To verify appraisers’ consistency in using the VARS, 3 radiographers and 1 orthotist scored 50 lateral thoraco-lumbar images of
clear to not clear qualities. These images were choosen, by 2 independent
radiographers, from a pool of just under 1000 images acquired at different
acquisition parameters. Cohen’s Kappa coefficient20
demonstrated high consistency
5
all images in this study. Cohen’s Kappa coefficient test was used rather than
weighted Cohen’s Kappa coefficient test because the later is used when the
agreement on a specific category(s) within the scale is to be investigated. However,
in this study, this was not the case as there was only two categories on the scale
[image:7.595.73.529.281.480.2](clear or not clear) and they both were equally important20,21
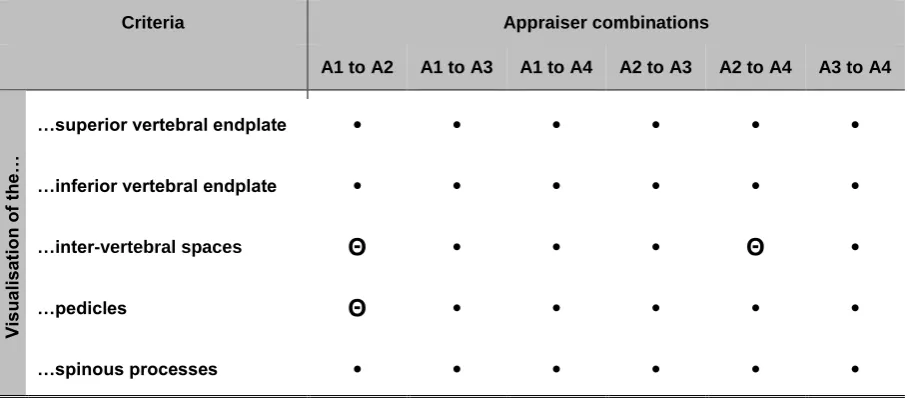
Table 1. This gives the agreement level between the 4 appraisers based on Cohen’s kappa coefficient results in relation to each of the five criteria that formed the VARS. ‘A1’, ‘A2’, ‘A3’, and ‘A4’ are appraisers 1, 2, 3, and 4, respectively. Based on Landis and Koch 35, a Kappa of 0.81 to 1.00 indicates substantial to almost perfect agreement (presented as ‘•’); and Kappa of 0.61 to 0.80 indicates moderate agreement (presented as ‘Θ’).
Criteria Appraiser combinations
A1 to A2 A1 to A3 A1 to A4 A2 to A3 A2 to A4 A3 to A4
Vis ua li sa tio n of the …
…superior vertebral endplate • • • • • •
…inferior vertebral endplate • • • • • •
…inter-vertebral spaces Θ • • • Θ •
…pedicles Θ • • • • •
…spinous processes • • • • • •
Due to time restrictions and the large number of dose measurements that were
needed, effective dose (E) was estimated from air Kerma using Monte Carlo
simulation18, 22, 23 with International Committee of Radiology Protection 103 weighting factors24.
The optimisation was conducted in 2 parts. Part 1 consisted of an anthropomorphic
phantom based investigation into the effect of the main acquisition parameters on
image quality and E, and involved a computed radiography (CR) system
(Arcoma-Arco-Ceil, 3.5mm total filtration), an AGFA 35-X digitiser (AGFA, Belgium), an NX
6
USA). Part 2 consisted of healthy male volunteers based imaging validation that took
into account the results from part 1. In particular, 9 normal-weight (body mass index
of 18.50 to 24.99 kg/m2) adult (18-40 year-olds) living human volunteers with heights ranging from 155-200cm were recruited. Each volunteer was imaged 6 images in
different positions (i.e. flexion, extension and neutral) as part of another investigation
that was held to compare restrictions on spinal mobility (measured using Cobb and
superimposition methods) whilst wearing different spinal orthoses. Due to the
unrelated focus, the results of this investigation will be published in a separate paper.
In this part, a CR MEDIO 50 system (Philips, Netherlands, 3.5mm total filtration), an
AGFA 30-X digitiser (AGFA, Belgium), and NX 3.7.0.0 workstation were used. For
both studies, the same look-up table was used to display and process the images
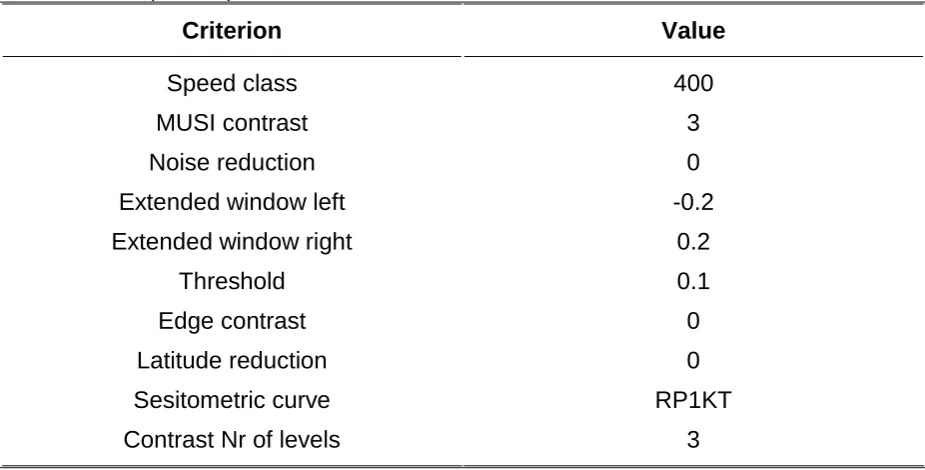
[image:8.595.66.529.426.661.2](see table 2). Also, equipment quality control tests met manufacturer specifications.
Table 2. Look-up table specifications
Criterion Value
Speed class
MUSI contrast
Noise reduction
Extended window left
Extended window right
Threshold
Edge contrast
Latitude reduction
Sesitometric curve
Contrast Nr of levels
400 3 0 -0.2 0.2 0.1 0 0 RP1KT 3
Ethical approval was granted for the human (part 2) study, whereby each participant
consented before taking part in the study. Females were excluded, because they
7
unknown pregnancy.
1) Overview of part 1 (phantom study)
Investigating the effect of the main acquisition parameters (discussed below) on
image quality and E is best performed with a full-factorial investigation that takes into
account all possible combinations between the settings across all acquisition
parameters. However, such a procedure would be time consuming due to the
extensive number of experimental possibilities. Instead, the main acquisition
parameters were divided into a primary and secondary set, whereby only the primary
set was subject to a full-factorial investigation.
X-ray photon quantity, penetrability and intensity are primarily controlled by kilovolt
peak (kVp), milliamp seconds (mAs) and source to image detector distance (SID).
These were considered to be the primary acquisition parameters as they directly
affect image quality and dose. In turn, anode heel effect, focal spot, object to image
receptor [IR] distance (OID), air gap, and grid were considered as the secondary
acquisition parameters as they have a lesser effect on image quality and dose than
the primary acquisition parameters.
The procedure by which the effect of the main acquisition parameters on image
quality and E was investigated consisted of 3 steps:
Step 1 – Establish the factorial set of primary acquisition parameters
Step 2 – Optimise each secondary acquisition parameter individually
(using a factorial set of primary acquisition parameter combinations,
8
Step 3 – Conduct a full-factorial primary acquisition parameter investigation
(whilst secondary acquisition parameters are fixed at their optimised
settings)
During these 3 steps, the phantom was positioned in accordance with Clark25. Collimation was limited to T9 to L3 in accordance with the recommendations from
the Institute of Physics and Engineering in Medicine26.
2) Overview of part 2 (human study)
The results from part 1 were applied within part 2 to identify suitable acquisition
parameter settings.
3) Details of part 1 (phantom study)
Step 1 – Establish a factorial set of primary acquisition parameters
For each of the 3 primary acquisition parameters (i.e. kVp, mAs and SID), 10 fairly
evenly distributed settings were chosen from their available range of settings.
Different combinations between these settings (where each combination involved all
3 primary acquisition parameters) were then used for imaging the phantom, until a
combination was identified that produced an image of suitable quality based on the
VARS results. Throughout this testing, the secondary acquisition parameters were
fixed, based on the European guidelines on quality criteria for lateral lumbar
radiographs19.
Additional primary acquisition parameter settings were then chosen via a systematic
procedure, using 2 settings below and 1 above each of the 3 obtained settings. The
9
based on the VARS results in that images acquired at 2 settings above were mostly
associated with unsuitable image quality. This gave a total of 4 settings for each of
the 3 of primary acquisition parameters (i.e. 1 initial setting plus 2 settings below and
1 setting above) and hence a total of 64 combinations (4 kVp × 4 mAs × 4 SID = 64).
Step 2 – Optimise each secondary acquisition parameter individually
Anode heel effect
Using the 64 combinations identified in step 1, 64 images were acquired at each: 1)
anode towards the head; and 2) anode towards the feet (i.e. the 2 anode heel effect
settings). Then, based on suitable image quality and lowest E, the optimised setting
was identified.
Focal spot
Focal spot was optimised using the same procedure as for anode heel effect.
However, images were acquired at each: 1) broad (1.2mm); and 2) fine focus
(0.6mm). Exposure time was recorded for all images, as this can be different
between the 2 foci.
OID and air gap
As both OID and air gap are indicators of the distance between the exposed object
and the IR, air gap is implicitly optimised by optimising the OID. OID was optimised
using the same procedure as for anode heel effect. However, images were acquired
at each: 1) OID=0cm (in contact with the phantom); 2) OID=15cm; and 3)
OID=30cm. The latter 2 OIDs were chosen as they have been reported appropriate
10
Due to the different ways in which an OID can be created, OID was investigated
twice:
1. Increasing the SID associated with the 64 combinations from step 1 by the 3
OIDs (0cm, 15cm and 30cm) (i.e. SOD [source to object distance] was fixed);
2. Decreasing the SOD by the 3 OIDs (0cm, 15cm and 30cm) (i.e. SID associated
with the 64 combinations from step 1 was fixed).
Grid
A reciprocating 10:1 focus grid (Wolverson, UK) was used, because it is common in
clinical practice5. The use of a grid was optimised using a similar procedure to anode heel effect. However, images where acquired at each: 1) no grid (OID=0cm); and 2)
grid. Also, the 64 combinations of kVp, mAs and SID were slightly modified in that
the SID was fixed at 110cm to avoid grid cut-off as specified by the manufacturer.
Step 3 – Conduct a full-factorial primary acquisition parameter investigation
For this, the primary acquisition parameters were investigated based on images
acquired at all combinations of kVp, mAs and SID settings with the secondary
acquisition parameters fixed at their optimised settings identified in step 2.
Images were acquired using 60 to 95kVp (stepping through 5kVp increments) in
relation to 22 to 55mAs (stepping through 2mAs increments when applicable) in
relation to 90 to 140cm SID (stepping through 5cm SID increments). The increments
were based on preliminary work in which the minimum to trigger a change in image
quality was identified. Also, the maximum and minimum primary acquisition
11
highest and lowest kVp, mAs and SID settings from the 64 combinations established
in step 1, respectively. The reason for doing this was to investigate whether
combinations of primary acquisition parameters from ranges outside the established
ranges from step 1 were associated with suitable image quality from lower E.
Acquired images were appraised with the VARS, and E was estimated for only the
combinations of primary acquisition parameter settings associated with suitable
image quality. These combinations were then ranked according to E values.
4) Details of part 2 (human study)
Knowing that there may be differences between phantoms and humans, the ranked
combinations of acquisition parameters from part 1 (phantom study) were tested on
humans.
Results and Discussion
Part 1 – Phantom study
Step 1 – Establish a factorial set of primary acquisition parameters
The acquisition parameter combination that produced suitable image quality was
80kVp, 39mAs and 120cm SID. Based on these settings, the 64 combinations of
primary acquisition parameters that were used during step 2 (again, which also
involved 2 settings below and 1 above each obtained setting) were 70, 75, 80 and
85kVp in relation to 27, 33, 39 and 45mAs in relation to 100, 110, 120 and 130cm
12
Step 2 – Optimise each secondary acquisition parameter individually
Anode heel effect
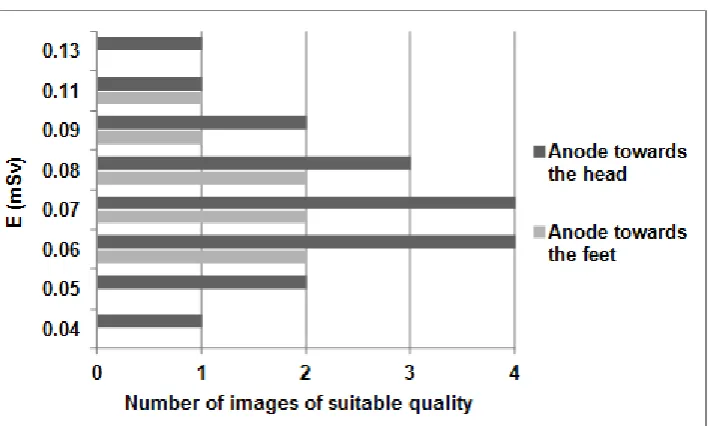
Figure 1. This gives the number of times each E produced a suitable image quality for the 2 anode heel effect settings (no zeros shown). 64 images were acquired at each setting, whereby the figure presents only images associated with suitable quality.
E to produce suitable image quality was either the same or lower when the anode
was towards the head than towards the feet (Figure 1). This contradicts Fung &
Gilboy28, who investigated dose absorbed by various organs in relation to both anode heel effect settings from a lateral lumbar spine exposure (28.81mGy entrance
skin dose). With the anode towards the feet, they found an organ dose reduction of
385µGy and 3.7µGy for ovaries and testes, respectively. There was an increase of
3µGy, 0.4µGy, 0.1µGy for breasts, thyroids, and eye lenses, respectively. However,
they used the same exposure factors of 96kVp and 120mAs for both anode heel
effect settings, and did not consider optimising for image quality. This is perhaps why
their findings differ from this study. Based on the above, ‘anode towards the head’ is
[image:14.595.78.433.147.360.2]13
Focal spot
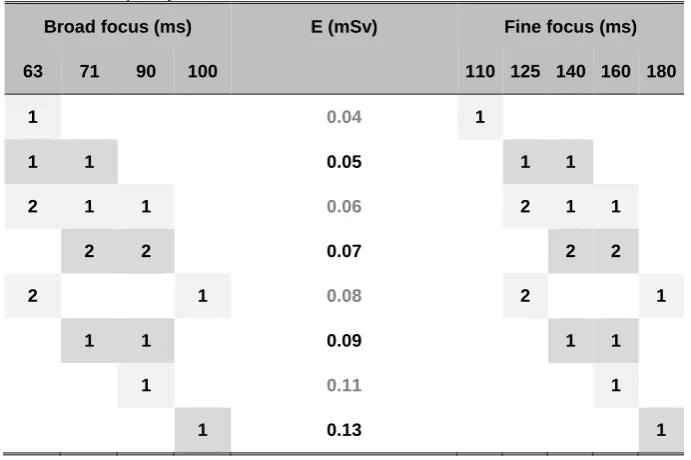
In agreement with others29, this study showed that E associated with suitable image quality was the same at both foci (Table 3). Also, acquisition time was always
47-80ms shorter with a broad focus. Reducing acquisition time would likely reduce
patient movement and therefore motion blur. Based on the above, ‘broad’ is the
optimised setting.
Table 3. The different Es are shown in ascending order, whereby the number of times each E produced a suitable image quality is shown for the 2 focal spot settings’ exposure times (no zeros shown). 64 images were acquired at each setting, whereby the table presents only images associated with suitable quality.
Broad focus (ms) E (mSv) Fine focus (ms)
63 71 90 100 110 125 140 160 180
1 0.04 1
1 1 0.05 1 1
2 1 1 0.06 2 1 1
2 2 0.07 2 2
2 1 0.08 2 1
1 1 0.09 1 1
1 0.11 1
1 0.13 1
OID or air gap
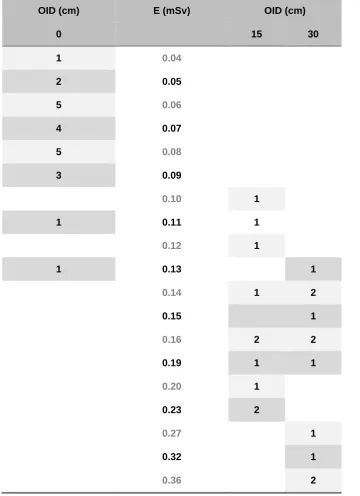
Suitable image quality could be produced from lower E at OID=0cm than at OID=15
and 30cm (Table 4). Although in agreement with other studies5, 30, the findings from this study are in contradiction to Trout et al.27, who suggested that images of similar quality can be produced at 0 and 15cm OIDs from the same E by adjusting SID to a
long setting. This contradiction might be because those authors considered image
[image:15.595.70.416.307.537.2]14
quality.Therefore, their conclusion is questionable, because they were not looking for
diagnostic criteria in their image quality definition. Following OID investigation, the
optimised OID setting is ‘0cm’.
Table 4. The different Es are shown in ascending order, whereby the number of times each E produced a suitable image quality is shown for the 3 OID settings (no zeros shown). 64 images were acquired at each setting, whereby the table presents only images associated with suitable quality.
OID (cm) E (mSv) OID (cm)
0 15 30
1 0.04
2 0.05
5 0.06
4 0.07
5 0.08
3 0.09
0.10 1
1 0.11 1
0.12 1
1 0.13 1
0.14 1 2
0.15 1
0.16 2 2
0.19 1 1
0.20 1
0.23 2
0.27 1
0.32 1
[image:16.595.70.431.204.701.2]15
Grid
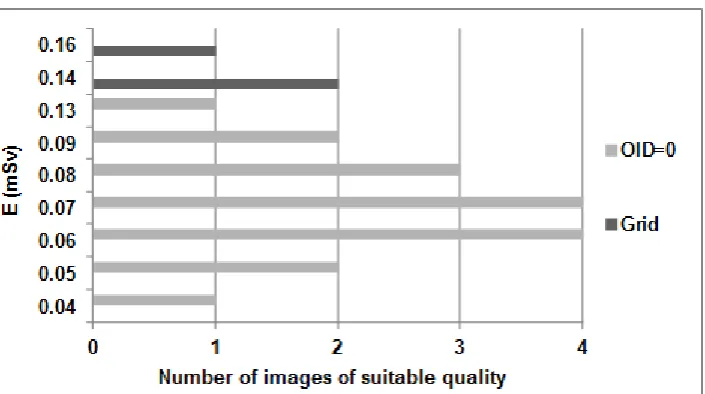
[image:17.595.80.433.230.427.2]E to produce suitable image quality was always lower at OID=0cm than with a grid
(Figure 2). In particular, the grid required an increase of at least 0.1mSv to produce
the same image quality (i.e. the same VARS scores). Therefore, the optimised
setting is ‘OID=0cm’.
Figure 2. This gives the number of times each E produced a suitable image quality for OID=0cm and grid settings (no zeros shown). 64 images were acquired at each setting, whereby the figure presents only images associated with suitable quality.
Step 3 – Conduct a full-factorial primary acquisition parameter investigation
From the 880 combinations of primary acquisition parameter of the full-factorial
investigation (i.e. 8 kVp × 10mAs × 11 SID = 880), images of suitable quality were
produced from only 74 of these combinations. The combinations mainly ranged from
16
Figure 3.This gives the 74 combinations of kVp, mAs and SID settings that produced images of suitable quality with the anode towards the head, broad focus, OID=0cm (IR in contact with the volunteer), and no grid settings. Any column represents a combination of settings that produced a suitable image quality. For better illustration purposes, the increase in column height and darkness indicate an increase in E (measured in mSv).
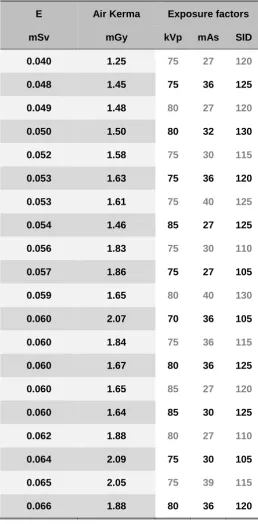
Table 5 demonstrates a sample of the estimated E from the 74 combinations of
primary acquisition parameter settings that produced the 74 images of suitable
[image:18.595.73.375.67.613.2]17
[image:19.595.72.331.157.683.2]settings).
Table 5. A sample of the 20 lowest Es is shown in conjunction with the associated primary acquisition parameter settings. The secondary acquisition parameters were fixed at their optimised settings: with the anode towards the head, broad focal spot size, and OID=0cm. The corresponding air Kerma is also listed.
E Air Kerma Exposure factors
mSv mGy kVp mAs SID
0.040 1.25 75 27 120
0.048 1.45 75 36 125
0.049 1.48 80 27 120
0.050 1.50 80 32 130
0.052 1.58 75 30 115
0.053 1.63 75 36 120
0.053 1.61 75 40 125
0.054 1.46 85 27 125
0.056 1.83 75 30 110
0.057 1.86 75 27 105
0.059 1.65 80 40 130
0.060 2.07 70 36 105
0.060 1.84 75 36 115
0.060 1.67 80 36 125
0.060 1.65 85 27 120
0.060 1.64 85 30 125
0.062 1.88 80 27 110
0.064 2.09 75 30 105
0.065 2.05 75 39 115
0.066 1.88 80 36 120
These 74 combinations of primary acquisition parameter settings, together with the
18
radiographic practices (based on E) for producing lateral T9 to L3 images from a
reduced E.
The results show that images acquired at SIDs above 100cm but below 130cm may
have the same image quality. Additionally, images acquired at SIDs less than 100cm
had a considerably reduced quality in comparison to those acquired at SID above
130cm. Also, images acquired based on a range of SIDs from 100cm up to 130cm
may have the same image quality. This was in contradiction to Brennan and Nash31, who found reduced sharpness of superior and inferior endplates with increasing
SIDs from 100 to 130cm (whilst other acquisition parameters were fixed) in a lateral
lumbar exposure. However, they suggested that this is due to grid cut-off, rather than
increase in SID, which agrees with findings from the current study where a without
grid exposure in conjunction with an SID of 100cm up to 130cm (whilst other
acquisition parameters were fixed) reproduced the superior and inferior endplates
clearly.
Further, with the same kVp and mAs settings, when SID increases above 100cm, the
E steadily reduces, and the image quality is not affected until the SID exceeds
130cm. This is in agreement with other investigations that found a marked entrance
surface dose and E reduction of approximately 12.5% and 45%, respectively (without
affecting image quality) when SID increased above 100cm up to 130cm in lateral
lumbar exposures32.
Furthermore and in accordance with other investigations33, a relatively low setting of both kVp and mAs was associated with suitable image quality in this study. This was
the case possibly because images are considered suitable as long as they can be
19
noise.
Part 2 – Human study
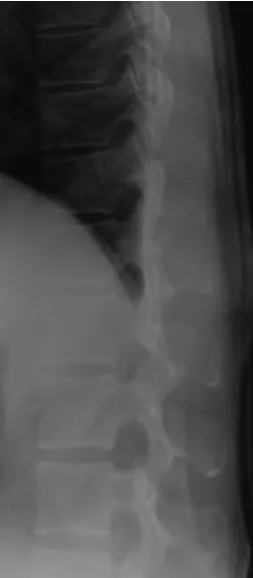
The combination of acquisition parameter settings from the phantom-based study
associated with the 4th lowest ranked E (rather than the 1st lowest ranked E) was the one that produced human volunteer images of suitable quality from the lowest E
(Figure 4). This optimised combination was successful in producing images of
suitable quality from human volunteers whilst standing upright and with the trunk
[image:21.595.73.200.328.618.2]flexed and extended.
Figure 4. This gives a lateral thoraco-lumbar exposure of one of the human living volunteers using the identified optimised combination of acquisition parameter settings (i.e. 80kVp, 32mAs, 130cm SID, anode towards the head, broad focus, OID=0cm (IR in contact with the volunteer ), and with no grid).
At the hospital where the human study took place, lateral thoraco-lumbar spine X-ray
imaging for Cobb method measurements is typically associated with an E of 1mSv
20
focus, and a grid (and hence no concerns for the OID). In contrast, as identified in
the human study, the combination of acquisition parameter settings associated with
suitable image quality from an E of 0.05mSv were 80kVp, 32mAs, 130cm SID,
anode towards the head, broad focus, OID=0cm (IR in contact with volunteer), and
no grid. This E of 0.05mSv represents a reduction of almost 95% from that used in
the hospital, and 83% from the average E used in the UK (0.3mSv) for lateral
thoracic or lumbar imaging34.
The current investigation was novel in that the complex effect of multiple acquisition
parameters (at their available settings) on image quality and dose was investigated
and resulted in a new X-ray practice that was tested successfully on living human
volunteers. In addition, obtained results could reduce risks of exposures on a large
population of spinal deformation patients whose assessment is based on Cobb or
superimposition method measurements. More importantly, although being focused
on Cobb and superimposition measurements, this paper presents a newly developed
and successful procedure for optimising different X-ray practices based on reducing
dose without affecting diagnostic image quality.
Nevertheless, further investigations in this area of research are needed. In particular,
parameters other than the ones investigated in the current paper as, for example,
other grid types need to be considered. Also, optimisation for people with different
sizes (not only normal-weight) should be considered. Additionally, although the
results from the study were tested on 9 healthy volunteers, studies on larger sample
sizes are needed to make generalisation of obtained practice possible. Finally, in the
current investigation and due to time restrictions and the huge number of tested
21
readings could be more precise.
Conclusion
This study was based on a new systematic optimisation procedure to identify the
settings of the main acquisition parameters that would produce a suitable lateral
thoraco-lumbar spine X-ray image for inter-vertebral angulation measurements using
Cobb and superimposition methods from the lowest E. The obtained acquisition
parameter settings and resultant optimised radiographic practice was then validated
by imaging healthy normal-weight male adult living human volunteers. The specific
optimised radiographic practice that emerged from this procedure produced suitable
image quality from ALARP E using anode towards the head, broad focus, no OID or
grid, 80kVp, 32mAs, 130cm SID. With an E of 0.05mSv, this is approximately 83%
less than the average E of 0.3mSv used in the UK30 for lateral thoracic or lumbar imaging. The new optimisation procedure was successful in identifying suitable
image quality whilst greatly reducing E. Although this procedure was developed for
lateral thoraco-lumbar spine exposures, it might also be adopted for the optimisation
of other radiographic procedures.
References:
[1] A. De Smet, S. Fritz, M. Asher, A method for minimizing the radiation exposure
from scoliosis radiographs. The Journal of Bone and Joint Surgery 63 (1981),
156-61.
[2] ICRP. Recommendations of the international Commission on Radiological
Protection, Publication 26, Oxford, Pergamon Press. ICRP 1977.
22
radiology. London: HMSO, Documents of the NRPB. 1990; 1(3).
[4] R. Berry, Striking a balance: benefit and risk in man's exposure to man-made
radiations. British Journal of Radiology 65 (1992), 1-8.
[5] T. Fauber, Radiographic imaging and exposure. 3 ed. Missouri, USA: Mosby
Inc., 2009.
[6] G. Hellström, L. Irstam, A. Nachemson, Reduction of radiation dose in
radiologic examination of patients with scoliosis. Spine 8(1983), 28-30.
[7] J. Cobb, Outline for the study of scoliosis: instructional course lectures, the
American Academy of Orthopaedic Surgeons. 1948.
[8] A. Begg and M. Falconer, Plain radiography in intraspinal protrusion of lumbar
intervertebral disks; a correlation with operative findings. The British Journal of
Surgery 36(1949), 220:225.
[9] G. Ardran, R. Coates, R. Dickson, Assessment of scoliosis in children: low dose
radiographic technique. British Journal of Radiology 53(1980), 140-146.
[10] S. Hallen, K. Martling, S. Mattsson, Dosimetry at x ray examinations of
scoliosis. Radiation Protection Dosimetry 43(1992), 49-54.
[11] J. Hansen, A. Jurik, B. Fiirgaard, Optimisation of scoliosis examinations in
children. Pediatric Radiology 33(2003), 752-65.
[12] A. Jónsson, K. Jonsson, K. Eklund, Computed radiography in scoliosis.
Diagnostic information and radiation dose. Acta Radiologica 36(1995), 429-33.
23
computed radiographic imaging system. Pediatric Radiology 20(1989), 85-86.
[14] J. Lescreve, R. Tiggelen, J. Lamoureux, Reducing the radiation dosage in
patients with a scoliosis. International Orthopaedics 13(1989), 47-50.
[15] A. Kalmar, P. Jones, R. Christopher, Low-Dose Radiography of Scoliosis in
Children: A Comparison of Methods. Spine 19(1994), 48-54
[16] C. Nash, E. Gregg, R. Brown, K. Pillai, Risks of exposure to X-rays in patients
undergoing long-term treatment for scoliosis. J Bone Joint Surg Am 61(1979),
371-374
[17] J. Hsu, J. Michael, J. Fisk, editors. AAOS atlas of orthoses and assistive
devices. 4 ed. Phalidelphia, USA: Mosby Inc., 2008.
[18] A. Servomaa and M. Tapiovaara, Organ dose calculation in medical x ray
examinations by the program PCXMC. Radiation Protection Dosimetry
80(1998), 213-19.
[19] Commission of the European communities: European guidelines on quality
criteria for diagnostic radiographic images. EUR 1620 EN, CEC, Brussels 1996.
[20] A. Viera and J. Garrett, Understanding interobserver agreement: the kappa
statistic. Family Medicine 37(2005), 360-3.
[21] F. Joseph, Measuring nominal scale agreement among many raters.
Psychological Bulleti 76(1971), 378-382
[22] P. Andreo, Monte Carlo techniques in medical radiation physics. Physics in
24
[23] D. Jones and B. Wall, Organ doses from medical x-ray examinations calculated
using Monte Carlo techniques. NRPB Publication NRPB-R186 (National
Radiological Protection Board, Chilton, Oxon) 1985.
[24] ICRP. The 2007 Recommendations of the International Commission on
Radiological Protection. ICRP Publication 103. Ann. ICRP 37 (2-4). 2007.
[25] A. Whitley, Clark's positioning in radiography. London, UK: Hodder Arnold,
2005.
[26] P. Hiles, A. Mackenzie, A. Scally, Recommended standards for the routine
performance testing of diagnostic X-ray imaging systems. Institute of Physics
and Engineering in Medicine 2005;Report No 91.
[27] E. Trout, J. Kelley, V. Larson, A comparison of an air gap and a grid in
roentgenography of the chest. American Journal of Roentgenology 124(1975),
404-11.
[28] K. Fung and W. Gilboy, “Anode heel effect" on patient dose in lumbar spine
radiography. British Journal of Radiology 73(2000), 531-36.
[29] S. Gorham and P. Brennan, The impact of focal spot size on clinical images
(Proceedings Paper). 2009.
[30] T. Curry, J. Dowdey, R. Murry, Christensen's physics of diagnostic radiology.
Philadelphia, USA: Lippincott Williams & Wilkins, 1990.
[31] P. Brennan and M. Nash, Increasing FFD: an effective dose-reducing tool for
25
[32] P. Brennan, S. McDonnell, D. O'Leary, Increasing film-focus distance (ffd)
reduces radiation dose for x-ray examinations. Radiation Protection Dosimetry
108(2004), 263-68.
[33] S. Etemadinezhad, S. Rahimi, Patient exposure dose for chest and skull
radiographies in Mazandaran hospitals. Rahimi, Xray Sci Technol. 18(2010),
87-91.
[34] B. Wall and D. Hart, Revised radiation doses for typical X-ray examinations.
Report on a recent review of doses to patients from medical X-ray examinations
in the UK by NRPB. National Radiological Protection Board. British Journal of
Radiology 70(1997), 437-39.
[35] J. Landis and G. Koch The measurement of observer agreement for categorical