A Comparative Approach to ECG Feature Extraction Methods
Fatemeh Molaei Vaneghi, Maysam Oladazimi, F. Shiman, Afshan Kordi, M.J. Safari, F. Ibrahim,
Member IEEE
Medical Informatics and Biological Micro-electro-mechanical Systems (MIMEMS) Specialized laboratoryDepartment of Biomedical Engineering, Faculty of Engineering University Malaya, 50603, Kuala Lumpur, Malaysia
[email protected] [email protected]
Abstract— This paper discusses six most frequent methods used to extract different features in Electrocardiograph (ECG) signals namely Autoregressive (AR), Wavelet Transform (WT), Eigenvector, Fast Fourier Transform (FFT), Linear Prediction (LP), and Independent Component Analysis (ICA). The study reveals that Eigenvector method gives better performance in frequency domain for the ECG feature extraction.
Keywords-ECG feature extraction, Eigenvector, Wavelet, ICA, AR, FFT, LP.
I. INTRODUCTION
Currently ECG is an easily accessible bioelectric signal which offers significant information regarding the cardiac abnormalities. Recently numerous feature extraction techniques have been established to determine the current state of cardiac activity through analysis of rhythms and distortions found in electrocardiogram. Morphological or timing statistical-based features [1] which are usually extracted from ECG signal include P and QRS widths, PQ/PR and QT intervals, P and T amplitudes, QRS height, and ST level. These features include both persistent and non-stationary characteristics of the ECG. Investigating both temporal and spatial assessments of cardiac activities has proven the superiority of spatial analysis for characterizing and classifying the ECG features [2] specially for ventricular arrhythmias which comprises evident sinusoidal-like disturbances. This study provides a review of six most common techniques used for ECG feature extraction.
II. METHODOLOGY
A. Auto Regression (AR)
Auto Regression (AR) has been suited well as a linear feature extraction technique for ECG signals and also for analysis of signals originating from heart rate, respiration and blood pressure. Modifying different parameters in AR model can significantly increase the precision and consistency of the classification. The AR model of order M
is given by [2]:
Where;
HR1 (n) and HR2 (n) Denote ECG time series,
e1 (n) Represents values of unknown zero means, e2 (n) Represents incorrect random variables,
a1 (j) and a2 (j) are the AR model coefficients. In order to estimate the order of this model the sum-squared error (SSE) is used [2]:
N stands for the number of sampling points within each segment. It has been observed that as the value of the modeling order (M) increases their corresponding SSE values decreases while for the modeling orders equal or greater than three it remains constant. Consequently it can be inferred that greater values of M increase the accuracy of the classification method. Comparing the 2-leads and single lead ECG signals, AR modeling has shown greater accuracy for the classification of the 2-lead ECG signals. Despite the significant accuracy of the AR modeling for classification purposes, its linearity may not represent well the ECG non-stationary nature.
B. Wavelet Transform (WT)
Since Wavelet transform can provide good localization in frequency and time domain simultaneously, it has been performed greatly for the local analysis of non-stationary signals. A single wavelet can be defined by [3]:
The inner product of and function f gives wavelet transform as follows [3]:
Lipschitz exponents have been used as a method to measure a function local regularity [4]. A function is defined as Lipschitz ( is denoted as Lipschitz exponent) at x0, if and only if two constants A and h0 (>0) can be presented such that for h h0:
Where pn (h) represents a polynomial of order n being a positive integer. Let W f(x) be defined as the wavelet transform of function f(x) so a modulus can be maximum at any point x0 if:
If the wavelet transform of a function has no modulus maxima within a given interval, the function is Lipschitz while is close enough to one in that specific interval. In other words it can be concluded that a function cannot be singular within an interval if its wavelet transform does not have any modulus maxima of fine scales in that specific neighborhood [3]. Detailed processing of ECG signal through detecting its modulus maxima and also zero cross is obtained by performing the Wavelet multi-scale decomposition of the signal. As a result the number and location of the QRS complexes can be defined accurately via this processing. Despite the great superiority of wavelet method, there are also some conditions which it may not perform properly. The presence of arrhythmia which may lead to inaccurate detection of QRS complexes or applying 3-lead actual gathering system of ECG signal which may cause loss of some important information of the signal are among the conditions which can limit the efficiency of the Wavelet transform.
C. Eigenvector
Eigenvector method acts based on Eigen decomposition of the correlation matrix of a noise corrupted signal to estimate its power spectral density (PSD). Even if the signal-to-noise (SNR) ratio is low, eigenvector methods can still produce high resolution frequency spectra of the signal. So these methods are best suited for signals composed of noisy sinusoids. To reduce the adverse effect of the noise on the outcome, only the principle eigenvector components are retained during the estimation of the autocorrelation matrix. There are a large number of different eigenvector methods including Pisarenko, Multiple Signal Classification (MUSIC), and Minimum-Norm which have been applied to estimate the signal spectral power.
The Pisarenko method is useful to estimate PSDs with sharp peaks at the expected frequencies. Pisarenko method
produces the PSD of the signal using the eigenvector corresponding to the minimum eigenvalue, to do so the polynomial A(f) is used:
Where ak represents coefficients of the desired polynomial and m represents the eigenfilter order. MUSIC method on the other uses the average spectra of all the eigenvectors relating to the noise subspace to eliminate the adverse effects of spurious zeros. The resulting PSD can be estimated via:
Where K and Ai(f) respectively represent the noise subspace dimension and desired polynomial. Minimum-Norm is another method which differentiates between real and spurious zeros through calculation of a desired noise subspace vector using the eigenvectors of the signal or the noise. As compared to the Pisarenko method, this method applies a linear combination of all noise subspace eigenvectors [5] For this method PSD is calculates by:
K represents the dimension of the noise subspace. The values of the PSDs are the features which represent the ECG signal and also provide different classes corresponding to it. The superior performance of the MUSIC method for ECG analysis in frequency domain has been proven while both MUSIC and Minimum-Norm methods show identical spectral characteristics with nearly the same frequency peaks [6].
D. Fast Fourier Transform (FFT)
FFT represents a method for extracting helpful information out of statistical features of ECG signal. Assuming T0 as period of periodic signal f(t) that could be demonstrated by the Fourier series [7, 8]:
n Represents complex coefficients of the Fourier series
Restricted numbers of frequency coefficient are enough for monitoring purposes since ECG frequency bands are limited to 0.05-40 Hz. The efficiency of computation of FFT algorithm is good but it suffers from two bold limitations. First, the quantization value or the space between adjacent frequencies in discrete spatial domain is the reciprocal of the time duration in temporal domain. The big space resulted from short data records makes it very difficult to document the modification in the dominant frequencies of ventricular fibrillation over short time periods.
Second is the presence of finite epochs in data which produce frequency components in the analysed data that do not correspond to the frequency components of discrete spectrum. This causes the spectrum peaks numbers to increase [9, 10] This leakage reduces the FFT ability to resolve two t frequencies of close space. Although application of a window function will reduce this leakage but it also decreases the FFT resolving power [11].
E. Linear Prediction (LP)
Another method which could be applied to analyze ECG signals is Linear Prediction (LP). LP is accurate in estimation of signal parameters and also faster computation is one the most efficient characteristics of the LP technique. This method operates based on the idea that a sampled ECG data can be approximately estimated from past samples with linear combination. The actual ECG sequence S(i) can be approximated by another sequence (i) which is further determined by a distinctive set of predictor coefficients and the past P samples as follows:
Where a (k) denotes the K th linear predictive coefficient (LPC). Here e (i) is a difference between predicted and actual sequence of ECG which is named by Residual Error Signal (RES) [12].
In linear systems S(i)
is
the output of a Pth order finite impulse response filter whose system function is defined as:Also the RES is the result of the system in which the transfer function can be comes out by z transform of equation (16) as follow:
For an ECG analysis algorithm which is performed using the LP method the following facts are of great importance:
1) The linear prediction cannot have great values since the sampling frequency of ECG data is normally below 1000 Hz. The higher the speed the lower the prediction order is.
2) It has been indicated that the Linear Prediction Coefficients (LPC) cannot give detailed information regarding the ECG signal no matter how high is the order of the system.
3) Residual Error Signals (RES) corresponding to each ECG data set, provide significant features of the ECG signal on the portion of QRS-complexes. Hence more emphasis should be placed on it as compared to LCPs.
F. Independent Component Analysis (ICA)
Independent component analysis (ICA) is a method searches for multivariate statistics of underlying factors which are statistically independent [13]. ICA has been applied to various areas in the field of biomedical signal processing including blind electrogastrogram (EGG) separation [14], separation of fetal and maternal ECG signals [15], EEG and MEG recordings analysis [16], and characterization of ECG signals [17, 18]. However, ICA usually produces a large number of independent components (ICs) in an arbitrary order which necessitate dimension reduction in the feature space. On the other hand, random order of the ICs makes it difficult to determine the relative significance of each IC to be obtained in the task.
ICA produces a set of random variables as linear combinations of statistically independent components [19]. Assuming the observed m random variables x1(t), …, xm(t)
are modeled at time instant t, as linear combinations of n
random variables s1(t), . . . , sn (t). Applying the
vector-matrix notation, the mixing model is [19-22]:
where x(t) = [x1(t), . . ., xm(t)] represents the mixing
signal, s(t) = [s1(t), . . ., sn(t)]T is the source signal, and A
represents the mixing matrix with real coefficients aij, (i =
1,. . .,m; j = 1,. . .,n).
III. PERFORMANCE OF THE METHODS
Performance of the six ECG feature extraction techniques and their sensitivity and specificity are evaluated using quantitative parameters. The results summarized in Table I and II [2, 5, 7, 12, 23-25] using ventricular late potential detection in terms of their sensitivity and specificity.
TABLE I.COMPARING THREE ECG FEATURE EXTRACTION METHODS IN TERMS OF THEIR SENSITIVITY AND SPECIFICITY
Method FFT AR WT LP Eigenvector ICA Sensitivity 81% 97.28% 61% 96.9% 97.78% 97.8% Specificity 98% 97.3% 75% 80.4% 99.25% 99%
The results of comparing spectral components of heart rate variability (HRV) achieved by either AR or FFT analysis revealed significantly different HRV estimations. FFT showed better results as compared to AR [26]. However, AR model results in so many missing and null values while all of the spectral components can be obtained using FFT. AR modelling is much more sensitive to the onset of time analysis comparing to the FFT. Furthermore it has been shown that for both FFT and AR methods their reproducibility significantly decreases for short-term recordings [27].
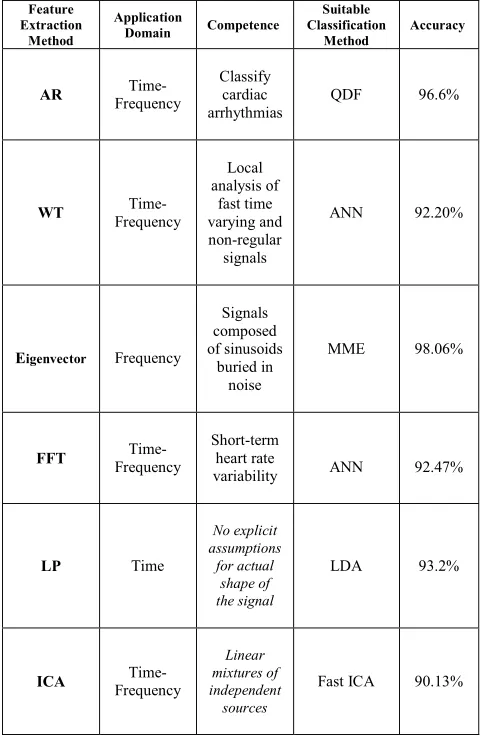
According to statistical analysis, MUSIC and Minimum-Norm methods have been demonstrated better performance comparing to Pisarenko method since the latter one produces extra peaks. While LP technique reduces the computation complexity but it also provides less accurate results comparing to other methods due to its linearity. Table II presents a brief summary of the feature extraction methods along with their characteristics [2, 5, 7, 12, 23-25, 28].
EXTRACTION METHODS
Feature Extraction
Method
Application
Domain Competence
Suitable Classification
Method
Accuracy
AR
Time-Frequency
Classify cardiac arrhythmias
QDF 96.6%
WT
Time-Frequency
Local analysis of
fast time varying and non-regular signals
ANN 92.20%
Eigenvector Frequency
Signals composed of sinusoids
buried in noise
MME 98.06%
FFT
Time-Frequency
Short-term heart rate
variability ANN 92.47%
LP Time
No explicit assumptions
for actual shape of the signal
LDA 93.2%
ICA
Time-Frequency
Linear mixtures of independent sources
Fast ICA 90.13%
QDF: Quadratic Discriminate Function. ANN: Artificial Neural Network.MME: Modified Mixture of Experts. LDA: Linear Discriminant Analysis
IV. CONCLUSION
[image:4.612.313.554.94.463.2]ACKNOWLEDGEMENTS
This research is supported and funded by the prime Minister’s Department, Malaysia, through a special grant Project No. 66-02-03-0061/H-00000-37039.
REFERENCES
[1] G. D. Clifford, et al., Advanced methods and tools for ECG data analysis: Artech House, 2006.
[2] Z. gen Zhang, et al., "Pattern recognition of cardiac arrhythmias using scalar autoregressive modeling," 2004, pp. 5545-5548 Vol. 6.
[3] N. Li and P. Li, "A Switching Method Based on FD and WTMM for ECG Signal Real-Time Feature Extraction," 2009, pp. 828-830.
[4] S. Mallat, "Zero-crossings of a wavelet transform,"
Information Theory, IEEE Transactions on, vol. 37, pp. 1019-1033, 1991.
[5] E. Ubeyli, et al., "Eigenvector methods for analysis of human PPG, ECG and EEG signals," 2007, pp. 3304-3307.
[6] E. D. Übeyli and . Güler, "Improving medical diagnostic accuracy of ultrasound Doppler signals by combining neural network models," Computers in Biology and Medicine, vol. 35, pp. 533-554, 2005.
[7] R. Maniewski, et al., "Time-frequency methods for high-resolution ECG analysis," 1993, pp. 1266-1267 vol. 3. [8] M. B. Tayel and M. E. El-Bouridy, "ECG images
classification using artificial neural network based on several feature extraction methods," 2008, pp. 113-115. [9] R. Challis and R. Kitney, "Biomedical signal processing
(in four parts)," Medical and Biological Engineering and Computing, vol. 28, pp. 509-524, 1990.
[10] R. Challis and R. Kitney, "Biomedical signal processing (in four parts)," Medical and Biological Engineering and Computing, vol. 29, pp. 1-17, 1991.
[11] S. M. Kay and S. L. Marple Jr, "Spectrum analysis—a modern perspective," Proceedings of the IEEE, vol. 69, pp. 1380-1419, 1981.
[12] K. Noponen, et al., "Electrocardiogram Quality Classification based on Robust Best Subsets Linear Prediction Error."
[13] A. Hyvarinen, "Fast and robust fixed-point algorithms for independent component analysis," Neural Networks, IEEE Transactions on, vol. 10, pp. 626-634, 1999.
[14] Z. Wang, et al., "Blind EGG separation using ICA neural networks," 1997, pp. 1351-1354 vol. 3.
[15] L. De Lathauwer, et al., "Fetal electrocardiogram extraction by blind source subspace separation,"
Biomedical Engineering, IEEE Transactions on, vol. 47, pp. 567-572, 2000.
[16] R. Vigário, et al., "Independent component approach to the analysis of EEG and MEG recordings," Biomedical Engineering, IEEE Transactions on, vol. 47, pp. 589-593, 2000.
[17] M. Owis, et al., "Characterisation of electrocardiogram signals based on blind source separation," Medical and Biological Engineering and Computing, vol. 40, pp. 557-564, 2002.
[18] G. G. Herrero, et al., "Feature extraction for heartbeat classification using independent component analysis and matching pursuits," 2005, pp. iv/725-iv/728 Vol. 4. [19] A. Hyvärinen, et al., Independent component analysis vol.
26: Wiley-interscience, 2001.
[20] A. J. Bell and T. J. Sejnowski, "An information-maximization approach to blind separation and blind deconvolution," Neural computation, vol. 7, pp. 1129-1159, 1995.
[21] J. F. Cardoso and B. H. Laheld, "Equivariant adaptive source separation," Signal Processing, IEEE Transactions on, vol. 44, pp. 3017-3030, 1996.
[22] A. Hyvärinen and E. Oja, "A fast fixed-point algorithm for independent component analysis," Neural computation, vol. 9, pp. 1483-1492, 1997.
[23] S. N. Yu and K. T. Chou, "Selection of significant independent components for ECG beat classification," Expert Systems with Applications, vol. 36, pp. 2088-2096, 2009. [24] D. F. GE, et al., "Study of Feature Extraction Based on
Autoregressive Modeling in EGG Automatic Diagnosis,"
Acta Automática Sinica, vol. 33, pp. 462-466, 2007. [25] G. R. H. Sandercock, et al., "The reliability of short-term
measurements of heart rate variability," International journal of cardiology, vol. 103, pp. 238-247, 2005.
[26] D. Chemla, et al., "Comparison of fast Fourier transform and autoregressive spectral analysis for the study of heart rate variability in diabetic patients," International journal of cardiology, vol. 104, pp. 307-313, 2005.
[27] M. V. Pitzalis, et al., "Short-and long-term reproducibility of time and frequency domain heart rate variability measurements in normal subjects," Cardiovascular research,
vol. 32, p. 226, 1996.