International Journal of Emerging Technology and Advanced Engineering
Website: www.ijetae.com (ISSN 2250-2459, ISO 9001:2008 Certified Journal, Volume 8, Issue 2, February 2018)
96
Classifiers for Detection of Retinal DME Diseases in
B-SCAN OCT Images using Image Processing Techniques
Puspita Dash
1, Dr. AN. Sigappi
21Research Scholar, 2Associate Professor, Department of Computer Science and Engineering, Annamalai University, Chidambaram, Tamil Nadu. India.
Abstract-- Optical Coherence Tomography (OCT) is a technique widely used by ophthalmologists for diagnosis of retinal diseases. In this paper to detect the patients containing Diabetic Macular Edema affected diseases in B-Scan OCT images. This paper proposed image processing features extraction method with classification approach for the detection of Diabetic Macular Edema (DME) from retina OCT images of patients. Histogram of Oriented Gradients (HOG) descriptors are extracted from OCT images to constitute the feature vectors that are subsequently used by Naïve Bayes and SVM are two different classifiers to classify whether the OCT image is normal or DME affected. In this work datasets with 45 OCT images (14 normal and 31 DME affected patients images) is used for training and testing the classifiers. The performances of the two classifiers are compared with respect to accuracy, sensitivity and specificity. The results indicate that SVM gives better accuracy of 100% than Naïve Bayes classifier and hence more effective for detection of DME in OCT images.
Keywords: Diabetic Macular Edema (DME), Histogram of Oriented Gradients (HOG), Naïve Bayes Classifier, Optical Coherence Tomography (OCT), SVM.
I. INTRODUCTION
Optical Coherence Tomography (OCT) is a Non-invasive, Non-contact, No- radiation, Painless and Fast procedure tool used in Ophthalmology for visualizing the cross sectional images of layers of the retina to detect a variety of retinal diseases [1], which is important for assessing the response to treatment.
The retina present in the human eye has ten layers and several diseases may affect the retinal layers .Macula is a part of the retina and swelling or thickening the portion of the macula due to leaking blood vessels is called Diabetic Macular Edema (DME) and usually retina thickness is located 500 or less than from centre of the macula [2].
Every year in the world approximately 30 to 40 million people are affected by macular edema. OCT is the one of the imaging modalities used for detecting DME and other abnormalities in the eye in early stages.
In this paper we present an image processing methods for classification of normal and DME affected patients of retinal OCT images.
In this method, Histogram of Oriented Gradients (HOG) descriptors are used as a feature vectors and SVMs and Naive Bayes classifiers are used to classify the OCT images to aid in the detection of normal and DME affected patients. The extracted feature vector is classified using the two classifiers algorithms and the performance of the classifiers on 45 OCT images is studied with respect to three measurement parameters namely specificity, sensitivity and accuracy.
II. RELATED WORK
Gopinathann S et al [3] presented a work describing a number of filters such as Lee Filter, Frost Filter, Kuan Filter, Weiner Filter, Median Filter and SRAD (Speckle Reducing Anistrophic Diffusion) .Filter that are applied to the images such as Photographic, Ultrasound, SAR, PET, CT and MRI.
Ali A.Pouyanet al [4] presented a co-occurrence matrix for feature extraction and multilayer perception (MLP) classification has been used for detection of retina layers.
S. J. Chiu [5] presented an automatic approach for successfully segmenting seven retinal layers in SDOCT images using graph theory and dynamic programming.
A. Sopharak [6] presented an approach for automatic exudates detection in images acquired through non-dilated pupils and conducted a series of experiments on feature selection and exudates pixel classification using Naive Bayes classifier.
Abdul Rehaman.K [7] proposed image processing techniques such as local binary patterns, adaptive thresholding and the K-Nearest neighbor algorithm for the early detection of glaucoma.
Amineh. Naseri et al [8] proposed a technique for automatic detection of retina layers using co-occurrence matrix for feature extraction, texture analysis and a neural network and a supervised learning method for classification.
International Journal of Emerging Technology and Advanced Engineering
Website: www.ijetae.com (ISSN 2250-2459, ISO 9001:2008 Certified Journal, Volume 8, Issue 2, February 2018)
97 III. METHODOLOGY
[image:2.612.335.539.137.210.2]The proposed methodology for detection of DME diseases from OCT images using image processing techniques is presented in the block diagram is shown in figure 1.
Figure 1.Methodology for DME detection.
A. Retinal OCT Images
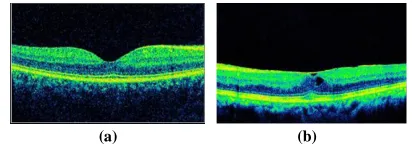
The following figure 2 (a) and (b) shows the normal and DME affected of original OCT images of retina.
(a) (b) Figure 2. (a) Original normal image (b) Original DME affected image
Region of Interest (ROI):
Before preprocessing and extracting the features vectors, it is required to flatten and cropped of each OCT image to focus on the region of interest of the retina that contains sufficient variation between affected diseases classes. The flattened cropped region of interest of the normal and DME affected OCT images are shown in Figure 3(a) and (b).
(a) (b)
Figure 3. (a) ROI of normal image. (b) ROI of DME affected image.
B. Preprocessing
In OCT image processing, the preprocessing methods involve RGB to gray scale conversion, Gaussian and Weiner filtering. The output of gray scale conversion is shown in Figure 4 (a) and (b) respectively.
(a) (b)
Figure 4. (a) Gray scale of normal image. (b) DME affected images.
Gaussian filtering:
The OCT images are corrupted by speckle noise due to high frequency sound waves, so it is de-noise them to reduce the effect of noise on the classification results. In this work, Gaussian filtering method is to remove the speckle noise and is used to blur and effective at smoothing OCT images shown in Figure 5 (a) and (b).With this images need to use the two-dimensional Gaussian functions given by Equation (1),
(1)
Weiner filter:
Weiner filter is an inverse filtering and noise smoothing image restoration technique. It’s to remove the blurred and additional noise present in the images by Gaussian filter and with a compression operation it is minimize the mean square error during remove noise filtering operation. Weiner filter in Fourier transform can be expressed in the following Equation (2),
(2)
Where
, are the power spectra of original
OCT image and additive noise and is the blurring
filter.
The Gaussian and Wiener filtering of these images are shown in Figure 5 (a), (b) and Figure 6 (a), (b) respectively. These filtered images are given to the feature extraction process to detect the retinal diseases of OCT images.
OCT
images
Feature Extractio n
Classificatio n by SVM/Naïve Bayes Preproces
[image:2.612.39.286.200.277.2] [image:2.612.61.278.334.396.2] [image:2.612.67.273.512.584.2]International Journal of Emerging Technology and Advanced Engineering
Website: www.ijetae.com (ISSN 2250-2459, ISO 9001:2008 Certified Journal, Volume 8, Issue 2, February 2018)
98
Training images
Classifica tion using SVMs /Naïve Bayes
Normal image
DME affected image Feature
Vector Extraction Test images
(a) (b)
Figure 5. (a)Gaussian filtered of normal image (b) DME affected image
(a) (b)
Figure 6 (a) Weiner filtered normal image (b) DME affected image.
C. Feature extraction
In this work, histograms of oriented gradients (HOG) feature descriptors are extracted from ROI of retinal preprocessing OCT images. HOG is a feature descriptor vector algorithm used to detect the presence of disease within the macula in OCT image processing.HOG is based on evaluating well-normalized local histograms of image gradient orientations in a dense grid [10]. HOG feature descriptor converts an image of any size into a feature vector and from the original image of size 912x642 the cropped image is used for calculating HOG feature descriptor. The extracted HOG feature vectors are given to the SVM and Naïve Bayes classifier to classify normal and DME affected OCT images. HOG descriptor implemented
in matlab using extractHOGFeatures(). The algorithm for HOG descriptor feature is as follows:
The cropped input image with size of 100x100 and image is divided into regions or 16x16 cells.
Gradient of an image for each pixel is computed with x and y axis and gradient mask of the image is calculated by
The mask with original image to obtain the gradient of the image by
Compute the magnitude and direction of the gradient using following formula.
Calculate the histogram of gradient in 16x16 cells and extracted feature vector is calculated by comparing the magnitude and direction of the gradient and place them into the 9 histogram bin.
The set of normalized block of histograms represents the descriptors and normalization block. The descriptor block is determined by histogram bin. The combined histogram entries are used as the HOG feature vector of the image.
Hog descriptors are used for detection of DME affected diseases and recognition by providing them as features to a SVM and Naïve Bayes classifier’s algorithm for classification.
D. Classification using SVMs and Naive Bayes
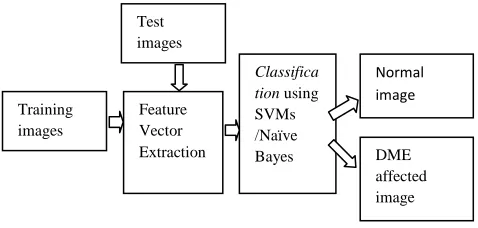
[image:3.612.59.278.101.311.2]After extracting the HOG features from the retinal OCT images the feature vectors are fed into the SVMs and Naïve Bayes classifiers and the steps involved are shown in Figure 7. The classifiers are trained and tested with normal and abnormal images separately and compared with all performance parameters accuracy of SVM classifier better than of Naïve bayes classifier. The SVM classifier takes 0. 18 seconds and Naïve bayes Classifiers took 0. 07 seconds better to build training process model of one-versus-one classifiers.
Figure 7.Stages in classification.
i. SVM classifier
[image:3.612.316.555.431.545.2]International Journal of Emerging Technology and Advanced Engineering
Website: www.ijetae.com (ISSN 2250-2459, ISO 9001:2008 Certified Journal, Volume 8, Issue 2, February 2018)
[image:4.612.73.275.143.248.2]99 Figure 8: Architecture of SVM
ii. Naive Bayes Classifier:
In this work Naïve Bayes classifier is applied to classify the extracted HOG features of OCT images into normal and DME affected. The Naïve Bayes classifiers are supervised machine learning probabilistic classifiers based on Bayes’ theorem [12]. A probabilistic approach is used to predict the probabilities of one class with another higher probabilities class. To classify a feature vector of a class, the probabilities of each class either normal or DME is calculated .The test feature vectors are given to the classifier and they are assigning to the class with the highest probability. Naive Bayes is a conditional probability model and the probabilities of the extracted feature vectors of retinal images is given in the following Equation (3) according to Naïve Bayes classifier’s Bayes theorem problem. The images are classified as normal and DME affected using the following probability function.
(3)
Where
V is the feature vectors of OCT images.
In this classifier V belongs to class is the
probability of the extracted features of normal and DME affected images.
is the posterior probability of normal and DME
images.
is the prior probability of the training data of DME
affected images.
is the prior probability of hypothesis.
The feature vector is classified using naïve bayes classifier in the following Equation (4).
(4)
Where C is a class and X ( is the feature
vector.
The advantage of Naïve Bayes Classifier is to minimize the training time than of the SVM classifier.
IV. EXPERIMENTAL RESULT AND PERFORMANCE
MEASUREMENT
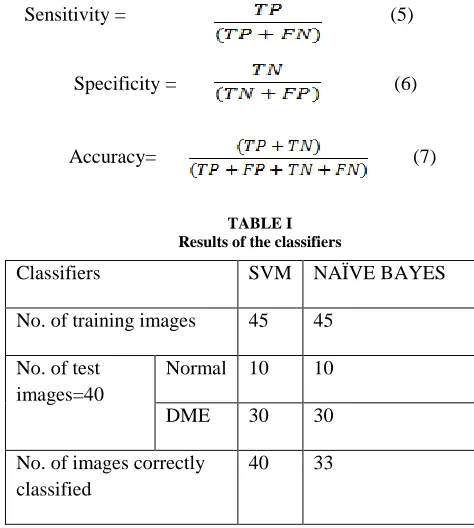
In this experiment, OCT images of 45 datasets are acquired from Jyoti eye care, Puducherry. Out of forty five 14 are normal and 31 are DME affected images. Using both classifiers 45 OCT image data sets are used for training and after training for testing 40 images 10 normal and 30 DME affected OCT images are used for classification. The Experiments were carried out to evaluate and compare the performance of classifiers for the detection of retinal diseases. After classifying the retinal OCT images the performance measure are calculated by creating Confusion matrix and result shown in Table 1. The performance measures calculated using the Equations (5) to (7) and classification results are presented in Table 2.
Sensitivity = (5)
Specificity = (6)
Accuracy= (7)
TABLE I Results of the classifiers
Classifiers SVM NAÏVE BAYES
No. of training images 45 45
No. of test images=40
Normal 10 10
DME 30 30
No. of images correctly classified
[image:4.612.332.569.409.673.2]International Journal of Emerging Technology and Advanced Engineering
Website: www.ijetae.com (ISSN 2250-2459, ISO 9001:2008 Certified Journal, Volume 8, Issue 2, February 2018)
[image:5.612.43.286.161.343.2]100 TABLE II
Performance measurement of the classifiers
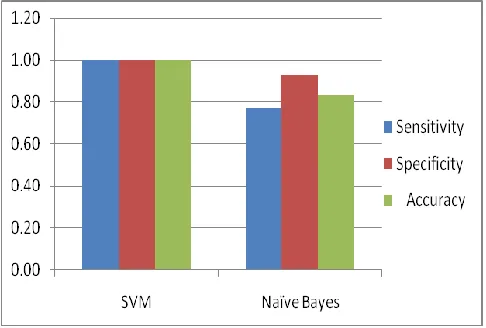
The graph figure 9 shows a comparison of the performance measurement parameters of SVM and Naïve Bayes classifiers .The SVM method yield 100% better accuracy than of Naïve Bayes classifier .
Figure 9. Graph for Comparison of performance measurement of the classifiers.
V. CONCLUSION
In this work, image processing methods for the capable of detection of patients containing Diabetic Macular Edema affected diseases in B-Scan OCT images have been proposed. In this for the detection and classification of both retinal normal and DME diseases affected of 45 OCT images collected datasets with the size of 912x642 dimensions are trained and tested.
Initially the images are accurately de-noised using both Gaussian and Weiner filtering method without affecting the image quality and smoothing the OCT images for detection and classification. Using HOG descriptor method the extracted features are accurately detected the DME affected diseases and among these features the SVM and Naïve Bayes classifiers are used to detect the DME diseases as well as classify the normal and DME retinal diseases. It has been improved to identify the features and produce more accurate good detection results. Naïve bayes Classifiers took 0. 07 seconds better to build training process model than of SVM classifier.SVM is successfully used to detect the diseases and classify the normal and DME affected OCT images. In this proposed work comparison of these two classifiers the experimental results shows SVM classifier better performance was found with accuracy, specificity and sensitivity 100% than of Naïve Bayes classifiers for the detection of patients containing DME affected diseases. Thus this work result has been given information about DME disease detection and classification results of OCT images successfully which is help to diagnose the diseases.
Acknowledgements
We are special thanks to ophthalmologist of Jyoti Eye Care Hospital and Raghu eye clinic, Puducherry for providing us B-Scan OCT images which is required for this work.
REFERENCES
[1] Joel S.Schuman,”Introduction to Optical Coherence Tomography,” 5 October, 2012.
[2] M.Dharmalingam,”Diabetic retinopathy-risk factors and strategies in prevention,” Laser, vol.51, pp.77, 2003.
[3] Gopinathann S,"Enhancement of images with speckle noise reduction using different filters,” IJASER, Vol.4, issue 3, 2015. [4] Ali A.Pouya, Amineh Naseri, Nader.Kavian , ”An Image Processing
Technique to Detecting Retinal Layers,” ICSIP(IEEE), 15-17 December 2010.
[5] S. J. Chiu, X. T. Li, P. Nicholas, C. A. Toth, J. A. Izatt, and S. Farsiu, “Automatic segmentation of seven retinal layers in SDOCT images congruent with expert manual segmentation,” Opt. Express 18(18), 19413–19428 (2010).
[6] A. Sopharak, K. Thet Nwe, Y. Aye Moe et al., “Automatic Exudate Detection with a Naive Bayes Classifier,” in The 2008 International Conference on Embedded Systems and Intelligent Technology, Bangkok, Thailand, 2008.
[7] Abdul Rehaman.K , Rashmi Ravi , Vishwas M Shetty and Vivek Hegde “Image Processing Techniques for Glaucoma Detection: A Survey,” IJMETMR., Vol.3,issue 4,april 2016.
Parameters SVM NAIVE BAYES
TP 26 20
TN 14 13
FP 0 1
FN 0 6
Sensitivity 100% 77%
Specificity 100% 93%
[image:5.612.46.289.400.564.2]International Journal of Emerging Technology and Advanced Engineering
Website: www.ijetae.com (ISSN 2250-2459, ISO 9001:2008 Certified Journal, Volume 8, Issue 2, February 2018)
101 [8] Amineh. Naseri ,Ali.Pouyan and Nader.Kavian “Automatic
Detection of Retina Layers using Texture Analysis”, International Journal of Computer Applications (0975 – 8887) Volume 46– No.1, May 2012.
[9] N. Anantrasirichai, A. Achim, J. E. Morgan, I. Erchova, and L. Nicholson, “SVM-based texture classification in Optical Coherence Tomography,” in 2013 IEEE 10th International Symposium on Biomedical Imaging (ISBI)(2013), pp. 1332–1335.
[10] N.Dalal and B.Triggs,”Histograms of oriented gradients for human detection,” in proceeding of the IEEE Compute Society Conference on Computer Vision and Pattern Recognition,vol. 1,pp.886-893,San Diego,Calif,USA,2005.
[11] C. Burges. “A tutorial on support vector machines for pattern recognition. Data Mining and Knowledge Discovery, “2(2):121– 167,( 1998).
[12] K.Ming Leung “Naïve Bayesian Classifier,” November 28,2007.