International Journal of Emerging Technology and Advanced Engineering
Website: www.ijetae.com (ISSN 2250-2459, ISO 9001:2008 Certified Journal, Volume 4, Issue 6, June 2014)
818
Study on Genetic Variability and Seed Quality of Groundnut
(Arachis hypogaea L.) Genotypes
Mukesh Kumar Maurya
1, Prashant Kumar Rai
2, Arvind Kumar
3and Bazil A. Singh
4, A. K. Chaurasia
52
Assistant Professor, 5Associate Professor, 3,4Ph.D. Scholar, Department of Genetics and Plant Breeding, Allahabad School of Agriculture
Sam Higginbottom Institute of Agriculture, Technology and Sciences, Allahabad- 211007, Uttar Pradesh, India.
Abstract-- Fifteen groundnut genotypes (including check) obtained from ICRISAT, Hyderabad evaluated for qualitative parameters. The crop was sown during wet season 2013 at Field Experimentation Center of the Department of Genetics and Plant Breeding, Faculty of Agriculture, SHIATS, Allahabad Uttar Pradesh. The experiment was laid out in Randomized Block Design with three replications, 13 quantitative parameters were studied. The analysis of variance revealed the prevalence of significant different among the genotypes for all studied parameters viz. Field emergence, Days to 50% flowering, Plant height, Number of primary branches, Days to maturity, Pod yield per plant, Pod yield, Seed yield per plant, Seed index (Hundred kernels weight), Shelling percentage, Kernel yield, Sound matured kernels and Kernel uniformity. Based on per se performance genotypes ICG 2772, ICG 2777 and ICG 3027 were found to best for pod yield per plant. High to moderate estimates of GCV and PCV were exhibited by kernel yield q/ha, pod yield q/ha, pod yield per plant(g), plant height(cm), indicating that these character could be used selection indices for crop improvement. The exhibited high values for heritability (broad sense), seed index, Days to 50 % flowering followed by matured kernel and plant height. Exhibited high values for genetic advance pod yield per plant, seed yield per plant followed by field emergence and seed index. Depicted high values for genetic advance as mean percent kernel yield, pod yield followed seed yield per plant and pod yield per plant. Data was submitted to BOLD for selected groundnut genotypes with genotype ICG 2381 identified as best genotype for pod length and Genotype ICG 2106 identified as best genotype for pod width. Genotype ICG 2381, ICG 2511 and ICG 2857 identified as very testy. “Groundnut SHIATS” title to derived specimens with authoritative taxonomic identification. So these genotypes are better preferred for consumed directly by humans.
Keywords-- Groundnut, GCV, PCV, Heritability, Genetic Advance, Quantitative Parameters.
I. INTRODUCTION
Groundnut (Arachis hypogaea L.), family, Leguminosae
an important crop among oilseeds, is a self pollinated, chromosome no. (2n=40) grown in tropical and sub-tropical regions of the world.
Groundnut (Arachis hypogaea L.) is believed to be the
native of Brazil. It was introduced into India during the first half of the sixteenth century from one of the Pacific islands of China, where it was introduced earlier from either Central America or South America. India is the second largest producer of groundnut after China. Groundnut is the largest oilseed in India in terms of production. Groundnut is one of the most important cash crops of our country. Groundnut has other anonymous each peanut, earthnut, monkey nut, goober, panda and manila nut. Groundnut is the also known as “The king of oilseeds”.
Groundnut contains on the average 12-15%
carbohydrates, 25-30% protein and 45-50% oil. The nuts may be chewed uncooked, but are usually eaten boiled or roasted. The nuts can also be boiled, fried, ground into groundnut butter, or crushed for oil. Groundnut butter is extensively used in the preparation of soup and as bread
spread (Tsigbey, et al. 2004).
India is largest grower and second producer after china, the average productivity of groundnut is about 0.98 tones/ ha, which is very much lower than the world average of 1.62 tones/ha. In India its cultivation mostly confined to the
southern states viz., Gujarat, Karnataka, Andhra Pradesh,
Tamil Nadu and Maharashtra. The other important states growing groundnut area were Madhya Pradesh, Rajasthan, Uttar Pradesh and Punjab. The area under groundnut cultivation in Uttar Pradesh during 2011-2012 was 0.17 million hectare and production was 0.39 million tons (Anonymous, 2012).
International Journal of Emerging Technology and Advanced Engineering
Website: www.ijetae.com (ISSN 2250-2459, ISO 9001:2008 Certified Journal, Volume 4, Issue 6, June 2014)
819
II. MATERIALS AND METHODSFifteen groundnut genotypes were received from International Crop Research Institute for the Semi Arid Tropics (ICRISAT), Patancheru, Hyderabad, Andhra Pradesh, India were evaluated at field experimentation center, Department of Genetics and Plant Breeding, SHIATS, Allahabad, during wet season 2013. The experiment was laid out in Randomized Block Design (RBD) having three replications with 35 cm inter and 10
cm intra row spacing. The observations were recorded on
five randomly selected plants from each replication for
various characters viz. field emergence percentage, days to
50% flowering, plant height, primary branches/plant, days to maturity, pod yield/plant, pod yield, seed yield/plant, hundred kernel weight, sound mature kernels, kernel uniformity, shelling percentage, kernel yield. Analysis of
variance to test the significance difference among
accessions for each character was carried out as per
methodology suggested by Panse and Sukhatme (1967).
PCV and GCV were calculated by the formula given by Burton (1952), heritability in broad sense (h2) was worked
out by using formula suggested by Lush (1949), Burton
and Devane (1953) and genetic advance i.e. the expected genetic advance were calculated by using the procedure
given by Lush (1949), Johnson et al., (1955).
III. RESULTS AND DISCUSSION
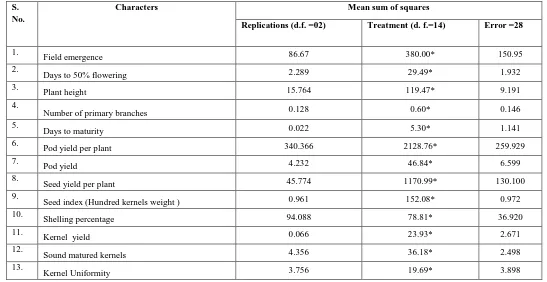
[image:2.612.32.579.381.663.2]The analysis of variance for different characters is presented in Table 1 the mean sum of squares due to genotypes showed significant difference for all 13 quantitative characters studied. The mean sums of squares were suggesting that the selected genotypes were genetically variable and considerable amount of variability existed among them. Similar results were also reported by Korat et al., (2009) and Savaliya et al., (2009).
Table 1.
Analysis of variance for 13 quantitative Characters in 15 Groundnut genotypes (including check) during Wet season2013.
S. No.
Characters Mean sum of squares
Replications (d.f. =02) Treatment (d. f.=14) Error =28
1.
Field emergence 86.67 380.00* 150.95
2.
Days to 50% flowering 2.289 29.49* 1.932
3.
Plant height 15.764 119.47* 9.191
4.
Number of primary branches 0.128 0.60* 0.146
5.
Days to maturity 0.022 5.30* 1.141
6.
Pod yield per plant 340.366 2128.76* 259.929
7.
Pod yield 4.232 46.84* 6.599
8.
Seed yield per plant 45.774 1170.99* 130.100
9.
Seed index (Hundred kernels weight ) 0.961 152.08* 0.972
10.
Shelling percentage 94.088 78.81* 36.920
11.
Kernel yield 0.066 23.93* 2.671
12.
Sound matured kernels 4.356 36.18* 2.498
13.
Kernel Uniformity 3.756 19.69* 3.898
International Journal of Emerging Technology and Advanced Engineering
Website: www.ijetae.com (ISSN 2250-2459, ISO 9001:2008 Certified Journal, Volume 4, Issue 6, June 2014)
820
The genotypic coefficient of variation provides a measure to compare of genetic variability present in 13quantitative parameters. Moderate estimates of genotypic
coefficient of variation was recorded for kernel yield (44.51), Seed yield per plant (42.99), Pod yield (41.36) and low genotypic coefficient of variation value was observed for Pod yield per plant (39.24), Seed index (20.77), Field emergence (16.80), plant height (14.04), Days to 50% flowering (10.42), Number of primary branches (6.77), Shelling percentage (5.73), Sound matured kernels (4.95), Kernel uniformity (3.85), Days to maturity (0.99). (Table
1). Similar finding were reported by Venkataramana et al.
(2001). Nath and Alam (2002) also resulted low genotypic
co-efficient of variation for days to maturity. Injeti (2008)
reported for days to maturity for low genotypic coefficient
of variation. Phenotypic coefficient variation which
measures total relative variation was moderate for Kernel
yield (52.22), Pod yield (50.52), Seed yield per plant (50.41), Pod yield per plant (46.71), Field emergence (28.99), Seed index (20.97), Plant height (15.70), and low estimate of phenotypic coefficient of variation value was observed in Days to 50% flowering(11.46), Shelling percentage (10.94), Number of primary branches (9.45), Sound matured kernels (5.47), Kernel uniformity (4.39), Days to maturity (1.34), (Table 2) Similar finding were
observed for days to maturity by John et al. (2008)
Heritability is a measure of extent of phenotypic caused by the action of gene. For making effective improvement in the character for which selection is practiced, heritability has been adopted by genetic variability, which is transmitted from parent to offspring is reflected heritability. The estimates of heritability in broad sense for 13 quantitative traits ranged from shelling percentage (27.44%) to Seed index (98.11%). Higher estimates of heritability were observed for characters like Seed index (98.11%), Days to 50% flowering (82.63%), Sound matured kernels (81.80%), Plant height (80.00%), Seed yield per plant (72.73%), Kernel yield (72.63%), Pod yield per plant (70.56%), Pod yield (67.03%). Moderate estimates of heritability were observed for characters like Kernel uniformity (57.46%), Days to maturity (54.89%), Number of primary branches (51.34%), Field emergence (33.59%). The low estimate of heritability was observed for character like shelling percentage (27.44%). (Table 2).
Similar observations were made by Khote et al. (2009),
Sumathi et al. (2009), Chaurasia et al. (2012), Kumar et al. (2012), Verma et al. (2013) Singh et al.(2013) . The
results are in according with findings of Venkataramana
[image:3.612.27.586.462.690.2]et al. (2001), Mahalakshmi et al., (2005) and John et al. (2008) for hundred kernel weight.
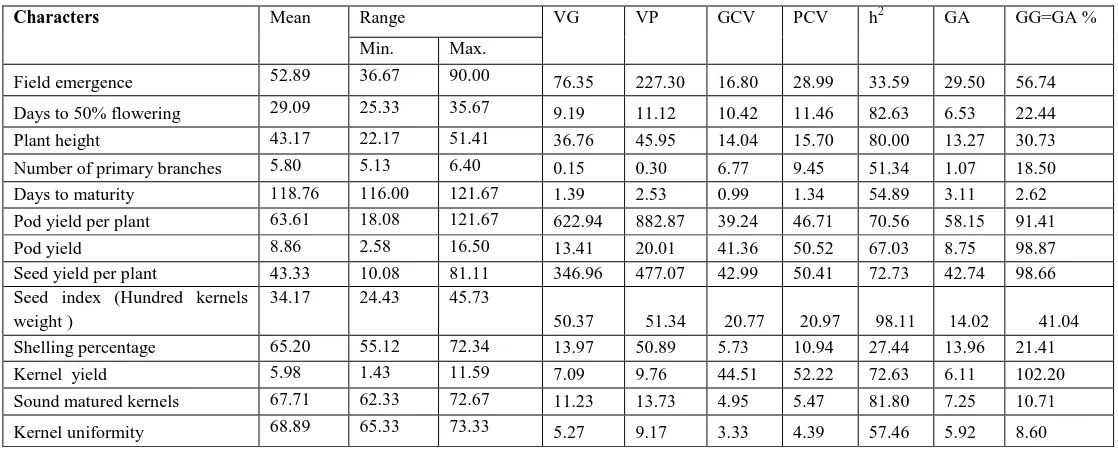
Table 2.
Genetic Parameters of 13 Quantitative characters in 15 Groundnuts Genotypes (including check) during Wet season 2013
Characters Mean Range VG VP GCV PCV h2 GA GG=GA %
Min. Max.
Field emergence 52.89 36.67 90.00 76.35 227.30 16.80 28.99 33.59 29.50 56.74
Days to 50% flowering 29.09 25.33 35.67 9.19 11.12 10.42 11.46 82.63 6.53 22.44
Plant height 43.17 22.17 51.41 36.76 45.95 14.04 15.70 80.00 13.27 30.73
Number of primary branches 5.80 5.13 6.40 0.15 0.30 6.77 9.45 51.34 1.07 18.50
Days to maturity 118.76 116.00 121.67 1.39 2.53 0.99 1.34 54.89 3.11 2.62
Pod yield per plant 63.61 18.08 121.67 622.94 882.87 39.24 46.71 70.56 58.15 91.41
Pod yield 8.86 2.58 16.50 13.41 20.01 41.36 50.52 67.03 8.75 98.87
Seed yield per plant 43.33 10.08 81.11 346.96 477.07 42.99 50.41 72.73 42.74 98.66
Seed index (Hundred kernels weight )
34.17 24.43 45.73
50.37 51.34 20.77 20.97 98.11 14.02 41.04
Shelling percentage 65.20 55.12 72.34 13.97 50.89 5.73 10.94 27.44 13.96 21.41
Kernel yield 5.98 1.43 11.59 7.09 9.76 44.51 52.22 72.63 6.11 102.20
Sound matured kernels 67.71 62.33 72.67 11.23 13.73 4.95 5.47 81.80 7.25 10.71
Kernel uniformity 68.89 65.33 73.33 5.27 9.17 3.33 4.39 57.46 5.92 8.60
Where, VG = Genotypic variance, VP = Phenotypic variance, GCV = Genotypic coefficient of variation, PCV = Phenotypic
International Journal of Emerging Technology and Advanced Engineering
Website: www.ijetae.com (ISSN 2250-2459, ISO 9001:2008 Certified Journal, Volume 4, Issue 6, June 2014)
821
A perusal of genetic advance for different traits revealed that it varied from 1.07 (Number of primary branches) to 58.15 (Pod yield per plant). Low genetic advance was observed for all the traits like Pod yield per plant (58.15), Seed yield per plant (42.74), Field emergence (29.50), Seed index (14.02), shelling percentage (13.96), Plant height (13.27), Pod yield (3.47), pod yield (8.75), Sound matured kernels (7.25), Kernel yield (6.11), Kernel uniformity (5.92), Days to maturity (3.11), Number of primary branches 1.07). (Table 2) Similar finding were observed by Rani et al. (2005) for pod yield and shelling percentage.Genetic advance as percent of mean for various characters are presented in table and noticed that high genetic advance as percent of mean was recorded for Kernel yield (102.20).
Moderate estimates of genetic advance as percent of mean was observed for Pod yield (98.87), Seed yield per plant (98.66), Pod yield per plant (91.41), Field emergence (56.74), Seed index (41.04), and Plant height (30.73). The low estimate of genetic advance as percent of mean was observed for character like Days to 50% flowering (22.44), Shelling percentage (21.41), Number of primary branches (18.50), Sound matured kernels (10.71), Kernel uniformity
(8.60), Days to maturity (2.62). (Table 2). Similar finding
were reported by Saraswathi et al.(2010). High heritability
coupled with high genetic advance as per cent of mean in the present set of groundnut genotypes was recorded for
kernel yield indicating predominance of additive gene
[image:4.612.45.600.338.644.2]effect and the possibilities of effective selection for the improvement of these characters.
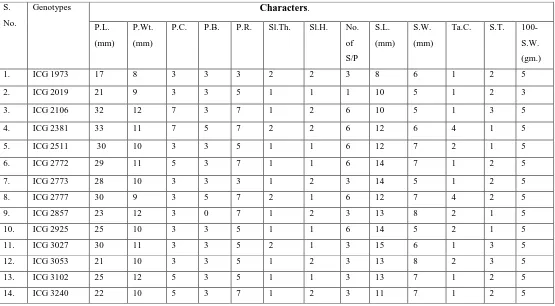
Table 3.
Scoring based Quality characters of 14 Groundnut Genotypes.
S. No.
Genotypes Characters.
P.L. (mm)
P.Wt. (mm)
P.C. P.B. P.R. Sl.Th. Sl.H. No. of S/P
S.L. (mm)
S.W. (mm)
Ta.C. S.T. 100- S.W. (gm.)
1. ICG 1973 17 8 3 3 3 2 2 3 8 6 1 2 5
2. ICG 2019 21 9 3 3 5 1 1 1 10 5 1 2 3
3. ICG 2106 32 12 7 3 7 1 2 6 10 5 1 3 5
4. ICG 2381 33 11 7 5 7 2 2 6 12 6 4 1 5
5. ICG 2511 30 10 3 3 5 1 1 6 12 7 2 1 5
6. ICG 2772 29 11 5 3 7 1 1 6 14 7 1 2 5
7. ICG 2773 28 10 3 3 3 1 2 3 14 5 1 2 5
8. ICG 2777 30 9 3 5 7 2 1 6 12 7 4 2 5
9. ICG 2857 23 12 3 0 7 1 2 3 13 8 2 1 5
10. ICG 2925 25 10 3 3 5 1 1 6 14 5 2 1 5
11. ICG 3027 30 11 3 3 5 2 1 3 15 6 1 3 5
12. ICG 3053 21 10 3 3 5 1 2 3 13 8 2 3 5
13. ICG 3102 25 12 5 3 5 1 1 3 13 7 1 2 5
International Journal of Emerging Technology and Advanced Engineering
Website: www.ijetae.com (ISSN 2250-2459, ISO 9001:2008 Certified Journal, Volume 4, Issue 6, June 2014)
822
P.L. - Pod length (mm), P. Wt. - Pod width (mm), P.C. - Pod constriction, P.B. – Pod beak, P.R. - Pod reticulation, Sl. Th. - Shell thickness, Sl .H. - Shell hardness, No. of S/P - No. of seeds per pod, S.L. – Seed Length (mm),S.W. – Seed Width (mm),Ta .C. - Testa colour, S.T. - Seed test,100- S.W. (gm.) - 100-seed weight (gm).Genotypes that had maximum pod length like ICG 2381 (33 mm), followed by ICG 2106 (32 mm), ICG 2511 (30 mm), ICG 2777 (30 mm), ICG 1973 (17 mm) and genotypes that had maximum pod width like ICG 2106 (12 mm) and ICG 2381 (11 mm), followed by ICG 2772 (11 mm), ICG 2511 (10 mm), ICG 2777 (9 mm). Genotypes that had maximum seed length like ICG 3027 (17 mm), followed by ICG 2772 (16 mm), ICG 2381 (15 mm), ICG 2381 (14 mm), ICG 2925 (14 mm), ICG 2857 (13 mm) and genotypes that had maximum seed width like ICG 2857 (8mm),ICG 3053 (8 mm), ICG 2772 (8 mm),ICG 2019 (7 mm), ICG 1973 (6 mm), ICG 3027 (5 mm), 2925 (5 mm), 2773 (5 mm), ICG 2106 (5 mm). Very tasty genotypes
were observed like ICG 2381, ICG 2511, ICG 2857 ICG
2925 and all the genotypes had medium 100- Seed weight except ICG 1920 (33.25 gm), ICG 2772 (50.75gm) had low in 100- Seed weight ICG 3102 (50.38gm).(Table 3).
Quality Similar finding were observed by Kotzamanidis,
(2006). Taxonomy and image data of 14 groundnut genotypes was successfully submitted for bar coding to the BOLD database with the title “Groundnut SHIATS”, code “PRASH” and project description “Groundnut trails at SHIATS” Allahabad.
IV. CONCLUSION
Groundnut genotype ICG 2772 identified as best
genotype for pod yield (16.50 q/ha), Kernel yield (11.59 q/ha) ,seed yield per plant (81.11g) and genotype ICG 2777 identified as best genotype for Pod yield per plant (101.28 g.), Seed yield per plant (67.15 g.), seed index (30.61g) kernel yield q/ha recorded high estimates of genotypic coefficient of variation (44.51) and kernel yield q/ha recorded high estimates of phenotypic coefficient of variation (52.22). Highest heritability was recorded for pod
seed index (98.11) Whereas High heritability coupled with
high genetic advance as per cent of mean in the present set of groundnut genotypes was recorded for kernel yield. Since, these data are based on six months experimentation, further research is needed to substantiate the results. In Pod and Seed characters, genotype ICG 2381 identified as best genotype for pod size (length and width). Genotypes ICG 2381 and ICG 2511, ICG 2857 identified as very tasty. Genotypes ICG 1973, ICG 2381, ICG 2772, and ICG 2106, ICG 2773, identified as thick in Shell thickness and intermediate in shell hardness.
Taxonomy and image data of groundnut genotypes was successfully submitted for bar coding to the BOLD database with the title “Groundnut SHIATS”. The bar-coding has established a standardized approach across taxonomic group facilitating fast accurate species identification. The goal is that anyone, anywhere, anytime be able to identify quickly and accurately the species of a specimen whatever its condition.
Acknowledgements
Authors are thankful to Department of Genetics and Plant Breeding/ Seed Science and Technology, Allahabad School of Agriculture, Sam Higginbottom Institute of Agriculture, Technology and Sciences, Allahabad. Sincere thanks to all the members of Department of Genetics and Plant Breeding / Seed Science and Technology for their encouragement and support.
REFERENCES
[1] Anonymous (2012).Coverage and Production of Groundnut in India, International Crop Research Institute for Semi Arid Tropics (Patancheru) Hyderabad.
[2] Burton, F.W. (1952).Quantitative inheritance of grasses. Proc. 6thIntstitute, Grassland congress, 1:277-283.
[3] Burton, G. W. and Devane E.W. (1953).Estimating heritability, GCV and PCV in tall Fescue from replicated clonal material, Journal of Agronomy, 45:171-181.
[4] Chaurasia A. K., Rai, P. K., Kumar, A. (2012) Estimation of genetic variability, heritability and genetic advance in aromatic fine grain rice, Romanian Journal of Biology-Plant Biology (Bucharest) 57: 71-76. Kumar, A., Chaurasia, A. K., Paikhomba, N., Rai, P. K. (2012). Evaluation of quantitative and qualitative analysis of aromatic fine grain rice (Oryza sativa L.) genotypes, Progressive Research 133-136.
[5] Injeti, S. K., Venkataravana, P. and Rao, M. R. G. (2008).
Evaluation of new germplasm and advanced breeding lines of groundnut (Arachis hypogaea L.) under late kharif situation, Legume Research, 31 (4): 254-258.
[6] John, K., Vasanthi, R. P., Venkateswarlu, O., Muralikrishna, T. and Naidu, P. H. (2008). Genetic analysis and regression studies for yield and yield attributes in F2 segregating populations of groundnut crosses, Legume Research, 31 (1): 26-30.
[7] Johnson, R. E., Robison, H. W. and Comstack, H. F. (1955).
Estimates of Genetic and environmental variability in rice, Journal of Agronomy. 47:314-318.
[8] Khote, A.C., Bendle, V.W., Bhave, S.G. and Patil, P.P (2009).
Genetic variability, heritability and genetic advance in some exotic genotype of groundnut (Arachis hypogaea L.), Crop Research, 37(1, 2 & 3) 186-191.
[9] Korat, V. P., Pithia, M. S., Savaliya, J. J., Pansuriya, A. G. and Sodavadiya, P.R. (2009). Studies on Genetic variability in different genotypes of Groundnut (Arachs hypogaea L.), Legume Research,
32 (3): 224-226.
[10] Kotzamanidis, S.T. Stavropoulos N. and Ipsilandis C.G. (2006).
International Journal of Emerging Technology and Advanced Engineering
Website: www.ijetae.com (ISSN 2250-2459, ISO 9001:2008 Certified Journal, Volume 4, Issue 6, June 2014)
823
[11] Lush. J. L. (1949). Intensive correlation and regression of charactersproceeding of American Society of Production, 33: 293-310. [12] Mahalakshmi, P.,Manivannan, N. and Muralidharan, V.
(2005).Variability and correlation studies in groundnut (Arachis hypogaea L.), Legume Research, 28: 3, 194-197.
[13] Nath, U.K. and Alam, M.S. (2002). Genetic variability, heritability and genetic advance of yield and related traits of Groundnut (Arachis hypogaea L.) Journal of Biological Science, 2(11):762-764. [14] Panse, V. G. and Sukhatme P.V. (1967). Statistical methods for
agricultural workers (2ndEd.) ICAR Publication, New Delhi. : 259.
[15] Rani, K. S. K.,Parameshwarappa K. G. and Bentur, M. G. (2005). Genetic variability and character association in large seeded groundnut genotypes, Journal of Agricultural Sciences, 18 (2) 329-333.
[16] Saraswathi, M., Venkateswarlu, O., Sekhar, M. R. and Sudhakar, P. (2010). Studies on variability, heritability and genetic advance in Groundnut (Arachis hypogaea L.) Research on Crop, 11
(2): 471-475.
[17] Savaliya, J. J., Pansuriya, A.G., Sodavadiya, P. R. and Leva, R.L. (2009). Evaluation of inter and intra specific hybrid derivatives of Groundnut (Arachis hypogaea L.) for yield and its components. Legume Research, 32 (2): 129-132.
[18] Singh Sangram, Kumar Arvind, Tiwari Vivek, Maurya M.K., Chaurasia, A.K. and Rai, P.K. (2013). Study on the performance of ground nut (Arachis hypogaea L.) accessions for seed yield and quality parameters for north east plain zone of Uttar Pradesh. Progressive Research 8 (2) : 237-240 (2013).
[19] Sumathi, P., Amalabalu, P. and Muralidharan, V. (2009).
Genetic variability for pod characters in large seeded genotypes of groundnut (Arachis hypogaea L.) Advance in Plant Sciences, 22 (1): 281-283.
[20] Tsigbey, K. K., Parsana, G.J. and Dangaria, C.J. (2004). Quality status of groundnut seed at farmer’s level in Gujarat, Seed Research; 35: 1, 111-113.
[21] Venkataramana, P.(2001).Variability and correlation studies in groundnut, Crop Research, 21: 1, 81-83.