ECONOMIC
THE
RESEARCH
INSTITUTE
The Irish Economy in
I963 and I964
C. E. V. LESER
With Appendix
Forecast of Agricultural Output I964
by
ti. A. Attwood and M. Ross
August, I964
Paper No. 2I
THE
ECONOMIC
RESEARCH
INSTITUTE
EXECUTIVE BOARD I963-64
J. J. MCELLIGOTr, M.A,, LL,D., President of the Institute.
G. O’BRIEN, D.LITF., LITT.D., Chairman of the Executive Board.
C. S. ANDREWS, B.COMM., D.ECON.SC.,
Chairman, C6ras Iompair ]~ireann.
J. P. BEDDY, D.ECON.SC., LL.D. (H.C.)
Chairman and Managing Director, The Industrial Credit Company Ltd. R. D. C. BLACK, PH.D.,
Professor, Department of Economics, The Queen’s University, Belfast.
J. BUSTEED, M.COMM.,
Professor, Department of Economics, University College, Cork.
G. A. DUNCAN, S.F.T.C.D.,
Professor of Political Economy, Trinity College, Dublin. R. C. GEARY, D.SC., D.ECON.SC.,
Director of the Institute.
W. A. HONOHAN, M.A., F.I.A.~
Secretary, Department of Social Welfare.
M. D. MCCARTHY, M.A., PH.D., Director, Central Statistics Office.
J. F. M.EENAN, M.A., B.L.,
Professor of Political Economy, University College, Dublin.
C. K. MILL, B.A., D.SC.,
Managing Director, Arthur Guinness Son & Company (Dublin) Ltd.
D. NEVIN,
Research Officer, Irish Congress of Trade Unions.
L. O’BUACHALLA, M.COMM.,
Professor, Department of Economics, University College, Galway.
J. C. TONGE,
Federation of Irish Industries. T. WALSrI, D.SC.,
Director, An Foras Tak~ntais.
T. K. WHITAKER, M.SC. (ECON.), D.ECON.SC., Secretary, Department of Finance.
GERALD WILSON,
Director, Bank of Ireland, Dublin.
The Irish Economy in I963 and I964
by C. E. V. LESER*
1. EXPECTATIONS AND RESULTS FOR 1963
The year i963 was on the whole one of satis-factory growth for the Irish economy. According to the most recent official figures available (Central
Statistics Office, i964), gross national product in constant prices increased by more than 40/0 between I962 and I963 ; as far as can be gauged from the rounded totals given, the increase amounted to about 4.2%. If this growth rate is, on the average, maintained until i97o, the target of a 50% increase in real gross national product over I96o envisaged in the Second Programme for Economic Expansion
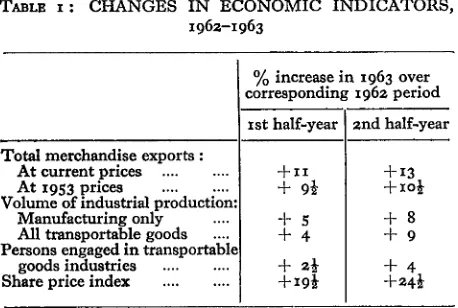
(i963) will be approximately reached by that date. After a somewhat uncertain start, the performance of the economy improved during the year, and the second half of the year showed more favourable results than the first. This can be seen from Table i, which shows the percentage increases over the corresponding half-year in I96Z for a number of
economic indicators; they are based on totals or simple averages of published quarterly or monthly figures.
In view of this fact, it is not surprising to find that the result of I963 has been somewhat better than generally expected. Certainly, the Organlsation for Economic Co-operation and Development (i963)
[image:3.614.56.285.510.664.2]envisaged a 4 % growth rate as a possibility, but the wording of its conclusion "... there are grounds for hoping that I963 will witness something like a 4 per cent. increase" (p. I9) may suggest that
TABLE I: CHANGES IN ECONOMIC INDICATORS, I96Z-1963
Total merchandise exports : At current prices ... At x953 prices ... Volume of industrial production:
Manufacturing only ....
All transportable goods ....
Persons engaged in transportable goods industries ... Share price index ...
% increase in I963 over
corresponding I96z period xst half-year l
+ 9½
+ 5
+4 + 2½ +xg½
2nd half-year
-~-i3
+io½ +8 +9
*The author of this paper is a Senior Research Officer of
the Economic Research Institute. The paper has been accepted for publication by the Institute. The author is responsible for the contents of the paper including the views expressed therein.
this figure was considered as an upper limit rather than as a likely outcome.
The industrialists in Ireland themselves did not show a mood of pronounced optimism in the course of I963 if the quantitative forecasts contained in the Quarterly Industrial Surveys conducted by the Economic Research Institute (i963) are any guide. The prognostics made in January as well as in July and October were to the effect that manufacturing production in I963 would be 3}/0 above the I96z level; only in the April Survey a 6% increase was forecast. According to recent though provisional data, the volume of industrial production in I963 was 6½% higher than in I962, whether manufacturing alone or all transportable goods industries are considered.
The discrepancy is quite startling with regard to industrial exports. In this field, the Quarterly Survey forecasts varied between a 2% increase and a z% decrease during i963. Actually, the value of domestic exports other than agricultural produce appears to have been i5% higher in r963 than in I96Z.
It is not easy to see in which way this systematic discrepancy between predicted and realised exports could be eliminated or substantially reduced in the framework of the Quarterly Surveys. Clearly, any export forecasts as such which are or could be made on the basis of the Quarterly Survey results, whether inside or outside the Economic Research
T/roLE 2: PREDICTED AND ACTUAL CHANGES IN NATIONAL ACCOUNTS DATA, 1962-1963
At current prices :
Gross national product ... Imports ... . ...
TOTAL MARKET SUPPLIES ... Personal expenditure ... Government expenditure ... Fixed capital formation ...
Stock changes ...
Exports ... TOTAL FINAL D~k.ND ... At 1953 prices :
Gross national product .... Imports ...
TOTAL MARKET SUPPLIES ....
Personal expenditure ...
Government expenditure ... Fixed capital formation ... Stock changes ... Exports ...
TOTAL FINAL DEMAND ....
Increase between I962 and 1963
£ mill % of I962
Predicted Actual Predicted Actual
+44 +49 +6 + 6½ +24 +35 +8 +ii½ +68 -1-84 4- 6½ +8 +29 %’35 + 5 +6 +4 +5 + 5 + 5½ +i8 +x7 +i5½ + I4½
-- I +I
+18 +26 +6 +9
+68 -I-84 + 6½ +8
+2I +26 + 3½ +4 +i6 +26 + 5½ +9 +37 +52 + 4 +6 -I-12 -1- i6 -1- 2½ + 3½
+2 -I- 3 +3 + 4½
+12 -1-13 -t-I3 -1-13½
-- I -t- z
+12 -1-19 + 4½ +7 +37 +52 -t-4 +6
than at present, a marked improvement would be effected.
The forecast made by Leser (i963a) also under-estimated the increase in external trade and to a lesser extent that in gross national product and personal expenditure. A comparison between predicted national accounts entities and the official estimates now available can be made, but not with regard to the 1963 totals since the i962 national accounts data were themselves substantially revised since last year. Instead, changes in totals or per-centage changes between 1962 and 1963 may be compared as in Table 2.
The method by which the predictions had been arrived at proceeded in three stages. Firstly, the absolute changes in fixed capital formation, stock changes and exports at current prices were directly estimated. Secondly, figures for changes in con-sumption, i.e., in personal plus government expendi-ture, for imports and for gross national product at current prices were derived with the aid of a very simple econometric model consisting of one identity and two structural equations. Thirdly, separate figures for personal and public authorities’ expenditure were estimated, and by means of estimated price changes, the current price data were converted into constant price figures.
The estimates for investment, with regard to both fixed capital formation and stock changes, turned
out to be virtually correct ; and the assumed price
increases of about 2% were also approximately
realised. The increase in the value of exports was, however, put at too low a figure, and this affected the rest of the predictions. Errors in the equations themselves, due to various factors, also had a bearing on the results.
The influence of the two kinds of errors canbe seen as follows. If the data available at present for changes between 1962 and 1963 in final demand other than consumption, and also the revised changes between 1961 and 1962, are inserted into the equations, the increase from 1962 to 1963 becomes £5° million for gross national product, £29 million for imports, and £35 million for consumption; the actual increases were, in that order, £49 million, £35 million and £4° million. The model would thus have given a virtually correct result for the gross national product but would still have underestimated the growth of imports and consumption.
Whilst the forecast did not turn out too badly, the prediction equations used for 1963 are now felt to be not fully satisfactory on both theoretical and practical grounds, and they have been discarded for the 1964 forecast. Nevertheless, the approach adopted towards national accounts prediction will be basically maintained.
I963. According to present estimates the gross output value rose by only 1% and the net output value only fractionally. Nevertheless, the main conclusion that there would be no major changes in agricultural output between 1962 and 1963 has been upheld.
The number of workers engaged in agriculture also fell and to a slightly greater extent than net output, so that output per head appears to have slightly risen--by about z % in value and about i o/o in volume. The main contribution towards economic growth must have come from increased output per head in industry and in some of the service trades like transport and distribution.
The shift of about 8,000 economically active persons from agriculture to industry also made a contribution to economic growth although a minor one. It can be seen that even if national income per worker had remained unchanged in each of the three sectors formed by agriculture, industry and the service trades, the change in the composition of the labour force towards the more highly-paid industrial sector would by itself have raised national income by about ½ %.
Prices remained relatively stable both in the second half of I962 and in 1963, except for a jump by 4 percentage points in the consumer price index (base 1953) or by 3 % between the third and fourth quarter of 1963, following the introduction of the turnover tax. The 1963 average of the wholesale price index was i~% higher, and the average of the consumer price index 2½% higher, than the i96z average; in the fourth quarter of i963, wholesale prices were i½% higher and consumer prices 4½% higher than at the end of 1962. Otherwise, the introduction of the turnover tax appears to have had no major direct impact on the economy.
Recent trends which tended to bring about changes in the composition of merchandise exports and imports continued up to i963. The value of exports rose for all major commodity groups though the increase was very slight for drink. Among animals and food exports, the relatively greatest expansion occurred in food and food preparations other than meat; these foodstuffs constituted 30"7% of all domestic exports in i963 as against 24.1% in i962, 21.9% in i96i and I7.O% in 196o. At the same time, the share of the traditional exports, live animals and meat, declined. I963 also saw a substantial increase in exports of machinery and transport equipment. Invisible exports also
increased but at a far lower rate than merchandise exports.
Among imports, the share of producers’ capital which had been io.7% in 196o, 1z.8% in 1961 and 14.4% in 196z continued to rise, reaching 15.4% in 1963 ; the share of materials for industry continued to fall from 58.9% in 196o, 57"z% in i96i, 54.8% in i96z to 53.6% in i963. To some extent, this may be due to industrial materials becoming relatively cheaper rather than a relative
decline in the volume of those kinds of imports. As in previous years, there were also considerable differences in the expansion rates experienced by various industry groups between 196z and 1963.
Industrial production appears to have risen by about 15 % for metals and engineering, by about lZ% for textiles and by about I x % for wood and furniture industries. On the other hand, there was no expansion in the drink and tobacco industries, and the output of the food industries rose by 4% only. For other industry groups, the increase in volume of production amounted to between 4% and 8%. The growth rate of the Irish economy has been in line with that prevailing in the Western world in general. From the available statistics it appears that for the European Economic Community as a whole, as well as for the United States, real gross national product was about 4% higher in 1963 than in i96z. In the United Kingdom, the increase was only 3%, but this figure was depressed by the recession in i96z, the recovery from which did not get under way till 1963 ; the increase experienced between the beginning and end of i963 was much greater.
It seems plausible to conclude that the economic climate in the rest of the world in general and in the United Kingdom in particular has helped to promote Irish exports abroad and in this way has created favourable conditions for economic growth at home. To what extent these external factors are responsible is hard to say and is in any case a largely speculative question; one may confidently surmise that the active promotional effort must be accorded some of the credit for the expansion of exports. What is more important from a practical point of view is the question how far external and internal factors are favourable to further economic growth, and whether indications are that the present growth rate will be maintained. These questions, among others, will be investigated in the following sections.
2. THE CURRENT POSITION
from abroad. Most of the economic indicators are running at a high level in the first quarter of 1964, as compared with the first quarter of 1963.
In a comparison of this sort, some caution is needed, since a large increase may indicate an abnormally low level at this time of the preceding year rather than a high level in the current period. In order to get round this difficulty, a" theoretical " figure, representing an estimate of trend plus seasonal variation but eliminating the irregular component, has been derived for the first quarter of 1963 with regard to a number of economic series. Trend and seasonal variation estimates were made by the "quasi-linear trend method" (Leser, 1963b) ; the method of central unweighted moving averages has also been employed as a check and leads to similar results. The five years I959-i963 inclusive were used for estimating the seasonal variation as an additive component (i961-I963 for retail sales). The percentage increase of the actual figure in the first quarter of 1964 over both actual and theoretical figure for the first i963 quarter may then be obtained, as shown in Table 3.
The analysis suggests that electricity output and revenue receipts were somewhat abovetheir normal level in the first quarter of 1963, merchandise trade somewhat below its normal level; the differences are slight for the remaining series, and the main
[image:6.610.95.558.562.708.2]conclusions are not affected by the use of corrected data. House building activity and share prices are about 3o% higher at the beginning of 1964 than a year earlier, merchandise trade and revenue receipts about 2o% higher, industrial production more than Io% higher, whilst electricity output, retail sales, note circulation and car registrations have risen by somewhat less than lO%. The increase in imports is substantial but proportionately no higher or rather a little lower than the increase in exports. Pig sales to factories which serve as a possible indicator of agricultural output show only a slight increase. Agriculture is currently benefiting from a marked improvement in prices, a develop-ment which according to Geary (I956-57) is not
TABLE 3: ECONOMIC INDICATORS,
necessarily accompanied by an expansion in pro-duction. However, the appended forecast by Attwood and Ross does in fact suggest a substantial increase in agricultural output.
In the domestic field, the main event of the early part of 1964 was the ninth round of wage increases, the full effects of which upon the economy still will have to make themselves felt. Certainly, the continued rise in share prices does not suggest any great apprehension of unduly depressed profits. As to be expected, part of the cost of the wage rises was passed on to the consumer in the form of higher prices, which were also raised by the high level of demand abroad for beef and the tax increases in the budget. As a result of these factors acting in combination, the consumer price index rose by 4% between February and May, 1964 ; and even if no further price rise occurs the 1964 average should exceed the 1963 average by almost 6 %.
This raises the old question whether price increases will have an adverse effect upon exports. There is no simple answer, since neither the relationship between domestic price levels and export prices nor the relationship between export prices and export volume is obvious. In the past, export prices have risen far less than domestic prices, though it seems doubtful how long and to what extent this divergence can continue. There is, in any event, no evidence yet of price levels rising much faster than in the United Kingdom and overseas generally.
One cannot but envisage for 1964 as a whole a substantial increase in real national product over 1963, since much of the growth has already occurred and there is no sign of a recession yet. The position is similar in other countries. According to the National Institute of Economic and Social Research (1964), gross national product at constant prices is expected to be 5-6% higher in 1964 than in 1963 for the United Kingdom, and 4-5 % higher in all member countries of the European Economic Community. Similarly, the following was the main conclusion reached by the Association of European
FIRST QUARTERS OF I963 AND 1964
~/o increase 1964 over Ist quarter, 1963 xst
quarter, 1964 1963 actual 1963 theoretical +2o +24 +8 -[- 2 -~-IT + 7 +28 +19 +9 + 7 +32 Actual Theoretical +26 +29 +4 +5 + 12 + 8 +27 +16 + 1o + 8 +28
Merchandise imports (£ mill.) ... 69"4 73"0 87"7 Merchandise exports (£ mill.) ... 43"1 45"6 55"8 Electricity output (mill. KWH) ... 852"4 82o’o 885"2 Pigs for bacon factories (ooo) ... 354’9 362"3 371"2 Transportable goods production (1953= lOO) .... I42’4 143"3 I58"9 Retail sales (196I= lOO) ... rol 1o2 lO9 Share prices (1953= ioo) ... 244"0 242"1 31 I’O Weekly revenue receipts (£ooo) ... 4,359 4,239 5,o64 Note circulation (£ mill.) ... 88’75 89"42 q7"56 New cars registered (No.) ... 9,322 9,4Ol lO,O36
Conjuncture Institutes at its conference in Liege on 24th and 25th April, i964: " The rhythm of global expansion of production in Western Europe has been maintained since autumn and appears to be maintained in the near future for most countries." In order to quantify the projected increase in national product and related aggregates, an econo-metric model describing some of the relationships which exist between the main aggregates will be employed in the same way as a year ago (Leser, i963a). It may be described as an interim model as it is somewhat more elaborate than the former extremely simple one, but its further development is under consideration. Since a full description of the mathematical relationships would entail a somewhat technical account of conventions adopted, only a brief account of its basic features will be given here. An unpublished study describing the model is available, and it is hoped to produce a published version.
The model contains three main relationships between changes in national accounts data at constant prices (measured in index form), of which the first and second may be described as an import decision and a production decision equation, the third as a consumption function. There are also four relationships between changes in the implied price indices for imports and gross national product on the one hand, and indices for personal expendi-ture, government expendiexpendi-ture, capital formation and exports on the other hand; the difference between level of import and export prices also enters into these relationships.
The import and production decision equations express the increases in real imports and gross national product respectively as functions of increase in investment, increase in exports, an indicator of stock changes, and the relation between price movements for imported and home produced goods. The consumption function shows the increase in real personal expenditure as a function of increase in gross national product and the differential between the growth of national product and consumption one year previously, together with a price index.
The numerical values entering these relationships were estimated on the basis of the national accounts data for the years I953-62 inclusive before any figures for I963 became available. All coefficients obtained have an economically meaningful sign. The price relations reflect the high dependence of the price of investment goods on the import price, the high sensitivity of the cost of government expenditure to changes in internal prices, and the relatively slow increase in export prices. The import and production decision functions show, among other things, a substantial effect of
invest-ment on imports, a delayed effect of final demand on both imports and gross national product, and a high sensitivity of the import ratio to relative prices. Both current and lagged growth rate in gross national product have a substantial effect on consumption.
By inserting some of the changes between I962 and i963, together with other data, into the equations, the relations were tested; theoretical figures for imports, gross national product and consumption at 2953 prices, as well as national accounts data at current prices, were derived and compared with the actual figures. The chief theoretical results for i963 were an increase, at I953 prices, in imports of goods and services by £24 million, in national product by £32 million and in personal expenditure by £z5 million. The actual increases were £26 million each for imports and gross national product, £i6 million for personal expenditure. The agreement between theoretical and actual figures, though not perfect, appears sufficiently good to justify the retention, for the time being, of the model for predictive purposes.
It will be assumed that fixed capital formation at I953 prices, which rose by £i3 million between I962 and z963, will increase by the same amount between z963 and i964, whilst government expendi-ture at z953 prices increases by £4 million (previously by £3 million). The implied price indices for imports and gross national product are assumed to rise by 2½ and 5½ percentage points (about 2~% and 4½%) respectively; and the wholesale price index for home-produced goods is assumed to rise by 2 points more than the wholesale price index for imports.
The crucial assumption concerns the level of exports of goods and services. The report of C6ras Tnlcht~la (z964) estimates that visible exports in I964 will be 7-zo% above the i953 level in current value terms, of which z-3 % is accounted for by higher prices. The top figure of the range implies an increase by £i9-zo millions; this will be realised if exports from June to December are merely running at the average rate of the first five months of the year, and thus appears to be a conservative estimate. It would imply a rise in merchandise exports at 2953 prices by about £I5 million, to which £3 million for higher invisible exports may be added or £I8 million all in all.
T~L,~ 4: NATIONAL ACCOUNTS DATA, 1963 AND 1964
1963 Conservative prediction official
figures 1964 %change £mill. £ mill. I963-64 At current prices :
Gross national product ... 823 894 + 8½
Imports ... 341 382 -4-i2 TOTAL MARKET SUPPLIES ... 1,164 1,276 + 9}
Personal expenditure ... 6oi 650 +8 Government expenditure ... 96 io6 +1o½
Fixed capital formation ... 136 158 +16
Stock changes ... -t-12 +13
Exports ... 319 349 + 9½ TOTAL FINAl. DEMAND ... I,I64 1,276 + 9½ At 1953 prices :
Gross national product ... 649 676 +4
Imports ... 305 334 + 9}
TOTAL MA~r SUPPLIES ... 954 1,010 +6
Personal expenditure ... 478 497 +4 Government expenditure ... 73 77 + 5½ Fixed capital formation ... iio I23 +12
Stock changes ... +1o -]-i2
Exports ... z83 3Ol
z,ozo I
+ 6½
TOTAL FINAL DEMAND ... 954 + 6
Optimistic
1964
£mill.
9Ol 384 *,285 653 lO6 158 +1o 358 1,285 681 336 1,o17 499 77 123 +9 3o9 1,O17
prediction % change
1963--64
+ 9½ +iz½
+ 8½ + 1o½
+16 -4-iz +io½
+ 5
+1o + 6½ + 4½
+ 5½
+12 + 9 + 6½
are added on for the rise in invisible exports, an optimisuc estimate of £26 million at I953 prices is obtained for the export increase.
From these assumptions, the remaining figures required to construct a set of national accounts data at i953 prices and at current prices may be derived from prediction equations. The price relations have been adjusted for this purpose to allow for the increase in agricultural prices with its effect on export prices. A modified version of the con-sumption function has also been used. Alternative results, based on the conservative and the optimistic assumption about exports, are shown in Table 4. It is hoped that errors in the other assumptions and in the equations themselves will not seriously affect the results.
It will be seen from Table 4 that the projected increase in real gross national product from I963 to I964 lies between 4% and 5%, whichis at least as great as the increase experienced between i962 and I963. This seems to be in line with current prospects. In money terms, the increase should be
about 9 %. All sectors of the economy are expected to share in this increase; the appended forecast by Attwood and Ross anticipates a Io% increase in the value of net agricultural output.
Another feature is the increase in personal expenditure which is put at about 8 % in current prices, one-half of this increase representing a rise in real consumption and the other half a rising price level. This is also in line with the recent upward movement in retail sales.
Imports are expected to increase relatively more than gross national product, whether in value or volume terms, and an increased balance of payments deficit is anticipated. On the most optimistic assumption, this deficit will increase from £22 million in i963 to £26 million in i964, whilst with the less favourable result in exports, the deficit could be as much as £33 million. Without a radical transformation of the Irish economy’s structure, a negative balance of payments seems likely to persist as long as investment increases at the present rapid rate.
3. FURTHER OUTLOOK
It is of some interest to compare the results which appear to have been achieved since i96o with the long-term objectives stated in the Second Programme for Economic Expansion. The plan
6
In quantitative terms, the projected increases are 89% for gross capital formation including stock changes, 81% for imports, 75 % for exports, 71% for government expenditure, 51% for gross national product and 43 % for personal expenditure by I97O, all variables measured in constant prices.
If the figures given here for 1964 are accepted, capital formation including stock changes will have increased by about 55%, imports by about 42%, exports by about 3o%, govermnent expenditure and gross national product by I7%, and personal expenditure by 16%. Except for the fact that the rate of increase is no greater for govemmlent expenditure than for national product, the order of the expansion rates is in conformity with the projected trends.
A comparison in quantitative terms is subject to greater qualifications. Extrapolation of the 196o-1964 rates would give 197o figures for gross national product and personal expenditure which are fairly close to those envisaged in the programme, but the figures for capital formation, imports and exports would be much higher. In fact, the implication would be that about three times as much in real terms is spent on capital formation in 197o than in 196o ; the import volume would be almost two and a half times as great, and the export volume on the optimistic assumption about twice as great.
Of course, a naive extrapolation of this kind does not make much sense in economic terms. In i96o, total investment at 1953 prices amounted to £15 for every £IOO of gross national product ; in 1964, this figure appears to have risen to £19-2o and continuation of recent trends would imply that it rises to £29-31 per £1oo of national product. Such a radical transformation of the Irish economy could not be seriously contemplated. Sooner or later, the increase in investment must reduce to a more moderate rate not inconsistent with the maintenance of a steady economic growth, and the investment-output ratio should settle down at a level more in accordance with the figure of 18 % planned for 197o.
With a slowing down of the growth in investment the expansion in one component of the import bill at any rate, viz., in producers’ capital goods, should also assume more moderate form. In this field, a particularly sharp increase was observed between 196o and 1963, when imports of producers’ capital almost doubled in current prices; in 1963 these goods formed 15% of all merchandise imports. Imports of materials have recently experienced an increase which was approximately in line with that of gross national product, and this relation may be expected to hold in future.
The position with regard to imported consumer
goods is less clear. Imports of this kind declined in importance during the i95o’s but, in reversal of this trend, grew faster than personal consumption as a
whole between 196o and 1963. This may be partly due to the recent reductions in tariffs and liberalisation of trade but also to the orientation of new industries towards exports. Whilst the establishment of export industries appears to have been effective in promoting growth, there may also be scope for new industries which are able to compete in the home market under freer con-ditions.
All in all, imports should not grow as fast as in recent years though the total growth during the current decade may be above the rate anticipated in the Second Programme. Similar considerations apply to exports. External factors, patricularly the recent recovery and expansion of the United Kingdom economy, have been very favourable for the growth of exports but cannot be expected to be quite as favourable in future. Nevertheless, there seems every reason to believe that exports will continue to rise steadily, and that the gap in the balance of payments which is at present widening will in time be reduced again.
Nothing has been said so far about the implica-tions of economic growth upon the number of persons at work. One reason for this is that labour force statistics do not readily lend themselves to a short-term analysis, and there is as yet considerable uncertainty regarding manpower requirements and the factors which have a bearing on employment. Experience of recent years may suggest that a 4% growth rate in real gross national product could be achieved without any appreciable increase in the number of persons at work. However, this appears to have been made possible by a situation of under-employment in agriculture, in which a net shift of labour from agriculture to industry permitted an unchanged level of agricultural output together with an industrial expansion. It seems doubtful to what extent this source of labour supply remains open in the future. A growth rate of 4% or more may therefore well require an increase in the labour force.
levels and partly the employment opportunities in the two countries. If this is so, then with a prosper-ing British economy there will not be the same tendency towards an increasing Irish population as
there was during the British recession. The second half of the current decade may well see the end of an abundant labour supply and the beginning of a labour shortage.
References
Attwood, E. A. and Ross, M. (I963), Forecast of Agricultural Output r963, Appendix to Economic Research Institute Paper No. xS, Dublin.
Central Statistics Office (r964), Economic Statistics, Dublin. C6ras T~eht~la (x964), Annual Report x963, Dublin.
Economic Research Institute (x963), Quarterly Industrial Surveys.
Geary, R. C. (x956-57), "Variability in agricultural statistics on small and medium sized farms in an Irish county," ffournal of
the Statistical and Social Inquiry Society of Ireland, vol. I9.
Leser~ C. E. V. (x963a), The Irish Economy in I96z and i963, Economic Research Institute Paper No. I5, Dublin.
Leser, C. E. V. (I963b), " Estimation of quasi-linear trend and seasonal variation," ffournal of the American Statistical Association, vol. 58.
National Institute of Economic and Social Research (I964), " The economic situation : annual review," National Institute
¯Economic Review, No. 27.
APPENDIX
FORECAST
OF AGRICULTURAL OUTPUT
by
E. A. ATTWOOD and M. Ross
An Foras Talfntais
I964-The forecasting of agricultural output for a single year is made more difficult than that of other sectors of the economy, due to the quite unpredictable effects of the weather. For example, the forecast for z963 for crop production turned out to be too high due to the below average yield of’ the main cash crops. This was partly compensated by the higher grassland output, but the difficulties of " cashing " extra grass in any one individual season make it unlikely that the additional livestock output will entirely balance the depressed crop production. The following forecast is based on the assumption that the general trend in yields over recent years will continue in z964, but there are in practice considerable year-to-year divergences from this trend and these are likely to affect the estimate for particular crops or livestock. Nevertheless the increase in total output is forecast with greater confidence than that for the individual items, and it is most likely that the plateau of farm output in I963 will be superseded by a strong upward trend in I964.
The substitution of wheat acreages by feeding barley which has been a feature of recent seasons has not occurred to any significant extent in i964. The area under both crops is approximately the same as last year. However, it is assumed that the low yields of i963 will be repeated, and a higher level of production is expected. The price of wheat is expected to be unchanged as there does not appear to be any need for a Grain Board Levy in view of the level of the wheat acreage. The area under malting barley has increased due to the considerable expansion in the requirements by the brewers, which are estimated to have risen by almost 200,000 barrels, or over 2o per cent. The price of both feeding and malting barley has increased by about 2/- per barrel and this combined with the increased yields should mean a record production valued at £Io million. Little change is expected for oats.
The acreage under cash root crops has tended to
fall. Not all the contracts for sugar beet offered by Comhlucht Sifiicre ~ireann Teo. were taken up. This lower area will, however, probably be com-pensated for by more normal yields than those experienced in the last season and by somewhat higher prices and accordingly an output of £7 million for sugar beet does seem probable. It is more difficult to estimate potato output but it seems likely that the very low prices of i963 will not be experienced and accordingly a higher figure is forecast for the coming season.
The remaining crops are mainly the horticultural ones, which have shown a steady upward trend in recent years. The expansion of Erin Foods into this field will provide greater outlets for these crops although it is likely that the carrot acreage wdl be reduced. The increased area of fruit is expected to lead to greater output this year as more young orchards reach the fruiting stage.
TABta~ I: CROP PRODUCTION, 1962-1964
1963
Value of Value of No. Output Exports
(ooo) £ mill. £ mill. total Live Exports .... 850" 52"3 56"0
Beef exports ... 260 13"7 12"6 TOTAL EXPORTS .... I~IIO 66"0 68"6
Less imports ... --16o --8"8 --8"8 Net exports ... 95° 57"2 59"8 Home consumption .... 2IO I I"5
’tOTAL ... 1,160 68’7 Stock changes .... 114 4"5 TOTAL OUTPUT .... 1,274 73 ’2
1962 actual £ mill. 1964 forecast £ mill. 8"5 1"2 I0"0 7’o 7"3 9"o 43 ’o 5"5 48"5 Previous forecast £ mill. Actual £ mill. Wheat ... Oats ... Barley ... Sugar beet .... Potatoes .... Horticultural and
miscellaneous
crops ... TOTAL CROPS .... Turf ... TOTAL .... 7"3 1.6 8"4 6.5 6’5 8’3 IO’5 I "O 8"7 6"3 8"8 8’2 43 "5 5"7 49 "2 9.2 1.3 9"5 7.0 8.0 8.5 38"6 5.6 44’2 43"5 5"5 49.o
In spite of the large trade in cattle, numbers on the farms at the end of the year are not expected to fall. The number of mature cattle will be reduced but the, continuing expansion of the breeding herd will result in both larger numbers of young stock and more cows. Although the increase in inventory is large in terms of numbers, the change in the composition of the national herd will mean an expected increase in monetary terms of only £4½
[image:12.616.82.308.39.231.2]million.
TABLE II: FORECAST OF CATTLE PRODUCTION AND EXPORTS, 1964
The increase in cow numbers and in-calf heifers will lead to greater milk production. Deliveries to creameries are currently (June, 1964) reported to be almost i2 per cent. higher than in the Same period last year. This greater output will be paid fbr at
a higher price following the announcement that creamery milk will receive an extra 2d. per gallon
IO
effective from ist May, 1964. These two factors
will lead to a substantial increase in the value of milk output.
TABLE III: FORECAST OF MILK OUTPUT, 1964
Liquid milk ... Creamery milk ... Farmer’s butter .... Buttermilk and separated
milk ... TOTAL ... Quantity (mill. gals.) 133 370 60 563 Value (£ mill.) 15"6 33"4 4"0 0’2 5y2
Sheep production has shown a further increase in 1964 and has benefited by the boom in meat prices. Fat sheep were approximately £1 per head dearer in the first quarter of the year than in the same period in the previous year, and the level of demand on the export markets in the first half of 1964 has been good. Better prices and increased output will probably lead to a net output level of approximately £12"5 million. Wool prices appear to be considerably above those of 1963 with increases of over 6d.-8d. per lb. frequently reported. The larger clip from the bigger flock coupled with these improved prices would indicate an increase in output worth half a million pounds.
Deliveries of pigs to bacon factories are not expected to be much different from the level of the last two years. However, the budget contained provisions for the increase in the prices of Grade A pigs of 8/- per cwt. and of 5/- for A Specials. Accordingly the value of output has been increased to an estimated £25 million. The output of poultry and eggs is expected to remain at the i963 level, the slight increase in poultry output being offset by a small decline in the value of eggs. Similarly the output of horses has been projected at the same level as in 1963, as it is difficult to form any precise expectations as to the likely trend over the year as a whole.
The overall output is forecast to increase by £21"3 million, or by almost exactly IO per cent. The upward trend in some costs is likely to lead to some rise in the inputs of feedingstuffs, fertilisers and seeds. The net effect is, however, likely to be a substantial rise in net output from just over
[image:12.616.86.311.417.594.2]TABLE IV : AGRICULTURAL OUTPUT, 1962-1964
Crops :
Cereals ... Potatoes and sugar beet ... Other crops (incl. turf) ... TOTAL CROPS .... Livestock and
live-stock products : Cattle and hides .... Milk .... Sheep and lambs
Wool ...
Pigs ... Poultry ... Eggs ... Horses ... Other ... TOTAL LIV~TOCK .... Change in inventory TOTAL GROSS OUTPUT
Less seed, fertiliser
and feed ... NET OUTPUT ....
1962 Actual £ mill.
20’3 I5"1 13"8 .,1 49"2
58"7 45"8 i
IO’O 3"2 24"2 3’6 lO’4 3"7 0"2 159"7 +4"1 213"o --40.9 172. i
1963
I 1964 Previous forecast
forecast [ Actual [ £ mill. £ mill. £ mill[ __
20"0 I 17’2 19’7 15.0 I 13"o 14"3 14"o
[ I4"o [ I4"5 49"o I 44’2 48"5
r
63"5 62.o 46"5 47"8 II’O II’0 3"5 3"5 23"5 24"7 3"7 4’5 IO"5 lO’7 3 "6 3 .o o’1 0"3 165"9 I67.4 +i’i +3"6 216"O 215’2 --41"o --42"7 175"o 172"5
68’5 53"2 12’5 4"0 25 "o 4"7 I0’5 3"o O"I
I8I "5
+5"0 235"0 --45"0
For exports, the position is similarly shown here in detail.
TABLE V : AGRICULTURAL EXPORTS, 1962-1964
1963
I962 1964 Actual Previou----~l forecast
forecast [ Actual
£ mill. £ mill. I £ mill. £mill. Live animals :
Cattle ... 36"2 40"2 41 "6 56"0 Sheep ... I’9 2"O I"7 I’8 Others ... 5"9 6"0 5"7 5"8 TOTAL LIVE ANIMALS 44"0 48"2 49 "o 63 ’6 Meat :
Beef and veal Mutton and lamb’
I7"3 18"2 I7"7 12’6 3"7 4"0 4"1 4"3 Pork and bacon .... 8"2 8"o 9"4 9"5 Other meat and
meat products .... 9"4 2"4 2"4 2"4 TOTAL MEAT .... 3I’6 32"6 33"5 28 "8 Miscellaneous :
Poultry and eggs .... o’6 o’8 o’5 O’3 Dairy produce .... 13"I I5"O I6"I I9"2 Fruit and vegetables 3"3 3"5 1"8 2"5
Wool and hair .... 5"4 6"0 5"8 6’5 Hides and skins .... I’3 I’4 1"3 I’O Other products .... 4"2 4"0 6"2 5"5 TOTAL
MISCELLANEOUS .... 28"0 30"7 3I’7 35’o i9o"o TOTAL AGRICULTURAL
, EXPORTS .... 127"4
THE ECONOMIC RESEARCH INSTITUTE Reprint Series :
1. Commentary on "Europe’s Future in Figures"
R. C. Geary
2. Forms of Engel Functions
C. E. V. Leser
3. The Cost Structure of British Manufacturing, 1948--61
E. T. Nevin
4. The Life of Capital Assets: An Empirical Approach
E. T. Nevin
5. Estimation of Quasi-linear Trend and Seasonal Variation
C. E. V. Leser
6. The Pattern of Personal Expenditure in Ireland
C. E. V. Leser
THE ECONOMIC RESEARCH INSTITUTE Publication Series :
I. The Ownership of Personal Property in Ireland
Edward Nevin
2. Short Term Economic Forecasting and its Application in Ireland
Alfred Kuehn
3. The Irish Tariff and The E.E.C.: A Factual Survey
Edward Nevin
4. Demand Relationships for Ireland
C. E. V. Leser
5. Local Government Finance in Ireland: A Preliminary Survey
David Walker
6. Prospects of the Irish Economy in 1962
Alfred Kuehn
7. Tile Irish Woollen and Worsted Industry, 1946-59: A Study in Statistical Method R. C. Geary
8. The Allocation of Public Funds for Social Development
David Walker
9. The Irish Price Level: A Comparative Study
Edward Nevin 10. Inland Transport in Ireland: A Factual Survey
D. J. Reynolds
11. Public Debt and Economic Development
Edward Nevin 12. Wages in lreland, 1946--62
Edward Nevin 13. Road Transport: The Problems and Prospects in Ireland
D. J. Reynolds 14. Imports and Economic Growth in lreland, 1947-61
C. E. V. Leser 15. The Irish Economy in 1962 and 1963
C. E. V. Leser 16. Irish County lncomes in 1960
E. A. Attwood and R. C. Geary 17. The Capital Stock of lrish Industry
Edward Nevin
18. Local Government Finance and County lncomes
David Walker 19. Industrial Relations in Ireland: The Background
David O’Mahony 20. Social Security in Ireland and Western Europe
P. R. Kaim-Caudle
21. The Irish Economy in 1963 and 1964
C. E. V. Leser