Citation: The Journal of the Acoustical Society of America 137, EL449 (2015); doi: 10.1121/1.4921674
View online: https://doi.org/10.1121/1.4921674
View Table of Contents: https://asa.scitation.org/toc/jas/137/6
Published by the Acoustical Society of America
ARTICLES YOU MAY BE INTERESTED IN
Controlling the perceived distance of an auditory object by manipulation of loudspeaker directivity The Journal of the Acoustical Society of America 137, EL462 (2015); https://doi.org/10.1121/1.4921678
Perceptual Audio Evaluation—Theory, Method and Application
The Journal of the Acoustical Society of America 122, 16 (2007); https://doi.org/10.1121/1.2735112
On the relative importance of spatial and timbral fidelities in judgments of degraded multichannel audio quality The Journal of the Acoustical Society of America 118, 968 (2005); https://doi.org/10.1121/1.1945368
Subjective audio quality evaluation of embedded-optimization-based distortion precompensation algorithms The Journal of the Acoustical Society of America 140, EL101 (2016); https://doi.org/10.1121/1.4955025
No correlation between headphone frequency response and retail price
The Journal of the Acoustical Society of America 141, EL526 (2017); https://doi.org/10.1121/1.4984044
Mapping probability of shipping sound exposure level
ViSQOLAudio: An objective audio quality metric
for low bitrate codecs
AndrewHinesa)and EoinGillen
Sigmedia Group, School of Engineering, Trinity College Dublin, Ireland [email protected], [email protected]
DamienKelly,JanSkoglund,and AnilKokaram Google, Incorporated, Mountain View, California 94043, USA [email protected], [email protected], [email protected]
NaomiHarte
Sigmedia Group, School of Engineering, Trinity College Dublin, Ireland [email protected]
Abstract: Streaming services seek to optimise their use of bandwidth across audio and visual channels to maximise the quality of experience for users. This letter evaluates whether objective quality metrics can pre-dict the audio quality for music encoded at low bitrates by comparing objective predictions with results from listener tests. Three objective metrics were benchmarked: PEAQ, POLQA, and VISQOLAudio. The results demonstrate objective metrics designed for speech quality assess-ment have a strong potential for quality assessassess-ment of low bitrate audio codecs.
VC2015 Acoustical Society of America
[DOS]
Date Received:October 31, 2014 Date Accepted: May 12, 2015
1. Introduction
Media streaming is now an established method for listening to music and watching movie and TV content. Network bandwidth constraints are variable across the diverse range of devices on which content is consumed (e.g., mobile, desktop, home theatre). As a result, content distributors, such as YouTube, Netflix, or Spotify, must support a range of codecs and bit rates (“treatments”) to optimise consumers’ Quality of Experience (QoE).1Bandwidth allocation for multimedia streaming on mobile devices needs to opti-mise the QoE across senses and while 256 kb/s treatments can deliver QoE
indistinguish-able from uncompressed audio,2 any savings in the audio bandwidth could be used to
improve the video stream. To accommodate environments from smartphone to home theatre, both the video and audio content are transmitted in compressed form using lossy compression schemes. Psychoacoustic inspired compression schemes have output
signals that are optimised from the perspective of the human auditory system.3–6
Standard mean square error or segmental signal-to-noise ratios are not well suited to evaluating audio quality for modern codecs due to the optimised bit allocation resulting from psychoacoustic models.7,8Suitable objective metrics could help automate the evalu-ation of changes in QoE as a result of this transcoding process. Treatments that are
commonly used for streaming are examined here: AAC-HE and AAC-LC codecs9 at
four bit rates and examples of MP3 and OPUS codecs.10Prior work by the authors pre-sented subjective listener test results for these treatments.2 The treatments were subjec-tively evaluated in the context of stereo music to investigate whether listeners perceived differences in the audio quality for the codecs tested and whether presentation mode
(headphones/speakers) influenced the results. The results showed that listeners found some treatments were noticeably degraded while others were indistinguishable from the original uncompressed stereo audio samples. This work benchmarks four objective met-rics against the subjective listener test results carried out with headphones to evaluate their suitability for measuring audio quality for low bit rate codecs.
2. Objective metrics
Since the late 1980s objective quality metrics for audio have been actively developed.
The Perceptual Evaluation of Audio Quality (PEAQ) was standardised as
Recommendation ITU-R BS.1387 from 1998 to 2001.11There are two versions: a basic
version, which is optimised for speed, and an advanced model that adds a filterbank based ear model to the basic FFT-based model to improve accuracy. Both versions pro-duce a number of model output variables that are mapped to an objective difference grade (ODG) quality score via a multi-layer neural network. The ODG scale is an objec-tive approximation of the subjecobjec-tive difference grade used in Recommendation ITU-R
BS.1116 (Ref. 12) to determine small audio impairments. A decade later, ITU-T
Recommendation P.863 standardised a new objective metric for measuring speech qua-lity, called POLQA. POLQA was designed for speech quality assessment and can be run in narrowband mode (telephone quality; 300–3400 Hz) or superwideband (SWB) mode
(50–14 000 Hz). POLQA has been shown to have potential as an audio quality model13
and the developers of POLQA are currently working on adapting it for use in audio
quality evaluation. An alternative speech quality model called ViSQOL,14 has been
adapted for audio quality testing. This adapted metric is referred to as ViSQOLAudio and is described and evaluated in this letter. For benchmarking purposes, the commer-cially released POLQA version conforming to the P.863 standard is tested along with the basic and advanced versions of PEAQ (all supplied by Opticom, GmBH).
2.1 ViSQOLAudio metric
ViSQOL was developed as an objective speech quality metric.14–16 It is a full reference speech quality metric, comparable to POLQA, that uses similarity between spectrograms to measure quality. This paper presents ViSQOLAudio, an adaption of the ViSQOL speech quality metric. A detailed description of ViSQOL for speech quality can be found
in a previously published work.14 A small number of changes to the algorithm were
necessary for music and audio evaluation and they can be summarised as follows. The voice activity detection was removed to allow a comparison of the reference sample to the test sample. The basic system of comparing signals over spectrogram “patches” used by ViSQOL was retained and the patch alignment system is still performed between the reference and test patches but all patches from the reference signal are retained, i.e., all patches are considered “active.” The number of frequency bands evaluated was increased with standard Bark scale bands used from 50 to 13 500 Hz with an extra band centred at 16 000 Hz to cover the full bandwidth of hearing from 50 Hz to 20 kHz. This adjustment was necessary for audio evaluation as ViSQOL only covers the salient speech frequency bands, i.e., between 50 and 8000 Hz. The mapping from the raw similarity score to a speech MOS score was removed for ViSQOLAudio and the results are quoted
on a similarity scale from 0 to 1. A MATLABimplementation of ViSQOLAudio is
avai-lable to download from the authors’ website.17
3. Subjective and objective testing
The subjective tests were carried out using the MUSHRA test methodology that is
defined in ITU-R Recommendation BS.1534.1.18 Other audio quality test
methodolo-gies exist, but for low bit rate codec testing, MUSHRA is a good compromise between an absolute category rating test (e.g., ITU-R BS.1284-1) and a test for almost unde-tectable impairments (e.g., ITU-R BS.1116-2). Biases in MUSRHA tests have been
reported due to stimulus spacing and range equalising effects19 but MUSHRA has
been used in a variety of tests showing a good ability to rank low bit rate codecs.20,21
Following the MUSHRA methodology, listeners were presented with a labeled refer-ence and a number of unlabeled test samples (stimuli). The unlabeled samples were ranked using a numerical continuous scale ranging from 0 to 100 in five descriptive intervals: bad (0–20); poor (20–40); fair (40–60); good (60–80); and excellent (80–100). An unaltered version of the reference and two anchor samples (low-pass filtered ver-sions of the reference) were hidden amongst the treatments under test. Ten listeners ranked 12 music samples for 10 treatments (including the hidden reference and 2 anchors). Tests using Sennheiser HD558, high-quality open-backed headphones showed the least variance between listeners and are used as the ground truth subjective quality for objective metric evaluation. The subjective quality assessments by treatment are reproduced here in Fig. 1. Table 1 details the test material which consisted of stereo music samples of 7–15 s duration covering a variety of musical sounds. The test
materi-als were sourced from CDs and the EBU music database22 and were all originally
sampled at either 48 or 44.1 kHz, 16 bit stereo (so for 44.1 kHz two-channel audio, the bit rate is 1411.2 kb/s). Reference PCM WAV files were created at 48 kHz for all files. These were then coded and resampled using ffmpeg with Fraunhofer AAC encoder for AAC, libmp3lame for MP3, and libopus for Opus 1.1 to produce the range of
treat-ments in Table2. All samples were formatted as WAV PCM files for presentation and
evaluated by the authors to ensure no level difference was perceived between the refer-ence samples and the treatments. Each objective metric was used to compare the 12 reference samples with their 10 treatments. Further information on the subjective test-ing and a detailed analysis of the results was presented in prior work.2
Determining the influence of codecs and bitrates on audio is difficult. Aside from the inherently challenging task of quantifying subjective listener opinions on qual-ity, measuring audio quality must eliminate the influence of other factors on the listen-er’s quality of experience. Measuring with loudspeakers introduces the potential for room acoustics to influence results, while the choice of samples, rating methodology, number and expertise of listeners can potentially influence results. Music samples sensi-tive to bitrate reduction and frequency response were carefully chosen to exercise the codecs.22 The listener tests were carried out in a sound-proofed recording studio and repeated using two types of headphones and again with loudspeakers to evaluate the impact of listening equipment. The results using studio quality Sennheister HD558 headphones were used as the subjective ground truth. While the other listening equip-ment results exhibited the same trends, there were differences that may have been caused by masking of compression artefacts in the lower quality headphones and due to room reverberation for the loudspeakers. The choice of MUSHRA as a testing methodology allowed for listeners to compare treatments and rank them on a continu-ous scale. The subjective results across treatments and equipment indicated that
[image:4.612.132.484.539.664.2]listen-ers were remarkably consistent in their scoring.2 The data and results provided
confidence that the listener test experiments would be a useful starting point for assess-ing the potential of objective metrics to predict low bitrate codecs impact on audio quality.
4. Results
Figure1reproduces the results from the subjective listener tests. The higher bitrate codecs had quality scores almost indistinguishable from the reference uncompressed audio. The low pass filtered anchors and AAC-HE 24 kb/s were scored significantly lower.
Figure2 presents the objective results grouped per treatment type. The
AAC-LC 128 kb/s and AAC-AAC-LC 256 kb/s were ranked highest by all of the objective metrics in terms of their mean values. However, the error bars show that the results for a given treatment varied significantly across samples. For example, observe the standard devia-tion for the AAC-LC 256 kb/s as measured by PEAQ. An analysis of the per sample results that caused this large standard deviation showed that both PEAQ models had
estimates that clustered bi-modally with four samples between 0 and 1 (boz,
casta-nets, steely, vega) and another six samples between 3 and 4 (sopr, ravel, guitar,
harpsichord, contrabassoon, strauss). This is illustrated in Fig.2by the per-sample red circles on the PEAQ-Advanced plot for AAC-LC 256 kb/s. This indicates that for this particular codec, PEAQ exhibits a sensitivity to sample type that was not experienced
by the subjective listeners.2 No obvious pattern with respect to sample type was
observed for these clusters.
Accurate estimation of the quality of the low pass anchors was a problem for all of the metrics. While the subjective tests show that listeners rank the low pass treat-ments very poorly in comparison with even the very low bitrate AAC-HE 24 kb/s codec, this is not captured in the objective metric predictions.
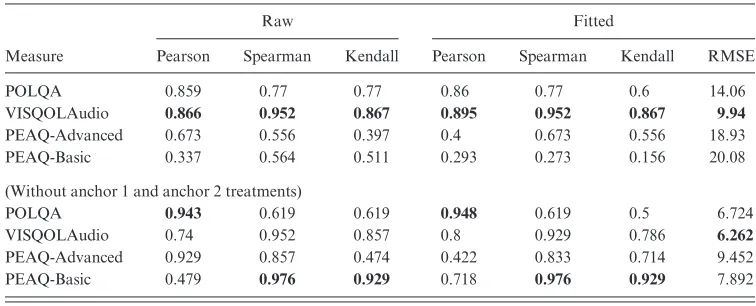
[image:5.612.117.494.99.193.2]Table 3 contains correlation coefficients for all metrics against the mean sub-jective scores grouped by treatment. Figure 2 gives an indication of the performance and also highlights the poor estimation of the anchors by all of the objective metrics tested. The Spearman and Kendall correlation results were very promising for VISQOLAudio, pointing to a strong capacity to rank the treatments correctly. However, tight clustering of a number of the treatments and the confidence intervals of the subjective ground truth MUSHRA scores should be taken into account before over interpreting the meaning of these statistics. POLQA and ViSQOLAudio are
Table 1. Music samples.
Label Music type Source Label Music type Source
[image:5.612.118.496.606.689.2]Boz Rock/R&B (Boz Scaggs) CD Glock Glockenspiel EBU Steely Soft Rock (Steely Dan) CD Contrabassoon Arpeggio/melodious phrase EBU Castanets Castanets EBU Harpsichord Arpeggio/melodious phrase EBU Moonlight Piano (Moonlight Sonata) CD Soprano Soprano singer EBU Vega Vocals (Suzanne Vega) CD Guitar Larry Coryell EBU Ravel Tzigane EBU Strauss R. Strauss (Orchestra) EBU
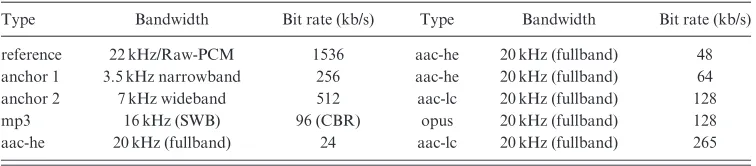
Table 2. Treatments.
Type Bandwidth Bit rate (kb/s) Type Bandwidth Bit rate (kb/s)
reference 22 kHz/Raw-PCM 1536 aac-he 20 kHz (fullband) 48 anchor 1 3.5 kHz narrowband 256 aac-he 20 kHz (fullband) 64 anchor 2 7 kHz wideband 512 aac-lc 20 kHz (fullband) 128 mp3 16 kHz (SWB) 96 (CBR) opus 20 kHz (fullband) 128 aac-he 20 kHz (fullband) 24 aac-lc 20 kHz (fullband) 265
comparable in their performance. Figure 3 presents a close-up view for scores above 60 on the MUSHRA scale for ViSQOLAudio and POLQA, i.e., excluding the two anchor treatments. POLQA had a good fit to all treatments with the exception of the anchors, while VISQOLAudio overestimates degradation in quality for the MP3 96 kb/ s treatment. The robustness of metrics to the type of sample content was better with VISQOLAudio than with POLQA or PEAQ, highlighted by the size of the error bars.
Table 3 also presents statistics excluding the two anchor points.
ViSQOLAudio is the most consistent across both scenarios although the correlation scores dropped without the anchor treatments. The RMSE has dropped for all meas-ures having removed the anchor treatments. Without them, the correlation statistics for PEAQ have noticeably improved but the high RMSE still highlights a lack of robustness between audio samples for a given treatment. The Pearson correlation for POLQA is also noticeably higher with these exclusions but the Spearman ranking warns that listeners’ treatment preferences are not captured.
5. Discussion and conclusions
The results for all metrics are promising, despite the fact that PEAQ was not designed with low bitrate codecs in mind and POLQA and ViSQOL were conceived as speech
[image:6.612.128.485.89.260.2]Fig. 2. (Color online) Mean objective metric results plotted against subjective MUSHRA quality scores per treatment for 12 samples. Error bars are 1 standard deviation. Red circles (unfilled) in PEAQ-Advanced plot are the individual sample results for aac256k.
Table 3. Correlation statistics for raw and regression fitted mean treatment scores. Top ranked measure for each statistic in bold.
Raw Fitted
Measure Pearson Spearman Kendall Pearson Spearman Kendall RMSE
POLQA 0.859 0.77 0.77 0.86 0.77 0.6 14.06
VISQOLAudio 0.866 0.952 0.867 0.895 0.952 0.867 9.94
PEAQ-Advanced 0.673 0.556 0.397 0.4 0.673 0.556 18.93 PEAQ-Basic 0.337 0.564 0.511 0.293 0.273 0.156 20.08
(Without anchor 1 and anchor 2 treatments)
POLQA 0.943 0.619 0.619 0.948 0.619 0.5 6.724 VISQOLAudio 0.74 0.952 0.857 0.8 0.929 0.786 6.262
[image:6.612.116.494.538.691.2]quality metrics. The adaptations to create ViSQOLAudio were essential as the speech version had no superwideband mode and was optimised for speech evaluation using a voice activity detector. The low standard deviation between samples for treatments is the most advantageous feature when comparing results with the other objective metrics.
POLQA performed well using the SWB speech mode. The statistics at a treat-ment level showed POLQA’s potential for this application but the ranking ability and sample level variation pointed towards difficulty in distinguishing between the smaller differences in treatments. This could well be addressed by the as yet unpublished audio-modified version of POLQA where alignment changes similar to those applied to ViSQOLAudio will likely be addressed. The results suggest only small adaptations are required. PEAQ showed much variation across different samples for the same treatment where the listener assessed quality was consistent. This letter highlights the need for continued development of objective metrics that can deal with the variety of new low bitrate codecs that have been developed. Further work and testing with a wider range of data is ongoing. ViSQOLAudio has promising potential as an objective audio quality metric and compares favourably with PEAQ for the lower bitrate codecs assessed.
Acknowledgments
Supported by Google, Inc. and Enterprise Ireland, Innovation Partnership Project No. IP-2013 0232.
References and links 1
European Network on Quality of Experience in Multimedia Systems and Services (COST Action IC 1003), Qualinet white paper on definitions of quality of experience, 2012.
2A. Hines, E. Gillen, J. Skoglund, D. Kelly, A. Kokaram, and N. Harte,Perceived Audio Quality for
Streaming Stereo Music(ACM Multimedia, Orlando, 2014).
3R. Heusdens and S. van de Par, “Rate-distortion optimal sinusoidal modeling of audio and speech using psychoacoustical matching pursuits,” in2002 IEEE International Conference on Acoustics, Speech, and Signal Processing (ICASSP)(May, 2002), Vol. 2, pp. II-1809–II-1812.
4B. C. J. Moore, “Masking in the human auditory system,” inAudio Engineering Society Conference:
Collected Papers on Digital Audio Bit-Rate Reduction(May, 1996). 5
T. Painter and A. Spanias, “Perceptual coding of digital audio,” Proc. IEEE88(4), 451–515 (2000). 6E. Zwicker and U. T. Zwicker, “Audio engineering and psychoacoustics: Matching signals to the final
re-ceiver, the human auditory system,” J. Audio Eng. Soc.39(3), 115–126 (1991). 7
S. Kandadai, J. Hardin, and C. D. Creusere, “Audio quality assessment using the mean structural simi-larity measure,” inIEEE International Conference on Acoustics, Speech and Signal Processing, 2008. ICASSP 2008(2008), pp. 221–224.
8
J. You, U. Reiter, M. M. Hannuksela, M. Gabbouj, and A. Perkis, “Perceptual-based quality assessment for audio–visual services: A survey,” Sign. Process.: Image Commun.25(7), 482–501 (2010).
9ISO/IEC 13818-7:2006:Information Technology—Generic Coding of Moving Pictures and Associated
Audio Information—Part 7: Advanced Audio Coding (AAC) (International Organization for Standardization, Geneva, Switzerland, 2006).
[image:7.612.126.487.88.169.2]10J.-M. Valin, K. Vos, and T. B. Terriberry, “Definition of the Opus audio codec,” IETF (2012), URL RFC6716, http://www.ietf.org/rfc/rfc6716.txt (Last viewed 21 May 2015).
Fig. 3. Close-up of Fig.2for ViSQOLAudio and POLQA. Anchor treatments are excluded and range of axes has been reduced.
11
Rec.ITU-R.BS.1387: Perceptual Evaluation of Audio Quality (PEAQ) (International Telecommunication Union, Geneva, 1998).
12Rec.ITU-R.BS.1116-2:Methods for the Subjective Assessment of Small Impairments in Audio Systems (International Telecommunication Union, Geneva, 2014).
13M. H. Pinson, C. Schmidmer, L. Janowski, R. Pepion, Q. Huynh-Thu, P. Corriveau, A. Younkin, P. Le Callet, M. Barkowsky, and W. Ingram, “Subjective and objective evaluation of an audiovisual subjective dataset for research and development,” in2013 Fifth International Workshop on Quality of Multimedia Experience (QoMEX)(2013), pp. 30–31.
14
A. Hines, J. Skoglund, A. Kokaram, and N. Harte, “Robustness of speech quality metrics to background noise and network degradations: Comparing ViSQOL, PESQ and POLQA,” in2013 IEEE International Conference on Acoustics,Speech and Signal Processing (ICASSP)(2013).
15A. Hines, P. Pocta, and H. Melvin, “Detailed comparative analysis of PESQ and VISQOL behaviour in the context of playout delay adjustments introduced by VOIP jitter buffer algorithms,” in2013 Fifth International Workshop on Quality of Multimedia Experience (QoMEX)(July, 2013), pp. 18–23. 16
A. Hines, J. Skoglund, A. Kokaram, and N. Harte, “ViSQOL: The virtual speech quality objective listener,” in 2012 International Workshop on Acoustic Signal Enhancement (IWAENC) (September, 2012), pp. 1–4.
17ViSQOLAudio, “MATLAB [computer program],” http://www.sigmedia.tv/tools (Last viewed 21 May 2015).
18
Rec.ITU-R.BS.1534-1:Method for the Subjective Assessment of Intermediate Sound Quality (MUSHRA)
(International Telecommunication Union, Geneva, 2003). 19
S. Zielinski, P. Hardisty, C. Hummersone, and F. Rumsey, “Potential biases in MUSHRA listening tests,” inAudio Engineering Society Convention 123(2007).
20
C. Hoene, J.-M. Valin, K. Vos, and J. Skoglund, “Summary of Opus listening test results—Internet-draft,” IETF (2012), http://tools.ietf.org/html/draft-ietf-codec-results (Last viewed 21 May 2015). 21D. Marston and A. Mason, “Cascaded audio coding,” EBU technical review (2005), https://tech.ebu.ch/
publications/trev_304-cascading (Last viewed 21 May 2015).