ScholarWorks @ Georgia State University
ScholarWorks @ Georgia State University
Economics Dissertations
Spring 5-15-2010
Essays in Experimental and Environmental Economics
Essays in Experimental and Environmental Economics
Sarah Jacobson Georgia State University
Follow this and additional works at: https://scholarworks.gsu.edu/econ_diss Part of the Economics Commons
Recommended Citation Recommended Citation
Jacobson, Sarah, "Essays in Experimental and Environmental Economics." Dissertation, Georgia State University, 2010.
https://scholarworks.gsu.edu/econ_diss/66
PERMISSION TO BORROW
In presenting this dissertation as a partial fulfillment of the requirements for an advanced degree from Georgia State University, I agree that the Library of the University shall make it available for inspection and circulation in accordance with its regulations governing materials of this type.
I agree that permission to quote from, to copy from, or to publish this dissertation may be granted by the author or, in his or her absence, the professor under whose direction it was written or, in his or her absence, by the Dean of the Andrew Young School of Policy Studies. Such quoting, copying, or publishing must be solely for scholarly purposes and must not involve potential financial gain. It is understood that any copying from or publication of this dissertation which involves potential gain will not be allowed without written permission of the author.
NOTICE TO BORROWERS
All dissertations deposited in the Georgia State University Library must be used only in accordance with the stipulations prescribed by the author in the preceding statement.
The author of this dissertation is:
Sarah A. Jacobson 5641 Rosser Court SW Lilburn, GA 30047
The director of this dissertation is:
Ragan A. Petrie
Department of Economics and
Interdisciplinary Center for Economic Science (ICES) George Mason University
4400 University Drive, MSN 1B2 Fairfax, VA 22030
Users of this dissertation not regularly enrolled as students at Georgia State University are required to attest acceptance of the preceding stipulations by signing below. Libraries borrowing this dissertation for the use of their patrons are required to see that each user records here the information requested.
Type of use
ESSAYS IN EXPERIMENTAL AND ENVIRONMENTAL ECONOMICS
BY
SARAH ANDREA JACOBSON
A Dissertation Submitted in Partial Fulfillment of the Requirements for the Degree
of
Doctor of Philosophy in the
Andrew Young School of Policy Studies of
Georgia State University
Copyright by Sarah Andrea Jacobson
ACCEPTANCE
This dissertation was prepared under the direction of the candidate’s Dissertation Committee. It has been approved and accepted by all members of that committee, and it has been accepted in partial fulfillment of the requirements for the degree of Doctor of Philosophy in Economics in the Andrew Young School of Policy Studies of Georgia State University.
Dissertation Chair: Ragan A. Petrie
Committee: H. Spencer Banzhaf James C. Cox Vjollca Sadiraj
Electronic Version Approved:
Robert E. Moore, Dean
Andrew Young School of Policy Studies Georgia State University
iv
ACKNOWLEDGEMENTS
I am deeply grateful to Ragan Petrie. She took me on as a research assistant when
I was a very risky asset. My development as a researcher and an economist owes more to
her guidance than I can say. With real generosity, she brought me into her research and
encouraged me in my own. She has been wonderful as an advisor and as a friend, and I
hope I can look forward to many more years of co-authorship and friendship with her.
Spencer Banzhaf’s advice and support have been indispensable. He has an
exceptionally strong sense of intellectual integrity and pushes me to keep the same
standard. At the same time, he has been a real champion for me and has looked out for
me as if he were my second chair.
Vjollca Sadiraj and Jim Cox were also instrumental in bringing me to this point.
They brought their respective hefty intellects to bear on my work and, in so doing,
improved it greatly. It has been a pleasure and an honor to get to know them both.
Others who provided important comments on this research include Paul Ferraro,
Marco Castillo, Jason Delaney, Michael Roberts, and participants in the classes,
workshops, seminars, and conferences in which I have presented my work. I thank
Ruben Lubowski for data used in Chapter II and Ragan Petrie and the World Council of
Credit Unions for use of data for Chapter III. Financial support for the research in
Chapter I came from the National Science Foundation and Georgia State University.
Finally, my husband and my family have been a constant source of love, patience,
v
CONTENTS
TABLES ... vii
FIGURES ... ix
ABSTRACT ... x
Chapter I: The Girl Scout Cookie Phenomenon ... 1
Introduction ... 1
Experimental Design ... 7
Results ... 16
Treatment Effects ... 18
Direct Reciprocity and Other-Regarding Preferences ... 21
Indirect Reciprocity ... 25
Heterogeneity in the Population ... 26
Conclusion ... 29
Chapter II: The Effects of Conservation Reserve Program Participation on Later Land Use ... 32
Introduction ... 32
Theory ... 37
Methods ... 39
Data and Summary Statistics... 45
Results ... 49
Binary Land Use Outcome Results ... 49
Multinomial Land Use Outcome Results ... 55
Conservation Practice Results ... 58
Conclusion ... 61
Chapter III: Learning from Mistakes ... 63
Introduction ... 63
Financial Instruments in Rwanda ... 67
Experiment ... 69
Experiment Design ... 71
vi
Defining Anomalous Choices ... 74
Results ... 77
Inconsistent Choices ... 77
Risk Aversion ... 80
Error Choice Model ... 82
Inconsistent Choice and Financial Decisions ... 85
Conclusions ... 92
Appendix A: Instructions for the Girl Scout Cookie Experiment... 94
Appendix B: Parametric Tests of Reciprocity in the Girl Scout Cookie Experiment .... 111
Appendix C: Predictions of Risk Preference Theories ... 115
Expected Value ... 115
Expected Utility... 116
Rank Dependent Theory, Prospect Theory, and Cumulative Prospect Theory ... 118
Dual Theory... 121
References ... 123
vii
TABLES
1. Average Contributions by Treatment and Role (Percent of Endowment) ... 19
2. Average Contributions by Treatment and Bachelor Status (Percent of Endowment) ... 19
3. Average Non-Stakeholder Contributions across All Rounds by Stakeholder's Past Generosity toward Subject (in Percent of Endowment) ... 23
4. Average Non-Stakeholder Contributions by Stakeholder’s Past Generosity toward Subject, after Last Stakeholder Stint (in Percent of Endowment) ... 24
5. Behavioral Types from Estimation / Classification Procedure ... 28
6. Treatment-to-Treatment Type Transitions: Percent of Subjects Making Each Transition ... 29
7. Characteristics of Land in Subsets of NRI Sample ... 48
8. Land Use Results with Naïve (Un-Pre-Processed) Sample ... 51
9. Land Use Results with Pre-Processed Samples ... 52
10. Land Use Multinomial Logit Results ... 56
11. Conservation Practice Results ... 60
12. Lottery Treatment Payoffs (in Rwandan Francs, 500 RWF=$1 US*)... 71
13. Distribution of Choices over Sequential-Choice Lottery Treatments (in percent) ... 78
14. Choices over Gain and Loss (Numbers of Subjects) ... 80
15. Mean Risk Aversion Measures by Lottery Treatment ... 81
16. Estimated Population Preferences for Lottery Choice Patterns ... 84
17. Summary Statistics... 86
18. Probability of At Least One Inconsistent Choice (OLS Regression) ... 87
viii
20. Financial Decisions with Inconsistency Measures (OLS Regressions with Bootstrapped Errors) ... 90
21. Fixed Effects Panel Regression of Non-Stakeholder Contribution (in Percent of Endowment) on Period-Level Covariates... 112
22. Fixed Effects Panel Regression of Non-Stakeholder Contribution (in Percent of Endowment) on Period-Level Covariates, Post-Last Stakeholder Stint ... 113
23. Panel Stacked Regression of Average Contribution (in Percent of
ix
FIGURES
1. Public Treatment Decision Screen ... 12
2. Private Treatment Review Screen ... 13
3. Ineligible Treatment Review Screen ... 14
4. Contributions by Treatment and Role across Rounds (in Percent of
Endowment) ... 17
5. Distribution of Non-Stakeholder Contribution Amounts, Pooled across
Rounds ... 21
6. Preferences Over Wealth to Explain Inconsistency ... 75
x
ABSTRACT
ESSAYS IN EXPERIMENTAL AND ENVIRONMENTAL ECONOMICS
By
Sarah Andrea Jacobson
May, 2010
Committee Chair: Dr. Ragan Petrie
Major Department: Economics
The chapters of this dissertation explore complementary areas of applied
microeconomics, within the fields of experimental and environmental economics. In
each case, preferences and institutions interact in ways that enhance or subvert efficiency.
The first chapter, ―The Girl Scout Cookie Phenomenon,‖ uses a laboratory
experiment to study favor trading in a public goods setting. The ability to practice
targeted reciprocity increases contributions by 14%, which corresponds directly to
increased efficiency. Subjects discriminate by rewarding group members who have been
generous and withholding rewards from ungenerous group members. At least some
reciprocal behavior is rooted in other-regarding preferences. When someone is outside
the ―circle of reciprocity,‖ he gives less to the public good than in other settings. We find
no evidence of indirect reciprocity. We find two behavioral types in each treatment,
differing in baseline giving but not in tendency to reciprocate.
The second chapter, ―The Effects of Conservation Reserve Program Participation
on Later Land Use,‖ studies another public goods issue: conservation. The Conservation
Reserve Program (CRP) pays farmers to retire farmland. We use a treatment effect
xi
non-CRP land. This implies that the CRP improves low-quality land, making it more
attractive to farm. This could demonstrate inefficiency, since farmers gain private benefit
from a program meant to provide a public good. On the other hand, farmed ex-CRP land
is more likely to adopt conservation practices, although this may not be caused by CRP
participation.
The third chapter, ―Learning from Mistakes,‖ examines financial decisions by
adult Rwandans in institutions inside and outside the lab. Over 50% of subjects make
irrational choices over risk—choices that likely do not reflect their preferences, and are
therefore likely inefficient—and these subjects share tendencies in their take-up of
financial instruments. Risk-averse individuals are more likely to belong to a savings
group and less likely to take out an informal loan. For those who make mistakes,
however, as they become more risk averse, they are less likely to belong to a savings
Chapter I: The Girl Scout Cookie Phenomenon Peer Pressure in Grassroots Fundraising
Introduction
People seem to have a natural tendency to engage in reciprocal behavior. Their
motives, however, are often ambiguous: the same actions can be explained by
other-regarding preferences or by strategic motives. The distinction is important, because in
many settings selfish motives alone cannot sustain cooperative behavior. The existence
of other-regarding preferences has been documented in isolated laboratory experiments,
but self-interest may dominate in richer field settings. Can institutions leverage
other-regarding preferences while still harnessing the strategic motives of selfish people to
promote pro-social behavior? One institution that may serve this purpose is grassroots
fundraising. We report the results from a laboratory experiment that mimics elements of
this institution to study the power of favor trading to support a public good. The design
of our treatments ―subtracts away‖ the possibility of each of a number of behavioral
motives so that we can cleanly isolate the effects of direct and indirect reciprocity. We
find evidence of direct reciprocity (rooted in other-regarding preferences), but a notable
lack of indirect reciprocity.
Our methods and results are best understood through analogy to grassroots
fundraising. Many nonprofit organizations fundraise by enlisting citizen boosters to
solicit donations from their social networks. Such a fundraiser makes direct, personal
solicitations to people with whom he has an ongoing relationship. Donations are revealed
Girl Scouts of the USA, an organization that works with American girls. The Girl
Scouts’ most prominent fundraiser is the annual drive in which member girls and their
families sell cookies to friends, family, and neighbors. Klein (1990) argues that social
favor trading played a role in the funding of turnpikes in early America. The same
dynamic may occur when it is not money but time and effort being solicited, as may
happen in a volunteer advisory board or a school’s parent-teacher association.
This fundraising technique is so common that social networks are sometimes full
of people with ―pet causes‖ for which they are fundraising. Imagine that Joe and Frank
work in an office together. Joe’s son is in Boy Scouts, and Frank’s daughter is in Girl
Scouts. Each child’s organization has an annual fundraiser: Joe’s Boy Scout sells
popcorn in January, and Frank’s Girl Scout sells cookies in February. Each has a special
interest in his child’s fundraiser, because of the family’s stake in the organization’s
success. As a result, Joe will buy popcorn and Frank will buy cookies, but in addition,
Joe wants Frank to buy popcorn, and Frank wants Joe to buy cookies. Even if Frank is
not interested in the Boy Scouts (or the popcorn), Frank may buy Joe’s popcorn in
January, hoping that Joe will reciprocate when Frank’s cookie fundraiser comes around
the next month. These peers use the promise of future reciprocation—in a favor trading
exchange like many that arise in social situations—to pressure each other to perform the
pro-social act of giving to charity.
We study whether and to what extent favor trading can increase pro-social
behavior, and we look at the motives behind this behavior. Our research questions are as
public good? Is giving in this setting driven by direct reciprocity, indirect reciprocity, or
only strategic self-interest? Is there important heterogeneity in behavior?
These questions, and the efficacy of the favor trading public goods institution in
general, are difficult to study in non-experimental settings because selective use of
fundraising techniques can cause endogeneity problems in the analysis. For example,
Long (1976) found that the more ―personal‖ a donor solicitation, the more contributions
were solicited, and inferred that the reason was that a more personal solicitation allowed
the fundraiser to exert peer pressure on the donor. However, this analysis is biased in
favor of finding a relationship: personal solicitations are more costly to perform, so
charities may limit their most personal solicitations to a ―hot list‖ of likely donors.
This study fits into the literature examining social influences on cooperative
behavior. We focus on the roles of immediate interest, altruism, strategic
self-interest, direct reciprocity, and indirect reciprocity. Conditional cooperation, a general
form of reciprocal behavior, may influence giving in public goods games as surveyed in
Gächter (2007); this will be a background force in all of our treatments. While
immediate self-interest and altruism are well-known concepts, the other motives require
explanation. See Sobel (2005) for a review of the literature on interdependent
preferences and reciprocity, including a helpful comparison of the terminology from
various models. We use the phrase ―strategic self-interest‖ to describe Sobel’s
―instrumental reciprocity,‖ in which apparently reciprocal actions are undertaken to win
future rewards (i.e. purely for selfish reasons). One characteristic of strategic self-interest
is that, since strategic motivations depend on future rewards, the removal of those future
strategically-motivated, finitely-repeated games that depend on cooperation tend to
unravel from the end period. Strategic cooperation could look like unconditional
cooperation, but it could also be conditional: a wise strategic person should ―bribe‖ only
people who have shown a tendency to reciprocate.
In contrast to strategic cooperation, we use the terms ―direct reciprocity‖ and
―indirect reciprocity‖ to describe conditional urges rooted in other-regarding preferences
(Sobel’s ―intrinsic reciprocity‖). Important models of this kind of reciprocity include
Rabin (1993) and Cox, Friedman, and Sadiraj (2008). Most models of this type allow
Joe’s preferences over Frank’s payoffs to depend on Frank’s past actions. Because these
kinds of reciprocity are rooted in other-regarding preferences, they can sustain
cooperation even in cases where strategic cooperation would unravel. Biologists (e.g.,
Trivers 1971) have recognized the potential for reciprocity in general to promote
pro-social behavior and to help pass on positive traits.
In the case of direct reciprocity, the reciprocator responds to acts that directly
affected him. For example, if Joe is a direct reciprocator, he may reward Frank for
Frank’s past behavior toward Joe. Direct reciprocity is difficult to distinguish from
strategic cooperation except that it implies continued reciprocation during end periods.
Other researchers have examined direct reciprocity using one-shot games, often with
some form of an investment game (e.g., Cox 2004). In our setting, we find direct
reciprocity in the final periods of a repeated game.
Indirect reciprocity occurs when a disinterested third party rewards good
and has no pet cause of her own. If Rita rewards Frank for patronizing Joe’s charity,
she’s exhibiting indirect reciprocity. Some (e.g., Nowak and Sigmund 2005) argue that
indirect reciprocity could be a powerful tool for boosting cooperation in a large, diffuse
group.
We test for indirect reciprocity by exogenously assigning one subject to a position
from which he can differentially reward others but he himself can never be rewarded. In
this way, he benefits very little from establishing a norm of cooperation in his group.
This is a strict test of indirect reciprocity. Other studies (for example, Engelmann and
Fischbacher 2009; Seinen and Schram 2006) have found indirect reciprocity by having
subjects play one-shot cooperation games in pairs, randomly re-matching them, and
reporting to each subject’s new partner a statistic (e.g., an ―image score‖) that reflects this
subject’s past generosity. This definition of indirect reciprocity is less strict than our
definition, in that it allows indirect reciprocators to benefit from a norm of cooperation in
the group.
While laboratory experiments provide clean, controlled tests, critics have argued
that other-regarding preferences inferred from such tests are artifacts of laboratory
methods and have no relevance for behavior outside the lab. Dictator games and
investment games, often used to study altruism and reciprocity, have received particular
criticism. Some of this criticism focuses on the results of field experiments that imply
that strategic (reputation) concerns are more important than other-regarding preferences.
For example, List (2006) found that ―gift exchange‖ behavior by sports card traders is
only seen when there is an incentive to maintain a reputation, and Soetevent (2005) found
increase donations. As discussed in Falk and Heckman (2009), incentivized behavior
observed in the lab is just as ―real‖ as behavior observed in field settings, and
context-specificity is just as much of a problem for field results as it is for lab results. We take
the view that apparent conflicts between lab and field findings simply show that social
forces must be studied in a variety of controlled settings to learn in what ways they are
sensitive to institutional features.
We contribute to the literature in a number of ways. First, our ―Stakeholder‖
public goods game integrates a vehicle for targeted reciprocity into the public goods
setting, to emulate the favor trading that occurs in social networks.1 The design allows us
to isolate reciprocal behavior and test for other-regarding preferences. Second, we
include a ―Bachelor‖ design as a clean test for indirect reciprocity. Third, using a
within-subject design, we observe shifts in behavior across institutions and use an endogenous
type classification method to study heterogeneity and sensitivity to institutions.
We find that average contributions increase by 14% when targeted reciprocal acts
are possible. We confirm that reciprocal behavior is the cause for this increase, and that
this is rooted (at least in part) in other-regarding preferences. Using our strict, clean test,
we do not find evidence of indirect reciprocity. We find meaningful heterogeneity in
giving behavior, and we find some stability in behavior across treatments.
The paper proceeds as follows. The next section describes the three experimental
treatments. In the following section, we present results. In the final section, we conclude.
Experimental Design
The experiment is a linear public goods game, with publicly revealed
contributions and asymmetric payoffs. Subjects are assigned to five-person groups for a
number of rounds. In each round, each person has an endowment of z tokens to allocate
between a private investment with return a to himself and a public investment with some
return to all group members. In each round, one group member is the Stakeholder: he has
a bigger stake in the public good, in that he gets a higher return (relative to other
members) from tokens invested there. The Stakeholder position rotates through group
members. The public good return is b for non-Stakeholders and c for Stakeholders.
Person i’s contribution to the public good in round t is git, and Staket is the index of the
person who is Stakeholder in round t. Payoffs are:
jt it t
j it
jt it t
j
c g a z g if Stake i
b g a z g if Stake i
The parameters are such that b < a < c and a < 4b + c, so the social optimum is
achieved if everyone contributes fully. Since (c – a) is positive, the Stakeholder
maximizes profit by contributing as much as possible, so even a selfish Stakeholder
always contributes to the public good. Since (b – a) is negative, non-Stakeholders face a
dilemma: they maximize profit by keeping all of their tokens, but this free riding is
anti-social. Non-Stakeholder contributions will be the focus of our analysis.
We use ui(m, y1, y2, y3, y4) to represent utility for subject i in any given round from
y2, y3, y4 in this round. Designate the current Stakeholder as person k (and since
non-Stakeholder contributions are of greatest interest, k≠i).
We borrow a nonparametric model of reciprocity from Cox, Friedman, and
Sadiraj (2008) to describe reciprocal preferences. Specifically, we note that i's marginal
rate of substitution between his own payoff and that of another subject yj may depend on
j’s past generosity toward i. If subject j was generous in the past, then i may have a lower
marginal rate of substitution (a higher willingness to pay) and thus be willing to sacrifice
his own payoff to increase j’s. That is, as a non-Stakeholder he may sacrifice high
earnings from the private investment so that he can (through a public good contribution)
increase the earnings of a subject j who has previously increased i's earnings.
In any given round, a non-Stakeholder’s (i's) contributions increase the payoff of
the other three non-Stakeholders (j≠i,k) and also the Stakeholder (k). Thus i's public good
contributions may be intended to increase the payoffs of any subject (y1, y2, y3, y4).
However, for each token contributed, the Stakeholder benefits by c and the
non-Stakeholders only benefit by b (recall b < a < c). Similarly, his contributions may be a
reaction to past contributions to the public good from any round. However, his earnings
are increased most by contributions made when he was Stakeholder. Therefore, he is
most likely to respond to generosity that occurred when he was Stakeholder.
A selfish person places no weight on others’ payoffs y1, y2, y3, y4, regardless of the
other subjects’ previous generosity. An unconditional altruist has a constant willingness
to pay to increase others’ payoffs, and has the same willingness to pay for all four group
depends on that other subject’s past generosity. (A person who is ―practically selfish‖ for
the purposes of this experiment is one whose willingness to pay to increase others’
payoffs never increases above the opportunity cost of a public good contribution. A
―practically selfish‖ person may be a mild altruist, a mild reciprocator, or a reciprocator
who encounters only low contributors.)
Beliefs are important in determining the actions of strategic actors. If a subject is
selfish and believes that everyone else is either selfish or an unconditional altruist, he will
not contribute. If he is selfish but strategic, however, he may believe that he can
influence his group members to have a greater willingness to pay for his benefit. That is,
if he believes his group members are reciprocators, he may believe he can win future
earnings (particularly in rounds when he will be Stakeholder) by contributing to the
public good this period. Note that this future potential benefit becomes quite small once
a subject has no future Stakeholder stints. Thus, a strategic but selfish person may
cooperate in early rounds but cease to do so after he passes his last Stakeholder stint. His
early-round cooperation may target people he expects to be reciprocators (no benefit can
be gained from sacrificing for an unconditional altruist or a selfish person), and he may
learn these types by observing other subjects’ past behavior. As a result, this early-round
strategic cooperation may depend on history in much the same way that reciprocal
altruism may.2
We report three treatments: Private, Public, and Ineligible, all described in detail
below. All three use endowment z = 20 tokens, private good return a = $0.02,
Stakeholder public good return b = $0.01, and Stakeholder public good return c = $0.03.
For non-Stakeholders, the ―price of giving‖ is 2, while for Stakeholders it is 2/3. All
subjects participated in all three treatments, in a different group for each treatment, with
treatment order varied across sessions.
The experiment is computerized and proceeds as follows. Subjects enter the lab
and are given general instructions. (All instructions are in Appendix A.) They are told
that they will play three sets of rounds with three different groups. The first treatment
begins, with a set of specific instructions that explain the information conditions and the
number of rounds for this treatment. The subjects play through all of the rounds for that
treatment. When the first treatment is over, the groups are reshuffled. The second and
third treatments proceed in much the same way, each with treatment-specific instructions.
After all three treatments are complete, a questionnaire is administered and the subjects
are paid anonymously. Subjects’ total earnings are the sum of their earnings in each
treatment, which in turn are the sum of earnings in each round.
In the software for all three treatments, subjects see first a decision screen and
then a review screen for each round. In both the decision and review screens, the central
feature is the contribution table. This table contains a row for each round in the
treatment. Columns contain information on the subject’s contribution and the
contributions of others in his group, the group’s total contributions, and the subject’s own
earnings. Information is filled into this table after the decision stage of each round, and
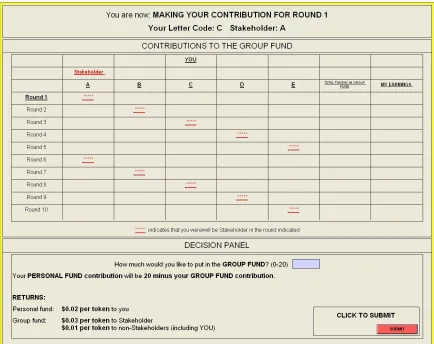
The Public treatment, which lasts ten rounds, follows the basic favor-trading
public goods design outlined above. The Stakeholder position rotates through all five
group members so everyone is Stakeholder twice. Contributions are publicly revealed
and tracked individually, and Stakeholder assignments are common knowledge. Figure 1
shows the decision screen of the Public treatment. Each group member is randomly
assigned a letter code (A, B, C, D, or E) and keeps the same letter code for all ten rounds.
The contribution table shows in which rounds each subject will be the Stakeholder. Since
contribution history is public and everyone knows when each group member will be
Stakeholder, subjects can reward each other for past generosity. For example, if Joe is
subject A and Frank is subject B, Joe can see how much Frank contributed in Round 1
when Joe was the Stakeholder (when he raised funds for the Boy Scouts). Joe can reward
Frank with a large contribution when Frank is Stakeholder in Round 2 (when Frank
fundraises for the Girl Scouts), or Joe may withhold that reward if he deems Frank’s
Figure 1. Public Treatment Decision Screen
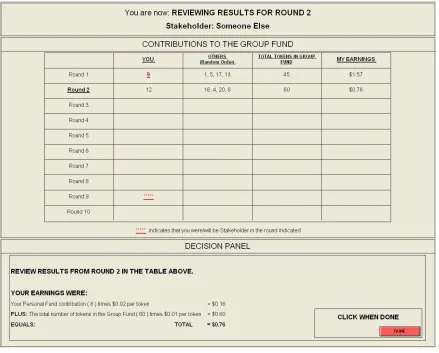
The Private treatment also lasts for ten rounds. The Stakeholder position still
rotates through all group members so that everyone is Stakeholder twice. However, the
information environment differs from the Public treatment. Each subject still sees the
disaggregated (individual) contributions of his group members, but subjects are not
assigned letter codes. It is no longer possible to track subjects’ reputations. Figure 2
shows the review screen of the Private treatment. In each round’s row, the contribution
table reports the contributions of all group members in a randomly-ordered list,
re-shuffled for each round. Further, even if a subject believes he can identify a group
when that person will be Stakeholder. He only knows when he himself will be the
Stakeholder, so he can’t target reciprocal acts toward any other particular subject. The
Private treatment is a good baseline against which to compare Public treatment behavior
because, as Sell and Wilson (1991) show, reporting disaggregated instead of mean or
[image:27.612.110.549.237.590.2]total contributions in a public goods game may increase contributions.
Figure 2. Private Treatment Review Screen
Finally, the Ineligible treatment is very much like the Public treatment, with
randomly-assigned letter codes (not linked to the Public treatment letter codes), public
group (the ―Bachelor‖) is ineligible to be the Stakeholder. To return to our guiding
analogy, the ―Bachelor‖ is Rita, Joe and Frank’s officemate who does not have a pet
cause for which to fundraise. Because only four subjects are eligible to be Stakeholder,
the Ineligible treatment lasts eight rounds, so each eligible subject is still Stakeholder
twice. The Bachelor is randomly chosen and remains the Bachelor for the entire
treatment. The computer screens for the Ineligible treatment (Figure 3) are like those for
the Public treatment, except that the Bachelor is indicated in the screen header and in the
contribution table as the ―Ineligible‖ person. The Stakeholder position rotation skips the
[image:28.612.109.546.345.695.2]Bachelor: if person D is the Bachelor, the Stakeholder is A, then B, then C, then E, etc.
The difference between the Public and Private treatments is that direct reciprocity,
indirect reciprocity, and strategic self-interest cannot motivate giving in the Private
treatment, because subjects don’t have the information they would need to respond to
each others’ actions. (Unconditional altruism and conditional cooperation—response to
overall group behavior—can affect giving in both treatments; actions targeted directly at
another individual are only possible in the Public treatment.) In the Public treatment, all
of these forces are in play because reputations and Stakeholder identities are public. Any
difference between the Public and Private treatments must be due to direct reciprocity,
indirect reciprocity, and/or strategic giving.
Within the Public treatment, we will be able to see whether subjects are
responsive to past generosity: that is, whether they discriminate by giving larger
contributions when the current Stakeholder is someone who was previously generous. In
any given round, subjects may respond to the past behavior of both the current
Stakeholder and the current non-Stakeholders. However, if we detect this kind of
responsiveness with regard to the current Stakeholder’s past actions, this is sufficient
demonstrate reciprocal giving. We can identify direct reciprocity as responsiveness of
this type that does not disappear as the end period approaches.
The Ineligible treatment allows us to investigate two additional questions. First,
the Bachelor herself (Rita, in our analogy) is not subject to direct reciprocity or strategic
self-interest. If the Bachelor does give in a way that responds to the Stakeholder’s past
generosity, this would be evidence of indirect reciprocity. Second, the presence of a
Bachelor shrinks the ―neighborhood of reciprocity‖ from five people to four people. This
herself does not contribute. We can observe whether this change in the group dynamic
affects non-Bachelor contributions. For example, others may be discouraged by
supporting a Bachelor who freeloads off the public good.
The experiments were run in the Experimental Economics Center (ExCEN) at
Georgia State University in six separate 20-subject sessions, for a total of 120 subjects.
The software was written in z-Tree (Fischbacher 2007). The protocol was double
anonymous (subject decisions were anonymous even from the perspective of the
experimenter). Of the 120 subjects, 75 (62.5%) were female and the average age was
21.8. The experiment lasted about 90 minutes, and subjects earned on average $24.33
(standard deviation $2.67).
Results
As described above, each subject participated in all three treatments. The three
treatments were run in all six possible orders. We do not observe order effects, so we
pool the data across sessions. Contribution data are shown in Figure 4. Stakeholder
contributions (the dashed lines) are close to the endowment, which is expected because
the Stakeholder’s return from the public good is greater than his return from the private
good.3 Non-Stakeholder contributions (the solid lines) for each treatment are lower but
significantly positive in all rounds. These contributions show the downward trend
usually seen in public goods games. Bachelor contributions in the Ineligible treatment do
not show this trend, but they are well below contributions in the other treatments.
Figure 4. Contributions by Treatment and Role across Rounds (in Percent of Endowment)
Non-Stakeholder contributions in the Private treatment are comparable to
contributions in other linear public goods games in the literature with similar (symmetric)
―prices of giving.‖ This was not a foregone conclusion, because the presence of a
Stakeholder changes the non-Stakeholders’ incentives as compared to the incentives in a
symmetric public goods game. The Private treatment non-Stakeholder contributions start
at 41% in round 1 and end at 21% in round 10, averaging 33% across all rounds. In the
final round, 47% of non-Stakeholders make positive contributions. In Castillo and Petrie
(2010), contributions decline from 41.6% to 23.6%, averaging 32.8%; Andreoni (1988)
saw an overall average of 33.2%; Croson (1996) saw an overall average of 35.7%;
relevant surveyed results in Cox and Sadiraj (2007) show positive contributions in the
final period from 27-44% of subjects. Results from asymmetric-return public goods 0%
10% 20% 30% 40% 50% 60% 70% 80% 90% 100%
1 2 3 4 5 6 7 8 9 10
games are hard to compare because of differences in the payoff structure, but subjects
with lower marginal per capita returns in somewhat similar treatments gave 20% on
average in Goeree, Holt, and Laury (2002) and 18% in Glöckner et al. (2009). Our game
has some similarities to sequential-play public goods games, and although contributions
are hard to compare because of differences in game structure, a similar sequential game
(Güth et al. 2007) finds average contributions of 47.68% of endowment.
Treatment Effects4
The difference between the Private and Public treatments is that the Public
treatment opens the door to targeted direct reciprocity, indirect reciprocity, and strategic
self-interest. Thus, we can answer our first research question (whether these forces can
increase the provision of a public good) simply by determining whether non-Stakeholder
contributions are higher in the Public treatment than they are in the Private treatment.
Figure 4 shows that average non-Stakeholder contributions in the Public treatment
exceed those in the Private treatment in all rounds. These differences are only statistically
significant in a few rounds, but are significant when pooled across rounds. Table 1
shows average Stakeholder and non-Stakeholder contributions for each treatment.
Table 1. Average Contributions by Treatment and Role (Percent of Endowment) Non-Stakeholder Stakeholder
Private Treatment 33.02
(25.98) N=120
96.98 (10.30) N=120
Public Treatment 37.75
(25.93) N=120
95.63 (10.36) N=120 Ineligible Treatment, Non-Bachelors 35.96
(22.26) N=96
94.95 (11.74)
N=96 Ineligible Treatment, Bachelors 23.39
(28.41) N=24
N/A
Standard deviations in parentheses
As shown in Table 1, the average non-Stakeholder contribution is 14.4% larger in
the Public (37.75% of endowment) than in the Private treatment (33.02 %). This
difference is statistically significant (Wilcoxon signed-rank test p=0.051). Thus, these
social forces increase cooperation by a modest but economically significant amount.
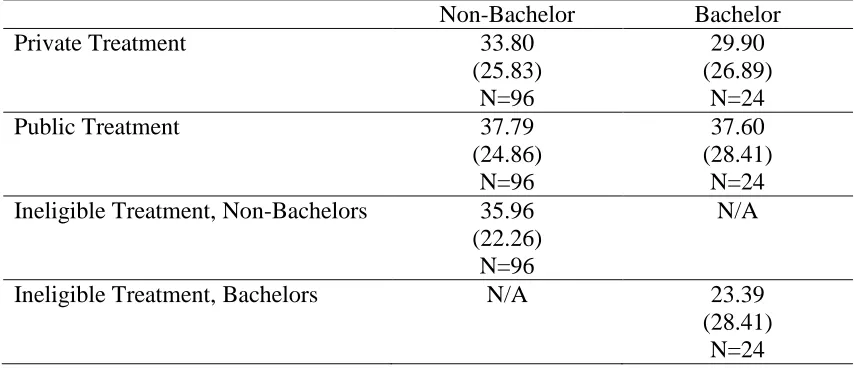
Table 2. Average Contributions by Treatment and Bachelor Status (Percent of Endowment)
Non-Bachelor Bachelor
Private Treatment 33.80
(25.83) N=96
29.90 (26.89)
N=24
Public Treatment 37.79
(24.86) N=96
37.60 (28.41)
N=24 Ineligible Treatment, Non-Bachelors 35.96
(22.26) N=96
N/A
Ineligible Treatment, Bachelors N/A 23.39 (28.41)
[image:33.612.110.537.505.689.2]As shown in Table 2, Bachelors in the Ineligible treatment contribute significantly
less (23.39% of endowment) than they did in the Private (29.90%) or Public (37.60%)
treatments (Wilcoxon signed-rank test p=0.043 and p=0.020, respectively). We cannot
precisely identify the reason that Bachelors give less than they gave as Non-Stakeholders
in the Private treatment. However, we conjecture that Bachelors feel a weakened urge to
conform to the norm of contribution since they cannot be Stakeholder, or that their
reduced earnings potential causes Bachelors to be less willing to trade off their payoff to
benefit others (because of an income effect or spite). There is no difference between
non-Stakeholders’ behavior in the Ineligible treatment (35.96% of endowment) and their
behavior in the Private (33.80%) and Public (37.79%) treatments (Wilcoxon signed-rank
test p=0.233 and p=0.410, respectively). Thus, though the game has changed from the
perspective of non-Bachelors (shrinking the ―circle of reciprocity‖ to four people, and
adding a public good beneficiary who is outside that circle), the effect of these changes is
indeterminate and small.
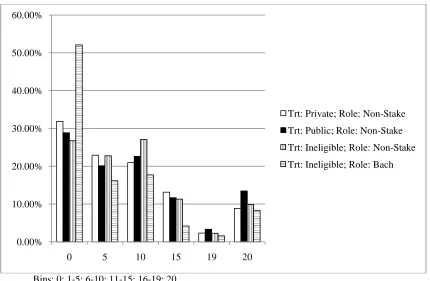
Figure 5 shows the distribution of non-Stakeholder contributions, pooled across
all rounds of all sessions. All treatments show a peak at zero tokens, a possible peak at
6-10 tokens, a dip between 6-10 and 20, and a peak at 20 tokens (full endowment). While
qualitative differences appear between the treatments, many of these are not statistically
significant. However, Bachelors give zero tokens more often in the Ineligible than in the
Private (Wilcoxon signed-rank test p=0.007) and the Public (p=0.014) treatments. Also,
in the Public treatment, subjects give 20 tokens more often than in the Private (p=0.021)
Bins: 0; 1-5; 6-10; 11-15; 16-19; 20.
Figure 5. Distribution of Non-Stakeholder Contribution Amounts, Pooled across Rounds
Direct Reciprocity and Other-Regarding Preferences
We wish to detect reciprocity, i.e. responsiveness to the current Stakeholder’s past
behavior. To do this, we use nonparametric within-subject tests of aggregate statistics.
For each person, we want to see whether (as non-Stakeholder) he gave more to the public
good in rounds in which the current Stakeholder was previously generous to him, as
compared to rounds in which the current Stakeholder was previously ungenerous.
Stakeholder past generosity is determined by the current Stakeholder’s average
contribution to the public good in rounds wherein this subject was the Stakeholder. For
example, Joe is Stakeholder in rounds 1 and 6, and Frank is Stakeholder in rounds 2 and
7. In round 2, Joe will remember how generous Frank was in round 1: ―Stakeholder past
generosity‖ will be Frank’s contribution in round 1. In round 7, when Frank is 0.00%
10.00% 20.00% 30.00% 40.00% 50.00% 60.00%
0 5 10 15 19 20
Stakeholder, our measure of ―Stakeholder past generosity‖ for Joe would be the average
of Frank’s contributions in rounds 1 and 6 (when Joe was Stakeholder).
We define a ―generosity threshold‖ such that contributions greater than this
amount are considered generous. For each subject, we calculate his average contribution
when facing a Stakeholder whose ―past generosity‖ measure meets this threshold, and his
average contribution when facing a Stakeholder whose past generosity does not. We
tried many thresholds, including the ―endogenous threshold‖ of the group’s cumulative
average contribution, and results were robust. We report results from a threshold of 10
tokens (50% of endowment). To see how this works, imagine that a group contains only
Joe, Frank, and Mary. Frank gave 15 tokens every time Joe was Stakeholder, and Mary
always gave 2 tokens. Joe’s average contribution to a generous Stakeholder is his
average contribution when Frank was Stakeholder, and his average contribution to an
ungenerous Stakeholder is his average contribution when Mary was Stakeholder.
A subject displays reciprocal behavior if he gives more when facing a
previously-generous Stakeholder than when facing a previously-unpreviously-generous Stakeholder. Table 3
presents averages of these measures. In the Private treatment, the two statistics are not
significantly different. This is expected (and reassuring) since in that treatment subjects
can’t tell who is Stakeholder or what the current Stakeholder did in the past. In both the
Public and Ineligible treatments, subjects give significantly more—over 50% more—to
previously-generous Stakeholders than they give to previously-ungenerous Stakeholders.5
We use a difference-in-difference test to compare responsiveness (the difference between
5
Recall that subjects could respond to past actions of the current Stakeholder and the current non-Stakeholders, although their contributions benefit the former three times as much as the latter. If subjects were responding to non-Stakeholders in this way, this would attenuate our within-subject test of
the amount given to a generous Stakeholder and the amount given to an ungenerous
Stakeholder) between treatments. Responsiveness is greater in both the Public (14.83%
of endowment) and Ineligible (17.3% of endowment) treatments than in the Private
(-1.59% of endowment) treatment (Wilcoxon signed-rank test p=0.000 and p=0.000,
respectively). This is evidence of directly reciprocal behavior. Responsiveness does not
[image:37.612.117.542.308.436.2]differ between the Public and Ineligible treatments (p=0.966).
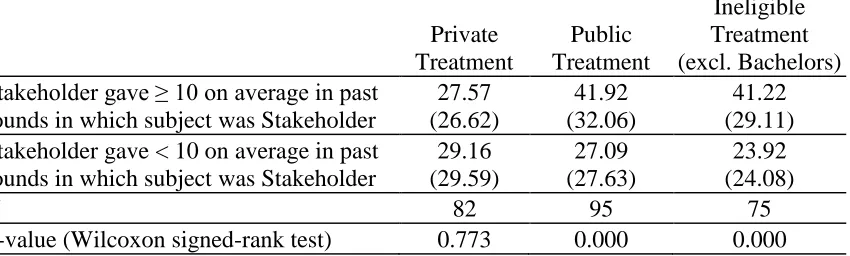
Table 3. Average Non-Stakeholder Contributions across All Rounds by Stakeholder's Past Generosity toward Subject (in Percent of Endowment)
Private Treatment Public Treatment Ineligible Treatment (excl. Bachelors) Stakeholder gave ≥ 10 on average in past
rounds in which subject was Stakeholder
27.57 (26.62) 41.92 (32.06) 41.22 (29.11) Stakeholder gave < 10 on average in past
rounds in which subject was Stakeholder
29.16 (29.59) 27.09 (27.63) 23.92 (24.08)
N 82 95 75
P-value (Wilcoxon signed-rank test) 0.773 0.000 0.000 Standard deviations in parentheses
N’s are less than 120 because some subjects did not face both a generous and an ungenerous stakeholder. For this reason, we dropped 38 of 120 subjects in Private, 25 of 120 in Public, and 21 of 96 subjects in Ineligible.
Do subjects discriminate because of other-regarding preferences or because they
are strategic? We can dispose of strategic concerns by looking for reciprocal giving after
a person has passed his last Stakeholder stint. For example, again assume that Joe was
Stakeholder in rounds 1 and 6, and Frank was Stakeholder in rounds 2 and 7, and assume
that no further fundraising rounds follow. If Frank was kind to Joe in rounds 1 and 6,
will Joe reciprocate in round 7? If he is purely strategic, Joe has very little to gain, so he
We test for reciprocal behavior rooted in other-regarding preferences by
constructing statistics of each subject’s average contribution to previously generous and
ungenerous Stakeholders in rounds after this subject’s last Stakeholder stint. These
results, shown in Table 4, imply that other-regarding preferences play a role. Subjects in
the Public treatment continue to discriminate between generous Stakeholders (to whom
they give 30% of endowment) and ungenerous Stakeholders (16.93%) even after they
have no strategic motive to do so. In the Ineligible treatment, the sample size is greatly
reduced because fewer subjects can be considered (only non-Bachelors) and the treatment
is shorter (eight rather than ten rounds). Because of this reduced power, discrimination in
the late rounds of the Ineligible treatment is not statistically significant, although the
point estimate is positive (26.60% is given to generous Stakeholders, and only 19.30% is
[image:38.612.104.542.474.602.2]given to ungenerous Stakeholders).
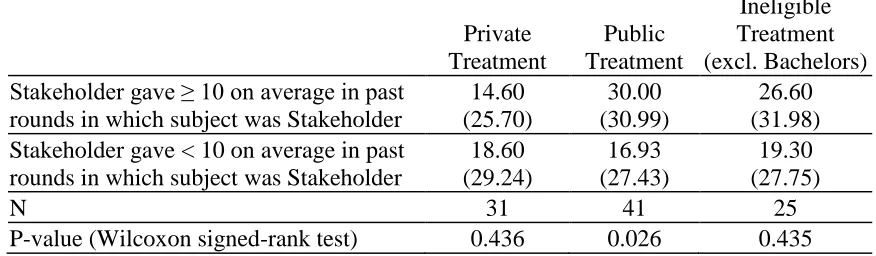
Table 4. Average Non-Stakeholder Contributions by Stakeholder’s Past Generosity toward Subject, after Last Stakeholder Stint (in Percent of Endowment)
Private Treatment Public Treatment Ineligible Treatment (excl. Bachelors) Stakeholder gave ≥ 10 on average in past
rounds in which subject was Stakeholder
14.60 (25.70) 30.00 (30.99) 26.60 (31.98) Stakeholder gave < 10 on average in past
rounds in which subject was Stakeholder
18.60 (29.24) 16.93 (27.43) 19.30 (27.75)
N 31 41 25
P-value (Wilcoxon signed-rank test) 0.436 0.026 0.435 Standard deviations in parentheses
Indirect Reciprocity
An indirect reciprocator is a disinterested party who rewards one subject for
generosity toward another subject. A strict definition of indirect reciprocity cannot be
tested by looking at the responsiveness of a subject who has the opportunity to be
Stakeholder, because he is not disinterested: he can benefit from a norm of cooperation.
Our clean test for indirect reciprocity is the behavior of Bachelors in the Ineligible
treatment. These randomly-selected subjects will never be Stakeholder, so they can never
receive the benefits of targeted reciprocity. Therefore, direct reciprocity and strategic
self-interest are not strong motives for Bachelors.
We have shown that Bachelors give significantly less than non-Stakeholders in
the Ineligible treatment and less than they themselves gave in the other treatments. The
people who are Bachelors show evidence of reciprocity in the Public treatment (i.e. they
have positive ―responsiveness,‖ as defined previously; results available on request), so
they do behave reciprocally when they are part of the circle of reciprocity. However,
Bachelors in the Ineligible treatment do not give more (Wilcoxon signed-rank p=0.823)
when facing previously generous Stakeholders (when they give 21.91% of endowment on
average) than when facing previously ungenerous Stakeholders (25.54% of endowment).
Therefore, indirect reciprocity does not seem to be a motivator in this setting.
This result is particularly intriguing, given that other studies have found indirect
reciprocity. However, the re-matching structure of those experiments allows subjects to
have an interest in the group’s overall cooperation. Therefore, subjects in those
settings in which to examine cooperation; however, we feel that our result hews more
closely to the ―bystander‖ interpretation of indirect reciprocity.
Heterogeneity in the Population
In estimating population effects, we may be missing important heterogeneity in
individual behavior. Our within-subjects implementation allows us to characterize each
subject within a treatment and see how subjects change their behavior between
treatments. We use an endogenous classification method to characterize subjects by their
baseline giving and their responsiveness to other subjects’ past behavior. This method
(based on the "estimation / classification" method of El-Gamal and Grether 1995)
specifies a finite mixture model that mixes several instances of the same model and then
uses maximum likelihood to simultaneously assign subjects to types and choose the
parameters (coefficients) for each type. This allows the data to generate the ―rules‖ that
best describe the data. A standard finite mixture model generates population percentages
for each of the nested models. To summarize the data, we assign each subject to the type
that best describes his contributions; that is, for each subject, we round to 1 the
probability of the type that best represents him, and round the rest down to 0.
We index types by m, and model contributions as a function of a history variable
hikt (subject k’s past contributions when person i was Stakeholder as of period t) and other
variables Xit. The model uses type-specific parameters, including a constant parameter
am which represents baseline tendency to give (altruism), and a ―responsiveness‖
parameter bm. The empirical model for each type is:
it m m ikt m it it
This analysis is similar to Bardsley and Moffatt (2007). However, their game is
different (as it is a sequential public goods game using a ―Conditional Information
Lottery‖ to determine payments). Also, while they specify four types (a free-rider type,
an altruist type, a reciprocator type, and a strategic type) and then estimate each type’s
parameters and mixing probabilities using maximum likelihood, we specify a number of
types but do not restrict parameters of any of the types (e.g., a=b=0 for an free-rider).
We performed this analysis with two, three, and four types. In the results we
report, Xit includes only the group cumulative average contribution (excluding the
subject’s own past contributions and the current Stakeholder’s past contributions).
Results were robust to the inclusion of round number and a dummy indicating whether
the subject had passed his last Stakeholder stint. Results were also robust to the inclusion
of subject demographics (gender and age), but as none were significant we do not report
those results.
For simplicity, Table 5 presents results from the two-type analysis. In each
treatment, Type 1 is large (comprising 61-73% of the population) and has a small a1 (low
altruism), whereas Type 2 has a large a2 (high altruism, a2 > a1). Thus, we will call Type
1 ―low type‖ and Type 2 ―high type.‖ The bm parameter (responsiveness) is large,
significant, and positive for both types in both the Public and Ineligible treatments.6
Within each treatment, the types show similar responsiveness (b1 ≈ b2, t-test p-value
greater than 0.13 in all cases). That is, while the types differ in altruism, all types tend to
reciprocate. This universal responsiveness holds as more types are added. Thus, the
most important heterogeneity is in the baseline tendency to give and not in the tendency
[image:42.612.110.542.205.514.2]to reciprocate.
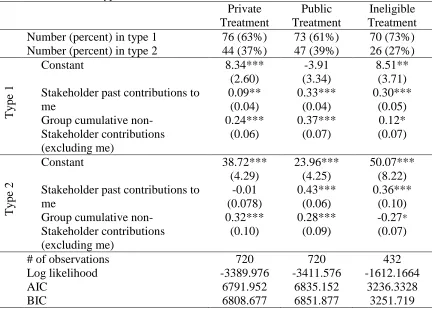
Table 5. Behavioral Types from Estimation / Classification Procedure Private Treatment Public Treatment Ineligible Treatment Number (percent) in type 1 76 (63%) 73 (61%) 70 (73%) Number (percent) in type 2 44 (37%) 47 (39%) 26 (27%)
Type
1
Constant 8.34***
(2.60)
-3.91 (3.34)
8.51** (3.71) Stakeholder past contributions to
me 0.09** (0.04) 0.33*** (0.04) 0.30*** (0.05) Group cumulative
non-Stakeholder contributions (excluding me) 0.24*** (0.06) 0.37*** (0.07) 0.12* (0.07) Type 2
Constant 38.72***
(4.29)
23.96*** (4.25)
50.07*** (8.22) Stakeholder past contributions to
me -0.01 (0.078) 0.43*** (0.06) 0.36*** (0.10) Group cumulative
non-Stakeholder contributions (excluding me) 0.32*** (0.10) 0.28*** (0.09) -0.27* (0.07)
# of observations 720 720 432
Log likelihood -3389.976 -3411.576 -1612.1664
AIC 6791.952 6835.152 3236.3328
BIC 6808.677 6851.877 3251.719
Standard errors in parentheses. Normal distribution for error; mean is linear function of covariates. * significant at 10%; ** significant at 5%; *** significant at 1%
For comparison, Bardsley and Moffatt (2007) find approximately 39% of subjects
to be strategists, 25% to be free-riders, 30% to be reciprocators, and 6% to be altruists. A
striking similarity between their results and ours is that neither they nor we find
How do subjects change across treatments? There is imperfect stability in types:
56% of subjects are the same type for all treatments, and most of these (42% of the
population) are consistently low type. Subjects who are high type in one treatment give
significantly more in the other treatments.7 Type transitions are shown in Table 5. The
low type is ―stickier‖ in a loose sense: for each treatment, subjects that are low type in
that treatment are very likely (78-85%) to be low type in the other treatments, while
[image:43.612.110.538.322.426.2]high-type subjects are less likely (32-56%) to become low high-type.
Table 6. Treatment-to-Treatment Type Transitions: Percent of Subjects Making Each Transition
Low to Low Low to High High to Low High to High From Private
To Public 49% 14% 12% 25%
From Private
To Ineligible 54% 9% 19% 18%
From Public
To Ineligible 50% 9% 23% 18%
Transitions to and from Ineligible treatment types use only 96 subjects, since Bachelors are excluded.
Conclusion
Favor trading is a natural element of social networks. Grassroots fundraising
harnesses people’s tendency to trade favors and uses that reciprocal drive to increase the
provision of public goods. Using an experimental design that allows different forms of
reciprocity to be turned on and off, we explore the power of favor trading and the
mechanisms through which this institution may work.
7 Results available on request. For example, Private-high type subjects give more in the Public treatment than do Private-low type subjects (55.61% of endowment as compared to 27.41%, Wilcoxon rank-sum test
We demonstrate reciprocal giving rooted in other-regarding preferences, i.e. direct
reciprocity. While some studies have robustly shown direct reciprocity in laboratory
institutions like the investment game, others have criticized the abstraction and isolation
of those institutions. The presence of direct reciprocity in our slightly richer setting may
be the next step in building a bridge toward non-laboratory institutions that encourage the
expression of direct reciprocity.
It is remarkable that in our strict, clean test, we do not find indirect reciprocity.
Our definition of indirect reciprocity may be too strict, in a sense. While most
experiments seeking indirect reciprocity allow actors to benefit from an increased
tendency to cooperate within the group, we strip our Bachelor of incentives to foster
cooperative norms. It is also notable that in our setting, Bachelors can never earn as
much as other subjects. It is possible that this inequity causes some feeling of
disaffection on the part of the Bachelors, and this suppresses the expression of their social
preferences. This accords with the low level of contributions by Bachelors, and also with
the remarkably flat profile of Bachelor contributions across the rounds of the treatment.
Whatever the explanation, our results imply that indirect reciprocity is sensitive to
institutional factors. The institutional factors essential to our test of indirect reciprocity—
the disinterestedness of the indirect reciprocator and the potential for inequity—are
factors that could certainly be present in many evolutionary settings, so the absence of
indirect reciprocity in our results is quite interesting.
In our experimental setting, favor trading increases cooperation by 14.4%, an
amount that is both statistically and economically significant. This should provide a
true social situation, rewards and sanctions are much stronger motivators than the
incentives offered in the lab, and social interactions can be an extremely long-term game.
These results support our intuition about the effectiveness of grassroots solicitation as a
fundraising tool, and suggest that favor trading could be successfully leveraged in other
settings as well. Our results also show the robustness of direct reciprocity, and the
Chapter II: The Effects of Conservation Reserve Program Participation on Later Land Use
Introduction
The United States Conservation Reserve Program (CRP) pays farmers to retire
land from agriculture. The program has several goals, including the preservation of
environmental assets and the long-term improvement of the country’s agricultural
productivity. Balancing multiple goals is always difficult, and may be especially
challenging with regard to the long-term effects of such a program. In the case of the
CRP, the disposition of land that leaves the program deserves study because the program
is extremely large and market and political factors can trigger policies that suddenly
release quantities of CRP land. For example, the 2008 Farm Bill dictated a drop in the
CRP’s enrollment cap from 39.2 million acres to 32 million acres. If land that leaves the
CRP persists in conservation, this long-term effect boosts the program’s environmental
benefits. If ex-CRP land returns to farming at a high rate, however, this works against
the program’s environmental goals, but may indicate that the CRP made the land more
productive.
We examine land use of parcels that have been in the CRP to determine whether
the CRP has an effect on the land’s later use. We ask whether CRP participation causes
land to be more or less likely to be farmed (or to take up another land use) and whether
past CRP participation is correlated with the use of conservation practices on farmed
land. We focus on land that exited the CRP between 1992 and 1997, the first period in
regression and matching methods. This approach makes an explicit comparison between
land that has been in the CRP (―treated‖ parcels) and land that has not been in the
program (―control‖ parcels), a comparison we must make to attribute causality to CRP
participation.
The CRP was established by the 1985 Food Security Act. A CRP contract binds a
landowner to abstain from farming the land for a period (10-15 years) and to plant a
conservation cover for that period. To join the program, farmers submit bids consisting
of the rental payment they will accept, the land they would like to enroll, and the
conservation cover they will plant. The ―best‖ bids (according to criteria that evolved
over time) are accepted. The USDA reimburses farmers for some of the cost of planting
conservation cover. If a farmer exits before his contract expires, he pays a penalty.
The program has been very popular. Enrollment has usually been near its acreage
cap (36.4 million to 39.2 million acres from 1992 to 2002), and competition has been
keen for CRP contracts. The first contracts expired in 1996. Very few parcels left the
program before that, and in 1996 (as in later years) most parcels with expiring contracts
re-enrolled. There is some variability in a parcel’s ability to exit or re-enroll in the
program. For example, around 1996, some holders of unexpired contracts were allowed
to remove their land from the program without penalty, and some expiring contracts were
automatically extended for one year if the contract-holder wanted to do so. The CRP’s
eligibility criteria and bidding system also changed over the years to improve
incentive-compatibility and to take into account an Environmental Benefits Index (EBI). As a
result, some early enrollment waves accepted land for contracts that, when expired, were
Post-CRP land disposition has been of interest for some time, but since CRP exits
did not occur in quantity until the first contracts expired in 1996, studies before 1996
were performed using surveys and simulations. Researchers (for example, Cooper and
Osborn 1998; Johnson, Misra, and Ervin 1997) surveyed farmers to gauge their intentions
to remain in the program and their plans for the land if the CRP were eliminated. These
surveys give useful qualitative results; for example, they indicate that not all CRP land
would be farmed if it were not in CRP and that market prices drive land use decisions.
General equilibrium simulators estimate parameters or elasticities from observed
land use and then use those estimates to predict the land use transitions that would occur
under different market and policy conditions. These simulations account for the effects
of CRP entry and exit on agricultural supply and therefore on price, which can feed back
into other parcels’ entry into and exit from agriculture.8
Using the POLYSYS simulator,
De La Torre Ugarte et al. (1995) estimate that 57% of CRP land would be farmed if the
CRP was terminated, and De La Torre Ugarte and Helliwinckel (2006) estimate that 37%
of CRP land would be farmed if the CRP were gradually eliminated. Secchi and Babcock
(2007) use the EPIC simulator to show that crop prices have a very strong influence on
the decision to un-retire CRP land. Lubowski, Plantinga, and Stavins (2008) find that the
CRP accounted for a reduction in cropland of 29 million acres between 1982-1997 (given
32.8 million acres estimated enrolled in 1997, this implies that at least 88% of CRP land
would have been farmed).
While general equilibrium simulation is essential for market-level analyses, it
may not be well-suited to the analysis of parcel-level transitions, as discussed in Roberts
and Lubowski (2007). General equilibrium simulators predict land use by assuming that
land will enter its highest return use. These models’ ability to predict in this context is
limited by the fact that returns (and land characteristics determining those returns) are not
fully observed. Therefore, micro-level analyses of land use changes are a useful
complement to general equilibrium simulations.
One such analysis is Roberts and Lubowski (2007), who also examine post-CRP
land use decisions. They use post-CRP land use in 1997 to parameterize a model of land
use for ex-CRP land, and perform a partial equilibrium simulation to predict that 58% of
CRP land would enter farming if the program were eliminated. Roberts and Lubowski
use a Heckman two-stage model to control for selective exit from the CRP. However, a
remaining concern is selection in CRP enrollment: land that enters the program must be
have low opportunity costs, i.e. low returns from farming. To assign causality to CRP
participation, this selection must be considered so that CRP parcels are compared to
parcels that are similar in quality—that is, to land that is also marginal and therefore
likely to leave farming anyway.
We compare ex-CRP parcels to parcels that have not been in the program to ask:
did CRP participation cause changes in the later land use of enrolled parcels (compared to
the use they would have entered had they not ever been in CRP)? In contrast, Roberts
and Lubowski ask: given a known function that determines post-CRP land use, what will
happen to currently-enrolled CRP land if the program disappears?
This paper contributes to the literature in a number of ways. We attribute