Georgia State University
ScholarWorks @ Georgia State University
Economics Dissertations Department of Economics
Summer 8-1-2015
Essays on Information Asymmetry and Welfare
Benefit
Hizkia Tasik
Follow this and additional works at:https://scholarworks.gsu.edu/econ_diss
This Dissertation is brought to you for free and open access by the Department of Economics at ScholarWorks @ Georgia State University. It has been accepted for inclusion in Economics Dissertations by an authorized administrator of ScholarWorks @ Georgia State University. For more information, please contactscholarworks@gsu.edu.
Recommended Citation
ABSTRACT
ESSAYS ON INFORMATION ASYMMETRY AND WELFARE BENEFIT
BY HIZKIA HENDRICK DAVID TASIK
JULY 2015
Committee Chair: Dr. Yongsheng Xu
Major Department: Economics
This dissertation explores the information asymmetry problem between government and
applicants of means-tested welfare benefits. The first chapter examines the problem in a static
setting. To meet benefit eligibility, individuals reduce their labor supply so that they meet the
required income level. This action enables them to increase their payoff but makes it difficult for
government to differentiate the needy from the non-needy. Using a signaling game model and
incorporating income-related ordeals (i.e. required-hour and essential component) as the signals,
this study finds that government can mitigate the problem, increase social welfare, and maintain
income-based eligibility requirements.
The second chapter investigates the effect of the asymmetry when benefit applicants have
choices of where and when to apply, and the solution to the asymmetry problem. Jurisdiction
differential in net benefit may induce a migration from a low to a high net-benefit jurisdiction.
Likewise, individuals may choose to procrastinate on the application process if they find that
applying later gives higher net-benefit than applying now. Consequently, these behaviors create
information asymmetry. Using a signaling game model, the result shows that, after accounting
for required-hour and essential component, the individuals have no incentive to migrate or
The third chapter evaluates the solution to the problem when maintaining a particular
take-up rate is also a government’s objective. Imposing an ordeal in the welfare system is
expected to help government direct the benefit to the needy but this may reduce the take-up rate.
Conditioning on any particular take-up rate that the government aims to achieve, the models
provide a solution on how to distinguish the types of applicants without harming the take-up rate.
Using 2013 U.S. state level data, the model predicts that adjusting the cutoff level of the ordeals
may change the take-up rates anywhere between 0.008 and 9.233 percent. This range represents
the total number of marginal individuals who are in the programs. This sheds some light on what
particular cutoff level of ordeals a government should impose so that it does not harm the
ESSAYS ON INFORMATION ASYMMETRY AND WELFARE BENEFIT
BY
HIZKIA HENDRICK DAVID TASIK
A Dissertation Submitted in Partial Fulfillment of the Requirements for the Degree
of
Doctor of Philosophy in the
Andrew Young School of Policy Studies of
Georgia State University
GEORGIA STATE UNIVERSITY
Copyright by
HIZKIA HENDRICK DAVID TASIK
ACCEPTANCE
This dissertation was prepared under the direction of the candidate’s Dissertation
Committee. It has been approved and accepted by all members of that committee, and it has been accepted in partial fulfillment of the requirements for the degree of Doctor of Philosophy in Economics in the Andrew Young School of Policy Studies of Georgia State University.
Dissertation Chair: Dr. Yongsheng Xu
Committee: Dr. Vivi Alatas
Dr. Carlianne Patrick Dr. Sally Wallace
Electronic Version Approved:
Mary Beth Walker,
Dean Andrew Young School of Policy Studies Georgia State University
iv
ACKNOWLEDGEMENTS
Great achievement is usually born of great sacrifice, and is never the result of selfishness Napoleon Hill My greatest achievement so far is that I've been able to continue with my normal life. I love what I do, but more so, I'm glad to have people who care about me close by. Kim Smith
No piece of work can be successfully completed without other people’s hands. I have received many hands of love, hands of encouragement, hands of support, hands of patience and hands of sacrifice from my wife, child, parents, colleagues, staffs and dissertation committee members. I owe all a debt of gratitude and know that this would not have happened without them.
During the program, I have had wonderful support from my fellow classmates: Vlad, Guan, Xiaoxi, and Yanling. I, personally, would like to thank Bess Blyler for giving me enormous efforts to keep me on track and for working hard to assist me whenever I need. I, personally would also like to thank Matt Arp who had done his best to make me stay in and
complete the program. I remembered one day he was trying to find me in the 7th floor just to
provide me an urgent assistance when I had an emergency situation. I saw an extraordinary capacity in him. I would like to thank Kurt Schnier and Bruce Seaman who had also given me support and assistance to stay in the program. I would like to thank Sally Wallace not only for her support and invaluable thoughts as a committee member but also for giving me support to apply for the Ph.D. program. I would like to thank other committee members, Carlianne Patrick and Vivi Alatas who had provided me invaluable thoughts and support. I would like to give a big box of thanks to my committee chair, Yongsheng Xu, for his perseverance, patience and passion as well as for being the best mentor of mine. He always made his time available to listen to all my stories and to give me advice.
My mom and dad have not only been wonderful parents, but also wonderful examples. Without their prayers, love, encouragement and advice, my life would never been better. Auvi, my 3-year old son, has always been my source of joy. Although many times I made him mad, sad and cry, but his kiss every morning always made my day, his ‘I love you, daddy’ made me strong, and his effort to make my bed every night just made me happy. Remembering ‘daddy, I share with you my ice cream’ made my happiness complete. Although I found it melted, he was happy that he could save some of the ice cream, hold it tight and bring it home from a mall.
My wife, Lia, is the best person I have ever known. She is always there to make sure I get everything I need to complete the program and to make my life better. Her patience,
encouragement, passion, support and love are unbeatable. Many times she was in pain, but she always tried to make me happy. Even when she was in emergency room and almost lost her life, she always tried to cheer me up, showed her love and gave me support to finish my dissertation. She was the first person who gave me support to be here and dare to face all the problems that I would encounter. I thank and love her so much.
v
TABLE OF CONTENTS
LIST OF TABLES ... viii
LIST OF FIGURES ... ix
CHAPTER 1 DOUBLE-SIGNAL ANALYSES TO MITIGATE INFORMATION ASYMMETRY WITHIN WELFARE BENEFIT PROGRAMS ... 1
I. INTRODUCTION ... 1
II. LITERATURE REVIEW ... 3
III. THE SIGNALS ... 5
IV. THE MODEL ... 9
V. THE CASES ... 12
a. First-Best Case ... 13
b. Information Asymmetry Case ... 15
c. Second-best case (single-signal) ... 17
d. Second-best case (double signals) ... 19
VI. COMPARISON ACROSS TYPES AND CASES ... 20
VII. DISCUSSION ... 26
VIII. CONCLUDING REMARKS ... 28
APPENDIX ... 31
vi
b. Summary of Magnitude Coefficients of Benefit (MCB) ... 32
c. The Relationship between 𝑥′ and 𝑥 ... 37
d. Assumptions for Variables and Changes of the Variables ... 38
e. Magnitude Coefficient of Benefit (MCB) Comparison of Types ... 40
f. Cases Comparison ... 44
CHAPTER 2 INTER-JURISDICTIONAL AND DYNAMIC INFORMATION ASYMMETRY WITHIN WELFARE BENEFIT PROGRAMS ... 48
I. INTRODUCTION ... 48
II. LITERATURE REVIEW ... 51
III. THE MODELS ... 55
a. Inter-Jurisdictional Model ... 55
b. Procrastination Problem ... 62
IV. CONCLUDING REMARKS ... 73
CHAPTER 3 CONDITIONAL DOUBLE-SIGNAL APPROACH AS AN EFFICIENT APPROACH TO WELFARE BENEFIT TARGETING ... 76
I. INTRODUCTION ... 76
II. LITERATURE REVIEW ... 79
III. THE MODELS ... 81
IV. NUMERICAL EXAMPLE: A SIMULATION ... 84
vii
APPENDIX ... 96
a. Table 3.A1. Various Possible Cutoffs of Required-Hour and Electricity Usage across States ... 96
b. Table 3.A2. Predicted Take-Up across States in the U.S: Adjusting the Cutoff Level of Electricity Usage... 99
c. Table 3.A3. Predicted Take-Up across States in the U.S: Adjusting the Cutoff Level of Required-Hour ... 103
d. Table 3.A4. Housing Weight ... 105
REFERENCES ... 106
viii
LIST OF TABLES
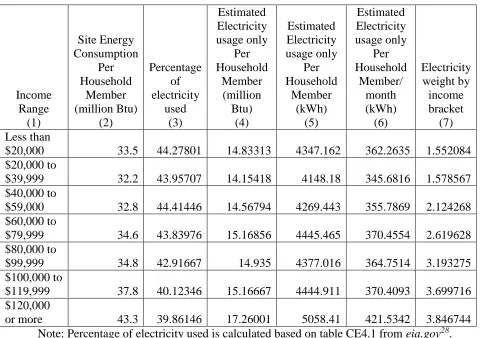
Table 3.1. Estimated Electricity Usage and Weight by Income Range... 86
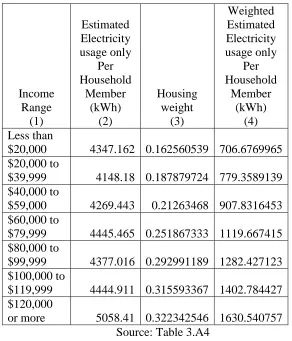
Table 3.2. Weighted Estimated Electricity Usage by Income Range... 87
Table 3.3. Changes in Take-Up Rates as Electricity Usage is Adjusted... 89
Table 3.4. Changes in Take-Up Rates as Required-Hour is Adjusted... 91
Table 3.5. Montana Take-up Rate Simulation... 93
Table 3.A1. Various Possible Cutoffs of Required-Hour and Electricity Usage across States.... 96
Table 3.A2. Predicted Take-Up across States in the U.S: Adjusting the Cutoff Level of Electricity Usage... 99
Table 3.A3. Predicted Take-Up across States in the U.S: Adjusting the Cutoff Level of Required-Hour...103
ix
LIST OF FIGURES
1
CHAPTER 1 DOUBLE-SIGNAL ANALYSES TO MITIGATE INFORMATION
ASYMMETRY WITHIN WELFARE BENEFIT PROGRAMS
I. INTRODUCTION
There have been many programs provided by government to improve one’s well-being.
Feldstein (2005) divides the types of programs into two, namely, social insurance programs
which are event-conditioned and welfare programs which are means-tested.
In the U.S. means-tested programs, proof of income or assets is the main criterion of
welfare benefit eligibility. However there are, at least, two problems may occur. Firstly, not all
applicants may be able to provide the proof due to various reasons (e.g. out of job, misplacing,
etc.) and this will lead to low benefit take-up ratio. Secondly, those who can provide the proof
may have incentives to engage in a behavior that enables them to provide the lowest possible
paychecks1. According to Gruber (2009, pp. 500-503), welfare benefit may give incentive to
individuals whose income levels are slightly above the eligibility threshold of income (hereafter,
marginal individuals) and to those whose income levels are below the threshold to reduce their
labor supply when they find the benefit increase their utility without having to maintain the same
labor supply.
Both problems contribute to information asymmetry between government and the
applicants in which the government is unable to completely observe the level of income and to
identify which applicants are truly eligible for the benefit; while at the same time this asymmetry
gives incentives to ineligible applicants to game the system (e.g. by not saving, not working or
1 For example, they collude with their employers to have paychecks in which the income written on the paychecks is
2
reducing their working hours) in order to be eligible (Besley & Coate, 1992; Feldstein, 2005) J.
Currie and Gahvari (2008) agree that the ineligible applicants take steps to reduce their incomes
to make themselves eligible for the benefit. For simplicity, this paper calls the truly eligible
applicants as true poor and those who game the system as fake poor. The purpose of this study is
to investigate the performance of an ordeal mechanism with double signals (i.e. required-hour
and electricity usage) in mitigating the information asymmetry within means-tested welfare
programs. Particularly, this study investigates how the double-signal approach helps government
address the information asymmetry issue by revealing the true poor so that it can improve social
welfare; shows how using the double-signal approach is better in improving the social welfare
than using a single-signal approach (i.e. either time or essential component); addresses how the
existing applicants behave in the presence of information asymmetry compared to that in the
absence of it; shows how big the optimal size of ordeals (i.e. the cutoff level) is government can
potentially impose, and shows what changes may occur in the social welfare after introducing the
double-signal approach. Using the approach, the study finds that government can mitigate the
asymmetry problem, increase the social welfare, and maintain the fact that all eligibility
requirements are income-related.
This study contributes to the literatures in four respects. Firstly, this study takes initial
steps towards modeling the information asymmetry within the welfare programs using signaling
game model and introduces double-signal approach which utilizes time and essential components
to construct a cutoff. Secondly, this study also takes initial steps towards modeling the welfare
eligibility using essential component, i.e. electricity usage, as a proxy to income. Thirdly, this
3
Fourthly, this study may give guidance to government on the size of the ordeals that should be
imposed given the observed signals.
The rest of the paper is organized as follows. Section II presents the literature review.
Section III elaborates the signals that are used in this study. Section IV describes the model.
Section V analyzes four different cases (first-best, information asymmetry, single-signal and
double-signal cases). Section VI presents the comparison analyses. Section VII presents a brief
discussion. Section VIII provides the concluding remarks.
II. LITERATURE REVIEW
Many have paid attention on the information asymmetry within government welfare
programs. According to Gruber (2009), targeting and ordeal mechanism are two approaches that
could be used to mitigate the information asymmetry, in particular, to reduce the moral hazards
in welfare programs. While targeting was to direct the benefit to the needy ones, the ordeal
mechanism was to help the targeting. Nichols and Zeckhauser (1982) emphasized that welfare
programs would perform better if the programs incorporated restrictions, such as means-tested
in-kind transfers, commodity-specific taxes and subsidies, and even ordeals, than if they relied
only on cash transfers. In line with that, Blumkin, Margalioth, and Sadka (2014) emphasized that
two devices that government could use to overcome the information asymmetry problem were
direct screening devices (e.g. means-testing by reviewing documentation, conducting interviews,
and testing by specialists) and indirect screening (e.g. targeting groups, targeting benefits, and
welfare ordeals that added requirements to the program that undeserving individuals would find
4
Two distinct arguments about welfare ordeals and their approaches were obvious in the
literatures. On one hand, based on a field experiment in Indonesia, Alatas et al. (2013) found that
ordeal mechanisms (through imposing time and distance as the ordeals) could induce
self-selection, but marginally increasing the ordeal could impose additional costs on applicants
without necessarily improving targeting. As a part of their experiment, a welfare benefit survey
was publicly conducted, for example, by inquiring about one’s assets. On the other hand, Besley
and Coate (1992, 1995) showed that by introducing a work requirement as the ordeal (i.e. work
in public sector in order to qualify), government could target the benefits to the neediest ones.
Work requirement might help direct poor support toward the true poor in a way that only the true
poor presented themselves (Besley & Coate, 1992). As to improve Besley and Coate’s study,
Gahvari and Mattos (2007) and J. Currie and Gahvari (2008) introduced cash transfer combined
with in-kind transfer in the ordeal mechanism. Gahvari and Mattos (2007) argued that welfare
could be attained when it required the quality level of publicly provided good to be less than
efficient for the poor, particularly, in addition to Besley and Coate’s provision, transfer was
necessary so that with provision and transfer, deadweight loss could be avoided. Moreover, J.
Currie and Gahvari (2008) argued that when in-kind transfers, instead of cash transfers, were
used as redistributive tools, these transfers might serve as a separation device between the rich
and the poor. Despite the approaches mentioned above, there were drawbacks that raise
concerns. Firstly, a welfare benefit survey that was publicly conducted might not capture the true
information about individuals since individuals had incentives not to report the truth. Secondly,
there might be an alteration in labor supply: the introduction of a work requirement as the ordeal
might give incentive to fake poor applicants to be in the program if the work load in public sector
5
less productive job but total income received remained unchanged. Moreover, the new job might
not have productive value (Piketty & Saez, 2012). This job shifting would result in reduction in
labor supply of private sector, so called crowding-out. Additionally, as Kwon and Meyer (2011)
pointed out, welfare participation would be very low when welfare programs had a strong
emphasis on work requirement, particularly during economic downturns. Thirdly, in some cases,
however, the behavior of the poor in response to receiving in-kind transfer would be similar to
the one in response to receiving cash transfers. The transfer enabled the recipients to increase
their consumption on other goods, assuming that they would have had enough income to cover
the goods that would otherwise be covered by the transfers. The main concern here was not on
what individuals received but how they received. Fourthly, treating ordeals as screening devices
as discussed in the literatures above would create a tendency that a fake poor to engage in a
behavior to meet the ordeals’ cutoffs or a true poor to behave differently (e.g. became
discouraged). Fifthly, using ordeals that were not correlated to or did not represent income (e.g.
work requirement) might reduce the essence of welfare programs as means-tested programs since
income was no longer the crucial component of eligibility.
III. THE SIGNALS
To mitigate the information asymmetry while, at the same time, overcome the drawbacks,
this study introduces a different ordeal mechanism. Firstly, the ordeals are treated as signaling
devices. Therefore, this study uses signaling game model to help solve the information
asymmetry. Secondly, there are two signals (so called double signals) used in this mechanism.
They are time (i.e. total hours required to complete the application process) and essential
6
of welfare programs as means-tested programs. Practically, a government does not need to
announce the cutoffs of the signals and this approach does not require a public survey to
determine one’s income/assets status since the ordeals used are the ones that have correlation
with income. The approach does not result in a labor supply alteration as a consequence of
imposition of the ordeals and reduces the likelihood that individuals engage in a behavior to meet
the ordeals’ cutoff since, unlike screening model, signaling model does not require government
to announce the cutoff before the individuals decide to apply.
Indeed, one issue with multiple signals is that it may be hard to show that a separating set
exists since the informed party (i.e. the applicants) is not completely ordered by their cost of
increasing the signals. However, when quasiconvexity condition holds, a separating set exists
(Engers, 1987). Two signals, time and essential component, used in this paper are both proxies to
the unobservable variable (i.e. income) to some extent and both have monotonicity property with
regard to income. Engers (1987) points out that any monotonic function of a single variable is
quasiconvex and therefore, the separating set exists.
These signals have their own characteristics which enforce the advantages of having two
signals instead of one. Firstly, while essential component captures the “true” income, time has
twofold advantage, namely, it reflects one’s opportunity cost, e.g. market wage rate (Gruber,
2009) and it indirectly confirms the income status that may potentially be inferred by essential
component. It is assumed that the observable characteristics of both types other than those
affecting the value of time are similar. Secondly, the essential component is characterized by a
good or a service that an individual must inevitably have or cannot avoid consuming in a
particular geographic area or shelter. This is to ensure that all individuals have access not only to
7
provide the essential component (e.g. utility bills) and the probability of making excuse that they
do not have such bills are, if any, small. This component may also be characterized by an
argument that the more the consumption the richer the individual is and that the consumption
may reflects the individual’s total income. Thirdly, it may be painful for the individuals to
maintain low electricity usage for a particular period (required by the government) if their
normal usage is above the eligibility threshold, therefore the possibility that individuals lower the
usage in order to be eligible may also be minimized. Fourthly, both are, in different respects,
correlated to income. Time is correlated to income through a value one places on time (e.g.
market wage rate). Particularly, those who have high income tend to spend less time in
less-valued activities than those who have low income. On the other hand, essential component is
directly correlated to income. Fifthly, either signal works as a backup. Particularly, if there is a
problem with one of the signals; the other signal may still be able to help reveal the individual’s
income status. For example, there may be a possibility that high income individuals (HII) spend
much as time as the low income individuals (LII) since HII are on vacation/leave when they
apply. Therefore, HHI’s opportunity costs at that time do not reflect the real opportunity cost.
Given the characteristic above, the essential component may help government make some
evaluations. Additionally, it is worth noting that given the second and the third characteristics
above, such problem is unlikely to occur with regard to essential component. One may ask, why
not using essential component as the only signal? The answer is that it is hard to make an
inference about one’s labor income which may be better explained by one’s opportunity cost. In
addition, another benefit of having two signals is that the weight of ordeal may be well
distributed across signal. For example, instead of extremely increasing the application time to
8
slightly change the time and the essential component. However, in this study, there is no
restriction imposed on the correlation between these signals. Since the literature on the topic is
vast, it is inevitable that I have to limit the scope of discussion. In particular, it will focus on the
information asymmetry that exists in means-tested welfare programs but only in general case.
Additionally, in order to provide the basic model, this study rules out the need of tax,
transportation availability, communication access, applicant’s non-welfare spending-generated
payoff and all variables other than those accounted in the model. The essential component in this
study is electricity usage. That said, this study is only applicable to states or countries where
electricity is used by nearly everyone.
The idea of using electricity usage as the essential component was based on the
consensus that electricity had direct relationship with income (Acton, Mitchell, & Mowill, 1976;
Alberini, Gans, & Velez-Lopez, 2011; Filippini & Pachauri, 2004; Francisco, Aranha, Zambaldi,
& Goldszmidt, 2007; Marcus, Ruszovan, & Nahigian, 2002).2 Specific to low-income
households, Davis, Hughes, and Louw (2008) showed that the relationship between electricity
and income was also observed in poor households in two small rural towns in South Africa. They
concluded that, in addition to the presence of electric cooking appliance, income was also a key
determinant of electricity usage.3 The same finding was also discussed in Louw, Conradie,
Howells, and Dekenah (2008) and Meier, Jamasb, and Orea (2012). In their extensive analysis
about the relationship of energy and poverty, Pachauri and Spreng (2004), argued that energy
2Other studies also find that energy usage, either electricity, gas or both, increases with income (Blázquez, Boogen,
& Filippini, 2013; Brutscher, 2011; Cebula, 2012; Dubin & McFadden, 1984; Espey & Espey, 2004; Halvorsen, 1975; Jamasb & Meier, 2010; Neeland, 2009; OECD, 2008). Additionally, Yohanis, Mondol, Wright, and Norton (2008) and Pombeiro, Silva, and Pina (2012) show how the profile is differentiated between night and daytime.
3 Those households falling within the lowest two quintiles of income where the threshold would be approximately
9
usage (such as electricity, LPG, kerosene, biomass, etc.) could serve as a useful measure of
poverty and was better than a conventional monetary measure, which equated poverty with
material deprivation and defined the poor in terms of income or levels of consumption of
adequate amounts of food, clothing, shelter (Pradhan & Ravallion, 1998), water, sanitation,
health care and education. Moreover, according to Khandker, Barnes, and Samad (2010), the
energy poverty line could be defined as the threshold point at which energy usage began to rise
with increases in household income. A study in UK households in deciles 1 and 2 conducted by
White, Roberts, and Preston (2010) set the threshold at the mean, i.e. 3,903 kWh, and found that
there were 642,041 households consumed electricity above the threshold. Another threshold
might be based on minimum energy requirement for the poor (Blocker, 1985) set by government
if the government aimed to help those whose energy usage was below the minimum. Barnes,
Khandker, and Samad (2010) and Foster, Tre, and Wodon (2000) were also supportive to the
idea that energy usage could be a measure of poverty.
IV. THE MODEL
Consider a signaling game of welfare benefit, represented as a 6-tuple ℊ =
{𝑇, (𝑟, 𝑒), 𝑏, 𝜌, 𝑈, 𝑊}, which consists of two players, a sender (S) which is drawn from a group of
welfare applicants with two types, and a receiver (R) which is a government; and specifies a
space of the sender’s type 𝑇 = {𝑡, 𝑡̅}, a space of sender’s signal 𝜁 = {𝑟, 𝑒} which are the
required-hour (i.e. time) 𝑟 and electricity usage as the essential component 𝑒, a space of
receiver’s action 𝑏, a prior probability 𝜌 that S is of type 𝑡 where 𝜌(𝑡) ∈ [0,1) and ∑ 𝜌(𝑡)𝑡 = 1,
a payoff function of senders 𝑈, and a payoff function of receiver 𝑊. S receives private
10
according to some probability distribution 𝜌 over 𝑇. That is the probability is given by 𝜌 if S is
of type 𝑡 (so called true poor), and 1 − 𝜌 if S is of type 𝑡̅ (so called fake poor); 𝜌 is common
knowledge. Since the types are ordered according to income level, it is normal to restrict that 𝑡 <
𝑡̅ which implies that the income of true poor is lower than that of fake poor. Note that, from now
on, any variable 𝑣 and 𝑣̅ are associated to 𝑡 and 𝑡̅ types of S respectively, that is 𝑣 = 𝑣(𝑡) and
𝑣̅ = 𝑣(𝑡̅). Having learnt his type, S sends signals (𝑟, 𝑒) to R chosen out of some finite set (ℛ, ℰ).
The set of signals available to S depends upon S’s type, that is, (ℛ(𝑡), ℰ(𝑡)) are the signals
available to type 𝑡. 𝑇(𝑟, 𝑒) is the set of types that have signals (𝑟, 𝑒). It is worth pointing out that
the game of welfare benefit starts only when the individuals choose to apply which then enables
them to send signals. That being said, this study assumes that the individuals apply. R observes
(𝑟, 𝑒) but not 𝑡 and then chooses an action 𝑏 ∈ 𝐵, a finite set of actions. The action depends on
the signals received, writing 𝐵(𝑟, 𝑒). The game ends with this action, and payoffs are made to the
two players. The players have von Neumann-Morgenstern payoff functions. The sender’s payoff
function is defined over type 𝑡, private goods consumption 𝑥′, signal (𝑟, 𝑒), leisure 𝑙 and action
𝑏, writing 𝑈(𝑡, 𝑥′, 𝑒, 𝑙, 𝑏(𝑟, 𝑒)), while the receiver’s payoff function is defined over type 𝑡,
non-welfare spending 𝐺, signal (𝑟, 𝑒), and action 𝑏, writing 𝑊(𝑡, 𝐺, 𝑏(𝑟, 𝑒)). These functions are
taken to be continuous in (𝑟, 𝑒) and 𝑏; and continuously differentiable. 𝑈𝐵(ℛ,ℰ) > 0, 𝑈r< 0 and
𝑈e < 0 are assumed, so that the sender prefers to send more signals to induce larger actions at
the cost of their overall payoff. That said, there exists 𝑡̂ ∈ 𝑇, 𝑟̂ ∈ 𝑟 and 𝑒̂ ∈ 𝑒 such that
𝑈(𝑡̂, 𝑟̂, 𝑒̂, 𝑏(𝑟̂, 𝑒̂)) < 𝑈(𝑡̂, 𝑟̅, 𝑒̅, 𝑏(𝑟̅, 𝑒̅)) where 𝑟̂ is the highest possible level of 𝑟 and 𝑒̂ is the
lowest possible level of 𝑒 that both levels might incur the highest possible cost of signaling. This
implies the signals’ boundary condition that makes sending high signals (higher than sufficient
11
each (ℛ, ℰ) and 𝑡, with 𝑊 maximized in 𝐵 by 𝐵∗((ℛ, ℰ), 𝑡). Moreover, 𝑊𝐵 is strictly decreasing
in 𝑡 for each (ℛ, ℰ) and 𝐵, which implies that 𝐵∗((ℛ, ℰ), 𝑡) is strictly decreasing in 𝑡. Intuitively,
the receiver will choose larger action if she can be convinced that 𝑡 is smaller.
The optimal levels of signals 𝑟∗ and 𝑒∗ give the cutoffs of the signals with 0 < 𝑟̅ < 𝑟∗ ≤
𝑟 and 0 < 𝑒 ≤ 𝑒∗ < 𝑒̅. Let 𝑚 be the per-hour opportunity cost such that 0 < 𝑚 < 𝑚̅ where 𝑚 =
𝑚(𝑡) and 𝑚̅ = 𝑚(𝑡̅) and let 𝑟𝑚 be the total opportunity cost such that 𝑚𝑟 < 𝑚̅𝑟. I want to make
a similar assumption as in a conventional model of signaling games, that is, equilibrium requires
that higher types are more willing to send higher signal to induce higher action. Particularly, the
marginal rate of substitution (MRS) of signal for action is decreasing in type. In this study, the
same monotonicity property is also required in different dimension. Note that, due to cost
associated to the signals and to the types, higher (lower) type has higher (lower) cost of sending
signal 𝑟̅ but lower (higher) cost of sending signal 𝑒̅. That said, higher type has higher electricity
usage but lower required-hour, writing 𝑒̅ > 𝑒 and 𝑟̅ < 𝑟 for all 𝑡̅ > 𝑡. Although the direction of
change of the signals is different between 𝑟 and 𝑒 over 𝑡, the change of both signals is monotone.
To avoid confusion that may arise from different direction of change of both signals, the
direction is made equivalent since the concern here is not on the direction of change but on how
much the change is. In this case, increasing 𝑟 means that the sender increases the required-hour,
while increasing 𝑒 means that the sender decreases the electricity usage. So to make it
equivalent, increasing 𝑒 means that the sender hypothetically buys one ticket for every one unit
reduction in electricity usage.
Assumption 1. The signals are strictly monotone and continuous in type. That is, signal 𝑒
is strictly increasing while signal 𝑟 is strictly decreasing in 𝑡 and the cost of increasing signals is
12
This assumption defines the costs associated to the signals. The cost of sending signal of
a higher type is bigger than that of the lower type. Higher type has more electricity usage but less
time available for the application process than lower type. When the optimal levels of signals 𝑟∗
and 𝑒∗, such that 0 < 𝑟̅ < 𝑟∗ ≤ 𝑟 and 0 < 𝑒 ≤ 𝑒∗ < 𝑒̅, are required, moving monotonically and
continuously toward the optimal levels is less painful for the lower type than the higher type
which makes the cost imposed to the higher type bigger than that to the lower type. That said, as
long as the change is monotone and continuous, it is still possible to show that MRS is increasing
in type (i.e. 𝑀𝑅𝑆𝑟,𝑒 > 𝑀𝑅𝑆𝑟,𝑒) which ensures that the indifference curves through a particular
point have larger slopes for larger types. This implies a single-crossing property of indifference
curves. Consequently, the different slopes make it possible for lower type to separate from the
higher type.
V. THE CASES
This section presents four different cases (first-best, information asymmetry,
single-signal and double-single-signal cases) to give a big picture about the effects of information asymmetry
and the use of signal(s) on players’ payoff functions. In all cases, the applicant is assumed to
have a Cobb-Douglas preference while the government has utilitarian payoff function. For clarity
purposes, in both first-best and information asymmetry cases, there are only an applicant and a
government but there is no sender and receiver which, in turn, means that there is no signal being
sent. Of all variables in the applicant’s payoff function, benefit is the only variable that
government can control in order to improve social welfare which is of interest of this study.
Since this study assumes ceteris paribus, this study evaluates the changes in applicant’s payoff as
13
marginal contribution of benefit, MCB). Evaluating the changes in MCBs is important since all
players (or so-called agents in the first-best and the information asymmetry cases) are assumed to
be payoff maximizers so that they will respond (i.e. by applying for the benefit or not) to any
changes in MCBs. One thing worth pointing out is that this study assumes that everyone applies
for the benefit in order to make the MCB derivation possible. Once MCB is found, a government
may adjust the components of MCB in order to discourage the fake poor (i.e. make the fake poor
opt-out from application) so that the type separation may be possible. Additionally, since
government has utilitarian payoff function, changes in MCB can reflect the changes in social
welfare. Therefore, this study focuses on an applicant’s MCB in order to capture the effect of
changes in government policy. To focus on each case, this section does not make any
comparison of the cases. The comparison is presented in the next section.
a. First-Best Case
In the first-best case, the model has two agents: applicant and government. There is no
sender and receiver since it is assumed that government has full information about the applicant.
Therefore, sending signal is not necessary. The applicant consists of two types: true poor and
fake poor. In the real world, the applicants of welfare benefits are likely to be differentiated
based on level of income 𝑦. In particular, the true poor has income level 𝑦 while the fake poor
(i.e. richer applicant) has income level 𝑦 > 𝑦. When government has full information, it only
gives benefit to the true poor (i.e. type 𝑡) with income level 𝑦. So there is no fake poor in this
case. Therefore, all variables used are associated with true poor’s characteristics, so there are no
underbar variables. In this study, the MCB received by the true poor serve as the benchmark.
14
compared to that when information asymmetry presents and when the double signals (𝑟, 𝑒) take
place. Let time endowment 𝐻 be used up for labor ℎ and leisure 𝑙 i.e. 𝐻 = ℎ + 𝑙. At tax rate 𝜏,
government revenue is generated from labor income and non-labor income and used up for the
government expenditure on public goods 𝐺 at price 𝑝𝑔 and welfare benefit 𝑏(. ). The true poor
maximizes his payoff function 𝑈 = 𝑈(𝑥, 𝑙, 𝑏(𝑦)) subjects to the budget constraint (1 − 𝜏)𝜑 +
(1 − 𝜏)𝑚𝐻 + 𝑏(𝑦) = (1 − 𝜏)𝑚𝑙 + 𝑝𝑥𝑥, where 𝑥 is consumption of private goods that costs 𝑝𝑥,
𝑙 is time consumption of leisure priced at 𝑚, 𝑦 = (1 − 𝜏)𝜑 + (1 − 𝜏)𝑚𝐻 − (1 − 𝜏)𝑚𝑙 is total
income, 𝜑 is potential non-labor income, (1 − 𝜏)𝜑 is after-tax non-labor income and
(1 − 𝜏)𝑚𝐻 − (1 − 𝜏)𝑚𝑙 is after-tax labor income. The government maximizes the sum of
sender’s payoff subjects to 𝑛𝜏𝜑 + 𝑛𝜏𝑚ℎ = 𝑝𝑔𝐺 + 𝑛𝑏(𝑦), where 𝑛 is total proportion of
applicants which, in this case, consist of only true poor (see section b of appendix for details on
the problem setup). Let 𝛽1 be the marginal contribution of private goods consumption, the
resulting marginal contribution of benefit (MCB) is given by4
𝛽3∗= 𝑏(𝑦)𝛽1(1−𝜏) 𝜕𝑏
𝜕𝑦
⁄ (𝑃𝑔𝐺𝑛 −𝜑−𝑚ℎ). (1)
Note that for sake of simplicity, instead of writing 𝜕𝑏(𝑣)𝜕𝑣 , the partial derivative of benefit
with respect to any variable 𝑣 is written as 𝜕𝑏
𝜕𝑣 since 𝑏(𝑣) = 𝑏. Equation (1) shows that the MCB
is composed of characteristics of applicant and government. The characteristics that define the
applicant are total income 𝑦, potential non-labor income 𝜑 and labor income 𝑚ℎ. In this case,
government is assumed to have full information about applicant’s income. Having this
information enables government to calculate how much the contribution of the benefit to the
social welfare is and may help government evaluate whether or not such benefit is cost-effective
15
and cost-efficient in improving the social welfare. Additionally, since government has full
information about the applicant’s income, government only provides the benefit to the true poor.
b. Information Asymmetry Case
The outcomes from the first-best case are favorable. Unfortunately, they do not represent
the real world where the endowment of information is not symmetric among individuals. In this
case, the information is about individual’s “true” income. Practically, there is a portion of
income 𝛾 out of both labor and non-labor income that is not observable to government which
may be due to tax evasion behaviors, informal sector activities or others. Shortly speaking, this is
the case where a) income is the only indicator that government uses to distinguish the types of
applicant; b) the indicator is incompletely observable; and c) government has to keep taking
action 𝑏 (i.e. to keep running the welfare program and giving the benefits).
Like in the first-best case, the model in this case has two agents: applicant and
government. There is no sender and receiver since it is assumed that government does not have
full information about the applicant and does not make any effort to distinguish the types of
applicant yet. Therefore, sending signal is not necessary. Here, applicant maximizes the same
payoff function as in the first-best case. However, unlike in the first-best case, the applicant may
consist of either fake poor or true poor type. So, the true poor (fake poor) maximizes his payoff
function given his income level 𝑦(𝑦) subjects to his budget constraint. On the other hand, due to
information asymmetry, government maximizes her payoff function, with probability 𝜌 that the
applicant is a true poor and probability (1 − 𝜌) that the applicant is a fake poor, subjects to her
16
𝛽3∗= 𝑏(𝑦)𝛽1(1−𝜏)
𝜕𝑏 𝜕𝑦
⁄ [𝑃𝑔𝐺−𝜋(𝜑+𝑚ℎ)−𝜋(𝜏(𝑚ℎ−𝛾ℎ)+𝜏(𝜑− 𝛾𝜑)−𝑏(𝑦))]
and (2)
𝛽3∗= 𝑏(𝑦)𝛽1(1−𝜏)
𝜕𝑏 𝜕𝑦
⁄ [𝑃𝑔𝐺−𝜋(𝜑+𝑚ℎ)−𝜋(𝜏(𝑚ℎ−𝛾ℎ)+𝜏(𝜑−𝛾𝜑)−𝑏(𝑦))]
,
where 𝜋 and 𝜋 = 1 − 𝜋 are the proportions of the true and fake poor applicants; 𝛽1 and 𝛽1 are
the marginal contribution of private goods consumption of true poor and fake poor; 𝛾ℎ and 𝛾𝜑
are the portions of true poor’s labor and non-labor income that are not observable; and 𝛾ℎ and 𝛾𝜑
are the portions of fake poor’s labor and non-labor income that are not observable (see section b
of appendix for details on the problem setup). Equation (2) shows that the MCB is also
composed of characteristics of applicant and government. The characteristics that define the
applicant are total income 𝑦, potential non-labor income 𝜑, labor income 𝑚ℎ and a portion of
unobservable income 𝛾. Intuitively, equation (1) and (2) are similar when there is no
unobservable income (i.e. 𝛾 = 0) and when the sum of fake poor and true poor in the
information asymmetry case equals to the total true poor in the first-best case (i.e. 𝜋 + 𝜋 = 𝑛)
which implies that 𝑛 = 1. However, in the asymmetry case there is a positive amount of
unobservable income (i.e. 𝛾 > 0) that makes it difficult for the government to calculate how
much the contribution of the benefit to the social welfare is. In turn, it is also difficult for the
government to evaluate whether or not such benefit is cost-effective and cost-efficient in
17
c. Second-best case (single-signal)
In order to mitigate the information asymmetry problem, government may find signals
that can help distinguish applicant’s income status which then separate the types. Here, the
model consists of a signal sender drawn from a group of applicants and a signal receiver which is
a government. Suppose that the only signal available is electricity usage 𝑒 that represents the
essential component and the sender is required to send that signal to the receiver. Instead of
observing income level 𝑦, the government observes electricity usage 𝑒. Therefore, the sender
maximizes 𝑈(𝑥′, 𝑒, 𝑙, 𝑏(𝑒)). Particularly, true poor maximizes 𝑈 and the fake poor maximizes 𝑈
subject to their respective budget constraint (1 − 𝜏)(𝜑 − 𝛾𝜑) + 𝛾𝜑+ (1 − 𝜏)(𝑚ℎ − 𝛾ℎ) + 𝛾ℎ+
𝑏(𝑒) = 𝑝𝑥′𝑥′+ 𝑝𝑒𝑒, where 𝑒 is the electricity usage priced at 𝑝𝑒. Let 𝑈𝑞 be a constant (i.e. the
payoff from not participating). The receiver maximizes her payoff function subject to her budget
constraint; true poor’s individual rationality (IR) constraint 𝑈 (𝑥′, 𝑒, 𝑙, 𝑏(𝑒)) ≥ 𝑈(𝑥, 𝑙) = 𝑈𝑞;
fake poor’s IR constraint 𝑈 (𝑥′, 𝑒, 𝑙, 𝑏(𝑒)) ≤ 𝑈(𝑥, 𝑙) = 𝑈𝑞; true poor’s incentive compatibility
(IC) constraint 𝑈 (𝑥′, 𝑒, 𝑙, 𝑏(𝑒)) ≥ 𝑈 (𝑥′, 𝑒, 𝑙, 𝑏(𝑒)); and fake poor’s IC constraint
𝑈 (𝑥′, 𝑒, 𝑙, 𝑏(𝑒)) ≥ 𝑈 (𝑥′, 𝑒, 𝑙, 𝑏(𝑒)) (see section c of appendix for details about the relationship
between 𝑥′ and 𝑥). While IR constraints serve as a guarantee that participating (not participating)
in the game will give better payoff to true poor (fake poor), IC constraints ensure that the payoff
of each type is better when each type receives the bundle (𝑏, 𝑒) intended for that type than when
it receives the bundle intended for the other type. However, unlike in other literatures that both
types are better-off from participating; in this study, receiver’s objective is to make the true poor
better-off while fake poor worse-off from participating. That said, the inequality sign in true
18
are particularly needed when the information asymmetry is present. They help reveal the types of
senders and characterize the separating equilibria of the signaling game model. Therefore, the
resulting MCBs of true poor and fake poor are, respectively, given by
𝛿4∗ = [
𝜋(1−𝜌)𝛿1
𝜌 (
𝑃𝑒𝑏(𝑒)
𝑃𝑔𝐺−𝜋(𝜑+𝑚ℎ−𝑃𝑒𝑒)−𝜋(𝜏(𝑚ℎ−𝛾ℎ)+𝜏(𝜑− 𝛾𝜑)−𝑏(𝑒))) −
𝛿2𝑏(𝑒) 𝑒 ⁄ ] 1
𝜕𝑏 𝜕𝑒 ⁄
and (3)
𝛿4∗ = [𝜋(1−𝜌)𝛿1
𝜌 (
𝑃𝑒𝑏(𝑒)
𝑃𝑔𝐺−𝜋(𝜑+𝑚ℎ−𝑃𝑒𝑒)−𝜋(𝜏(𝑚ℎ−𝛾ℎ)+𝜏(𝜑−𝛾𝜑)−𝑏(𝑒))) − 𝛿 2𝑏(𝑒)
𝑒 ⁄ ] 1
𝜕𝑏 𝜕𝑒 ⁄ ,
where 𝛿1 is the marginal contribution of private goods consumption, 𝛿2 is the marginal
contribution of electricity usage (see section b of appendix for details on the problem setup). The
MCBs look tedious. However, equation (3) shows that, although the government does not have
full information about applicant’s income, the government can use the electricity usage as the
signal of the income level in order to determine the eligibility. That said, the government has a
better control over the information asymmetry in this case than in the previous case. Particularly,
although the unobservable income 𝛾 still exists in the equation, the presence of electricity usage
is able to characterize the types of applicants and alter the overall MCBs. However, since it is not
of interest to use a single signal in this model other than to make a comparison analysis which is
presented in the next section, interpretation of the parameters in this equation is unnecessary.
Now, suppose that the only signal available is required-hour. In this case, the sender
maximizes 𝑈(𝑥, 𝑙, 𝑏(𝑟)), particularly the true poor maximizes 𝑈 and the fake poor maximizes 𝑈
subject to their respective budget constraint (1 − 𝜏)(𝜑 − 𝛾𝜑) + 𝛾𝜑+ (1 − 𝜏)(𝑚(𝐻 − 𝑙 − 𝑟) −
𝛾ℎ) + 𝛾ℎ+ 𝑏(𝑟) = 𝑝
𝑥𝑥, where 𝑟 is the required-hour valued at 𝑚. On the other hand, after
19
constraint, and the associated individual rationality (IR) and incentive compatibility (IC)
constraints. The resulting MCBs of true poor and fake poor are, respectively, given by5
𝜃3∗ = 𝜋(1−𝜌)𝜃1 𝜌(𝜕𝑏⁄ ) 𝜕𝑟 (
𝑚𝑏(𝑟)
𝑃𝑔𝐺−𝜋(𝜑+𝑚ℎ)−𝜋(𝜏(𝑚ℎ−𝛾ℎ)+𝜏(𝜑− 𝛾𝜑)−𝑏(𝑟)) )
and (4)
𝜃3∗ =𝜋(1−𝜌)𝜃1 𝜌(𝜕𝑏 𝜕𝑟⁄ )(
𝑚𝑏(𝑟)
𝑃𝑔𝐺−𝜋(𝜑+𝑚ℎ)−𝜋(𝜏(𝑚ℎ−𝛾ℎ)+𝜏(𝜑−𝛾𝜑)−𝑏(𝑟))).
The results above are somewhat surprising. After applying the assumptions in section d
of appendix, it turns out that both MCBs have negative values. Although it is not the scope of
this study to evaluate at what level of required-hour that results in the biggest reduction in MCB,
the results imply that when required-hour is the only ordeal, every additional of benefits dollar
contributes to a reduction in overall payoff of the applicant. Additionally, whether or not there is
an inflection point that can result in a positive value of MCB is also not a scope of this study.
d. Second-best case (double signals)
Alternatively, suppose that both signals are available. The sender maximizes
𝑈(𝑥′, 𝑒, 𝑙, 𝑏(𝑟, 𝑒)), particularly the true poor maximizes 𝑈 and the fake poor maximizes 𝑈
subject to their respective budget constraint (1 − 𝜏)(𝜑 − 𝛾𝜑) + 𝛾𝜑+ (1 − 𝜏)(𝑚(𝐻 − 𝑙 − 𝑟) −
𝛾ℎ) + 𝛾ℎ+ 𝑏(𝑟, 𝑒) = 𝑝
𝑥′𝑥′+ 𝑝𝑒𝑒. On the other hand, after observing (𝑟, 𝑒), the receiver
maximizes her payoff function subjects to her budget constraint, and the associated individual
rationality (IR) and incentive compatibility (IC) constraints (see section b of appendix for details
20
on the problem setup). The resulting MCBs of true poor and fake poor are, respectively, given
by6
𝜎4∗=
𝜎2𝑚𝑏(𝑟,𝑒)
𝑒(𝜕𝑏⁄ 𝑃𝜕𝑟 𝑒−𝜕𝑏⁄ 𝑚)𝜕𝑒
and (5)
𝜎4∗= 𝜎2𝑚𝑏(𝑟,𝑒) 𝑒(𝜕𝑏 𝜕𝑟⁄ 𝑃𝑒−𝜕𝑏 𝜕𝑒⁄ 𝑚)
.
Unlike single-signal MCBs that are determined by many variables and constants,
double-signal MCBs with required-hour and electricity usage double-signals are only determined by marginal
coefficient of electricity usage, per-hour opportunity cost, level of benefit, electricity usage, price
of electricity, change of benefit given the change of time and change of benefit given the change
of electricity usage. Given the fact that all these determinants are observable, it is easy to
calculate and compare the MCB of both groups. If true poor’s MCB is higher than fake poor’s
MCB, then using time and electricity usage can distinguish the types so that only one type
receives the benefit and improve the true poor’s payoff and social welfare. Therefore, it can
mitigate the information asymmetry. One thing worth pointing out is that by monotonicity
assumption and single crossing condition, the separating equilibrium exists, that is, there exists
𝑟∗ and 𝑒∗ that separates the true poor from the fake poor, so this study only focuses on analyzing
the MCBs without necessarily showing the equilibrium existence.
VI. COMPARISON ACROSS TYPES AND CASES
Having derived the MCBs of all different cases, the last thing to do is to see how the
MCBs are different between types, from case to case and what explains the differences. Based on
21
the MCBs presented in section V and the assumptions in section d of appendix, the following
evaluations are conducted to compare MCBs from different cases. The details are presented in
section e of appendix. Since the payoff equation is a semi-log where the independent variables
are in ln form, so as long as the MCB is greater than zero, holding others constant, an increase in
benefit will increase the payoff at a decreasing rate. Since MCB is to show how much the payoff
might change given one percentage change in benefit holding others constant, it is very useful for
the government if it is concerned about the percentage change of benefit that it aims to achieve
for the next budget allocation. The first set of evaluations is to compare true poor’s MCB to fake
poor’s one, as follows. In information asymmetry case, it is clear that true poor’s MCB is higher
than fake poor’s or 𝛽3∗ > 𝛽
3∗. It is interpreted as the change in payoff of true poor is higher than
that of fake poor as the benefit changes by one percentage holding others constant. In
second-best case (single-signal: electricity usage), whether or not true poor’s MCB 𝛿4∗ is higher than fake
poor’s 𝛿4∗ depends on whether 𝛿2𝑏(𝑒) 𝑒
⁄ ≥< 𝛿2𝑏(𝑒)⁄𝑒. To be consistent with other cases, the
following is assumed.
Assumption 2. Higher income individuals have lower ratio of marginal coefficient of
electricity usage and the usage itself.
The assumption is to ensure that, for any benefit level, true poor’s MCB is higher than
fake poor’s. The assumption is based on the argument that fake poor are the marginal individuals
whose income level is relatively close to the true poor’s income level. That said, there should not
be a substantial difference between marginal coefficient of electricity usage of fake poor and of
true poor; and between electricity usage of fake poor and true poor but the difference in
22
poor’s electricity usage is higher than true poor’s so the fake poor’s ratio is smaller than the true
poor’. Therefore, true poor’s MCB 𝛿4∗ is higher than fake poor’s 𝛿 4∗.
In the second-best case (single-signal: required-hour), the relationship between true
poor’s and fake poor’s MCB is meaningless since using required-hour as the only signal would
actually reduce the payoff as the benefit increases by one percentage point. In the second-best
case (with double signals: electricity usage and required-hour), when single crossing condition
for doubles signals (i.e. 𝑀𝑅𝑆𝑟,𝑒> 𝑀𝑅𝑆𝑟,𝑒) holds, it is obvious that true poor’s MCB is higher
than fake poor’s or 𝜎4∗ > 𝜎
4∗. More details are presented in section f of appendix.
The second set of evaluation is to compare the MCBs across cases. This is also to
examine whether or not the true poor’s (fake poor’s) payoff improves (lowers) after the
introduction of double signals. From cases comparison (section f of appendix), it is clear that true
poor’s (fake poor’s) payoff is lower (higher) in the asymmetry case than in the first-best case.
Furthermore, true poor’s (fake poor’s) MCB is better (lower) in the second-best case with double
signals than in the asymmetry case. The final comparison is between the second-best case with
double signals and a single signal. From section f of appendix, it is clear that the MCB with
double signals is higher than MCB with required-hour as the only signal. However, to compare
the MCB with double signals to MCB with electricity usage as the only signal, the following
assumption is needed.
Assumption 3. The prior probability 𝜌 that the sender is of type 𝑡 is high, that is, the
receiver places sufficiently high probability and the cost of sending one signal should be
substantially different from the cost of sending the other signal.
The assumption intuitively says that given the fact that the receiver has to give benefit to
23
probability is high. Also, the assumption intuitively requires that the cost of sending one signal
should be substantially higher than the cost of sending the other signal. In this case, the fact that
the per-hour opportunity cost 𝑚 (e.g. wage rate) is substantially higher than the unit price of
electricity usage 𝑃𝑒 satisfies the assumption. Having the assumption satisfied, it is obvious that
the MCB with double signals is higher than the MCB with electricity usage as the only signal.
Having analyzed and compared all cases, this study comes to form the following propositions.
Proposition 1. Given their own characteristics, required-hour and essential component
variables can signal the income level and, hence, government’s payoff improves when these
variables are correlated to income without necessarily imposing any restriction on their
correlation; and when assumption 1-3 are satisfied.
Having derived all necessary MCBs and compared the MCBs by type and by case, the
finding shows that using double-signal approach improves overall social welfare and maintains
the argument that the true poor’s payoff should be higher than the fake poor’s across cases, while
at the same time, the approach maintains the fact that all eligibility requirements are
income-related (i.e. the welfare programs are means-tested).
Proposition 2. The result derived from the model with a single ordeal in the model will
be highly dependent on the characteristics of the signal itself. While changing electricity usage in
favor of true poor results in a positive MCB to true poor’s payoff, changing required-hour in
favor of true poor results in an opposite contribution.
When the ordeal retains the characteristics of essential component (i.e. something that an
individual must inevitably have or cannot avoid consuming in a particular geographic area or
shelter, the more the consumption the richer the individual is, and the consumption may reflect
24
in favor of true poor results in a positive MCB to true poor’s payoff. One the other hand,
required-hour is associated to opportunity cost that can only reflect the labor income. So,
hour may have the characteristics of labor income. The result shows that when
required-hour is included in the model, an increase in time required by government in favor of true poor,
in fact, results in a negative MCB to true poor’s payoff. This may partly explain the reduction in
take-up rate in many welfare benefit programs that use time as a part of the ordeals.
Proposition 3. When required-hour and electricity usage are both included in the model
as the ordeals, the MCB to true poor’s payoff turns out to be a positive value.
There are two possible explanation with regard to proposition 3. Firstly, the negative
effect shown in the result when required-hour is the only signal may be more than offset by the
positive effect tied to the electricity usage. Secondly, when required-hour is paired with
electricity usage as ordeals, the direction of the effect tied to required-hour changes. However,
further research is needed to evaluate this argument. One thing worth mentioning is that although
the result shows a positive MCB when electricity usage is the only ordeal, relying on a single
ordeal to separate the types of applicants may not be efficient: increasing the level of ordeal to
separate the types will be too costly to a government and, at the same time, may be too costly to
the true poor. Therefore, having both ordeals is preferable since the cost of application may be
well distributed across ordeals.
Proposition 4. The benefit and the payoff received by true poor applicant are lower in the
presence of information asymmetry than in its absence since a part of the benefit has now gone
to fake poor.
This is to say that when there is information asymmetry, the total benefit provided by
25
𝑏(𝑦). This equals to the benefit received by the true poor 𝑏(𝑦) in the first-best case. Note that the
government provides a particular amount of benefit for a particular feasible number of
applicants. Although there are two types of applicants, the government does not divide the
benefit based on types since it is assumed that the government does not have full information
about applicant’s income but a portion of the benefit goes to each type. Therefore, the presence
of information asymmetry gives incentive to the fake poor to apply for the benefit since it may
enjoy a part of the benefit that could have been completely given to the true poor. By doing so,
the fake poor may be better-off. This, indeed, makes the true poor applicant unhappy since a part
of their payoff vanishes after a part of total benefit goes to the fake poor. One thing worth
pointing out is that none of the cases presented earlier affects the total benefit: each case does not
affect the spending allocation for the benefit but the total recipients from the true poor group.
Although the benefit is a function of income level (in both first-best and information asymmetry
cases) and of signals (in second-best cases), the total benefit provided by the government is not
continuously determined by the income level or the signals. The government provides total
benefit 𝑏 if the applicant meets the required level of income or signals and zero benefit if the
applicant does not meet the required level.
Proposition 5. Since for any level of benefit, true poor has higher marginal coefficient of
benefit than fake poor, improving the true poor’s MCB while lowering the fake poor’s MCB
significantly improves (lowers) the true poor’s (the fake poor’s) payoff which, in turn, improves
the overall social welfare, particularly, after the introduction of double-signal approach.
Proposition 6. There are at least three advantages of having double signals. The first is
that electricity usage is needed to signal total income, both labor and non-labor income.
26
have a big difference in the electricity usage, having required-hour can amplify the effect of
signal and enhance the differences of the types. The third is that having one signal as the only
device may not result in an efficient way to welfare benefit targeting since it may be costly to the
applicant but does not benefit the government as much.
VII. DISCUSSION
This section discusses the potential application of the double-signal model presented in
this study. The importance of this model is that by using income-related variables, instead of
income level, as the ordeals, it is expected that a government can reveal the types of the
applicants and make truly eligible applicants (i.e. the true poor) better-off while, at the same
time, the fake poor worse-off. This idea is applicable either in a single-period analysis when
there is an immediate change of rule of the game (e.g. benefit requirements) made by the
government implemented within one particular term (e.g. within the current 6-month benefit
period) or in a multi-period analysis when the change is effective in the subsequent terms after
the former term ends (e.g. for the next 6-month benefit periods). Practically, a government may
either use the double-signal approach along with other screening mechanisms or use it as a
stand-alone approach. However, the advantages of having the approach in addition to other
mechanisms are not the focus of this study.
The model in this study is designed to be universally applicable. By universal, the
government can use the model in any means-tested welfare programs by making some
adjustments specific to each program. One may think of including several parameters that can
best explain each program. However, this requires special attention, time investment and can be
27
program to another difficult. For the sake of simplicity, another way that one can take is by
adjusting the policy components in the model. These include adjustments in the benefit level,
double-signal parameters, and the costs that are associated to the signals. Of course, one may
argue that the costs are incurred by the applicants not the government. One important thing to
note is that government may have partial controls over the costs (e.g. by requiring a particular
amount of time required to complete the application process which then determine the costs
associated to the time, requiring applicants to have multiple trips to welfare office, etc.). While
the adjustments themselves should represent some of the characteristics of the programs, the
resulting cutoffs should represent some of the programs’ eligibility requirements. Hence, the
ability to adjust these components makes this model universally applicable. Also, one can easily
make comparison on how effective the policy components are and evaluate at what level of
policy components the optimal results exist.
Additionally, the model also supports bundled programs in which if an applicant is
eligible for program A, he/she may also be eligible for program B but not necessarily vice versa.
In this case, the government needs to set policy components for program A based on the model
before qualifying the applicants for program B. In other cases, the applicant’s electricity usage
may be subsidized. Although it is not of the interest of this study, to handle this, one may need to
include a subsidy parameter in the model, particularly let 𝑏 be a function of double signals (𝑟, 𝑒)
and subsidy 𝑠. For example, one may have 𝑏(𝑟, 𝑒 − 𝑠) for all 𝑒 > 𝑠 or 𝑏(𝑟, 0) for all 𝑒 ≤ 𝑠. Case
𝑒 > 𝑠 implies that the applicant has more usage than what has been subsidized so that it has to
pay the extra usage. Having 𝑒 > 𝑠 may lower the second argument of 𝑏. Case 𝑒 ≤ 𝑠 implies that
the household’s usage is fully paid by the subsidy. So, assuming non-negativity, if 𝑒 ≤ 𝑠 then
28
increase the likelihood of the applicants to receive the benefits. The arguments are that those who
have been eligible and receiving the electricity subsidy for the poor should also be eligible for
the welfare program; and that it is to guarantee that if the applicant is revealed as poor in subsidy
program, he/she is likely to be revealed as poor in the welfare program so that there is a
consistency in defining the poor across means-tested programs.
VIII. CONCLUDING REMARKS
This study examines the performance of double-signal approach in mitigating the
information asymmetry between applicants and government and improving the social welfare.
Applicants consist of two types, namely, truly eligible applicants (i.e. true poor) and truly
ineligible applicants (i.e. fake poor). Particularly, this study investigates how the approach
affects the contribution of benefit to the payoff function while keeping the other variables
unchanged. However, rather than looking at the changes of total payoff, this study is looking at
the changes in marginal coefficient of benefit (MCB). Practically, this study compares the MCB
in four cases, namely, first-best case, information asymmetry case, second-best case with
single-signal and second-best case with double single-signals. True poor and fake poor are different in
characteristics and upon these differences some assumptions (listed in section d of appendix)
necessary for the equilibria are made. The analyses begin with comparing the fake poor’s MCB
to true poor’s MCB. The final analysis compares the MCB of a particular type across cases.
As shown earlier, the presence of information asymmetry (IA) lowers (raises) the true
poor’s (fake poor’s) payoff that is higher (lower) in the absence of it (i.e. in the first-best case
FB). Particularly, the resulting payoff of true poor is 𝑈𝐼𝐴(𝑦) < 𝑈𝐹𝐵(𝑦) and of fake poor is
29
social welfare is then 𝑊𝐼𝐴(𝑦) < 𝑊𝐹𝐵(𝑦). This study then shows how to improve the applicant’s
payoff as well as the social welfare through the introduction of double signals in the second-best
(SB) case. The result shows that, although the payoff of true poor and the social welfare in the
second-best case are lower than in the first-best case, they are higher than that in information
asymmetry case. Particularly, the payoff of true poor 𝑈𝑆𝐵(𝑟, 𝑒), fake poor 𝑈𝑆𝐵(𝑟, 𝑒) and the
social welfare 𝑊𝑆𝐵(𝑟, 𝑒) are given by 𝑈𝐹𝐵(𝑦) > 𝑈𝑆𝐵(𝑟, 𝑒) > 𝑈𝐼𝐴(𝑦), 𝑈𝐹𝐵(𝑦) < 𝑈𝑆𝐵(𝑟, 𝑒) <
𝑈𝐼𝐴(𝑦) and 𝑊𝐹𝐵(𝑦) > 𝑊𝑆𝐵(𝑟, 𝑒) > 𝑊𝐼𝐴(𝑦) respectively.
Furthermore, there are important points worth commenting. Firstly, in the absence of
information asymmetry (i.e. from the first-best case), the benefit is only given to the true poor as
much as 𝑏(𝑦)∗= 𝛽𝛽3
1 𝜕𝑏
𝜕𝑦
⁄ (𝑃𝑔𝐺𝑛 −𝜑−𝑚ℎ)
(1−𝜏) . In the presence of information asymmetry, the benefit
received by the true poor is 𝑏(𝑦)∗=
𝛽3𝜕𝑏⁄ [𝜕𝑦𝑃𝑔𝐺𝜋 −(𝜑+𝑚ℎ)−𝜋𝜋(𝜏(𝑚ℎ−𝛾ℎ)+𝜏(𝜑− 𝛾𝜑)−𝑏(𝑦))]
𝛽1(1−𝜏) . Note that 𝑛
in the first-best case is the total of true poor applicants, so it is equivalent to 𝜋 in information
asymmetry case. That said, it is clear that the benefit received by true poor applicant is lower in
the presence of information asymmetry than in its absence since a part of 𝑏(𝑦) has now gone to
the fake poor as much as 𝑏(𝑦). When there is information asymmetry the total benefit provided
by government is 𝑏(𝑦) + 𝑏(𝑦) which is equal to 𝑏(𝑦), total benefit in the first-best case. Hence,
information asymmetry does not affect the total means-tested benefit provided by government.
Secondly, the presence of information asymmetry gives incentive to the fake poor to apply for
the benefit since the fake poor may enjoy a part of the benefit that could have been completely
given to the true poor. By doing so, the fake poor is better-off while the true poor is worse-off.