www.hydrol-earth-syst-sci.net/14/1221/2010/ doi:10.5194/hess-14-1221-2010
© Author(s) 2010. CC Attribution 3.0 License.
Earth System
Sciences
Stochastic rainfall analysis for storm tank performance evaluation
I. Andr´es-Dom´enech1, A. Montanari2, and J. B. Marco1
1Instituto de Ingenier´ıa del Agua y Medio Ambiente, Universidad Polit´ecnica de Valencia, Camino de Vera s/n,
46022, Valencia, Spain
2Facolt`a di Ingegneria, Universit`a di Bologna, Viale Risorgimento 2, 40136 Bologna, Italia
Received: 4 February 2010 – Published in Hydrol. Earth Syst. Sci. Discuss.: 11 March 2010 Revised: 21 June 2010 – Accepted: 1 July 2010 – Published: 9 July 2010
Abstract. Stormwater detention tanks are widely used for mitigating impacts of combined sewer overflows (CSO) from urban catchments into receiving water bodies. The optimal size of detention tanks depends on climate and sewer sys-tem behaviours and can be estimated by using derived dis-tribution approaches. They are based on using a stochastic model to fit the statistical pattern of observed rainfall records and a urban hydrology model to transform rainfall in sewer discharge. A key issue is the identification of the optimal structure of the stochastic rainfall model. Point processes are frequently applied, where rainfall events are schematised through the occurrence of rectangular pulses, which are gov-erned by rainfall descriptors. In the presented model these latter descriptors are the interevent time (duration of the dry period between consecutive storms), event rainfall depth and event rainfall duration. This paper focuses on the analyti-cal derivation of the probability distribution of the number and volume of overflows from the storm tank to the receiv-ing water body for different and non-standard shapes of the probability distribution for above mentioned descriptors. The proposed approach is applied to 2 different sites in Spain: Valencia and Santander, located on the Mediterranean and northern Atlantic coastline, respectively. For both cases, it turned out that Pareto and Gamma-2 probability distributions for rainfall depth and duration provided a better fit than the exponential model, widely used in previous studies. A com-parison between the two climatic zones, humid and semiarid, respectively, proves the key role played by climatic condi-tions for storm detention tanks sizing.
Correspondence to: I. Andr´es-Dom´enech ([email protected])
1 Introduction
Stormwater detention tanks are widely used for mitigating impacts of combined sewer overflows into receiving water bodies. Even if a lot of methodologies for sizing these facil-ities have been developed in the last decades, there are still some open questions for the determination of the appropri-ate detention volume required to keep the overflow pollu-tant concentration within acceptable limits (Deutsch et al., 2003). Some countries are making strong efforts to standard-ize these methods, always realizing that climatic conditions play a key role (Woods-Ballard et al., 2007). In general, tech-niques used to size such storage facilities and analyze their performance fall into two categories: analytical methods and simulation approaches. Analytical statistical methods esti-mate tank performances by analytically deriving the proba-bility distribution of tank failure and overflow volume, de-pending on rainfall statistics and by using simple schemes to compute the sewer flow. Simulation approaches are carried out by generating synthetic long series of sewer discharges, from which statistics for tank performance can be derived. Analytical methods have the advantage of being simple and allow to quickly screen a wide range of design possibili-ties. Conversely, simulation procedures are time consuming. They can be used to refine the solution by exploring with more details few final alternatives. In this paper we focus on the former category, therefore estimating tank efficiency by means of analytical derivation, while we validate the results by performing continuous simulation.
Since DiToro and Small (1979) developed one of the first probabilistic methods the state-of-the-art has notoriously im-proved. Early developments by the US Environmental Pro-tection Agency (EPA) (Driscoll et al., 1986) described the probability density function of the runoff process and their relationship with tank performance. Later, some quality as-pects such as pollutant removal by sedimentation were con-sidered (Walker et al., 1993; Papa and Adams, 1996).
All probabilistic approaches require a description of the rainfall input through a stochastic model. Point processes are frequently applied where rainfall events are schematised through the occurrence of rectangular pulses, which are gov-erned by rainfall descriptors. In the presented model these latter are the expected values of (1) interevent time, (2) event rainfall depth and (3) event rainfall duration. A key issue is the description with probability density functions (pdfs) of the frequency of occurrence for the above descriptors. Ex-ponential functions have been usually adopted. In fact, most of the models used to date are based on this assumption (Di-Toro and Small, 1979; Adams et al., 1986; Guo and Adams, 1999; Guo and Urbonas, 2002). Actually, robust proba-bilistic methods, developed in the US and Canada, use the above assumption. One of the reasons why the exponential probability distribution has been widely used is its simplic-ity, which makes analytical derivation easier. On the other hand, it has limited ability to describe rainfall statistics in some cases, including the rainfall series analysed in this pa-per. Therefore we looked for an alternative approach.
In this paper an analytical model for designing the storage volume of detention tanks is proposed, which uses alternative solutions to the exponential distribution for rainfall descrip-tors. A simple conceptual rainfall-runoff model is used to transform rainfall into sewer discharge, therefore allowing to analytically deriving the probability distribution of number and volume of overflows for the detention tank.
The suitability of the exponential model for rainfall de-scriptors is first discussed with reference to the rainfall series of two different sites in Spain: Valencia and Santander. As significant differences from the exponential model emerge, alternative probability distributions are considered. Subse-quently, results for rainfall characterisation in northern and Eastern Spain are compared. Finally, analytical probabilistic expressions are derived in order to assess the frequency of oc-currence of number and volume of tank overflows, allowing to estimate the storm tank efficiency. In detail we estimate volumetric efficiency and overflow reduction efficiency. The former is defined as the long term ratio between runoff vol-ume produced in the urban catchment and volvol-ume detained by the tank. The latter is defined as the probability of an event to produce overflow, which can be estimated as the long term ratio of the number of events completely detained over total number of events. The accuracy of the results achieved with this latter analytical approach is checked by comparison with the outcome of a continuous simulation performed in a urban catchment in Valencia.
2 Description of data set and case study
2.1 Meteorological data
High resolution rainfall data over an extended period are needed in order to reliably assess the suitability of different probability distributions for the rainfall descriptors. Accord-ingly, rainfall series from Valencia (Eastern Spain) and San-tander (Northern Spain) have been collected.
Valencia is located on the eastern Mediterranean coastline of Spain. Its climate is Mediterranean, mild, with some semi-arid features. Average temperature is around 18◦C, with os-cillations between 11◦C in January and 26◦C in August.
Av-erage annual rainfall depth is close to 450 mm, with a very strong seasonality. Rainfall storms are usually concentrated in autumn, with typical very high peak intensities (torren-tial rain). The rainfall series was observed by the J´ucar river basin hydrological service (SAIH) during the period 1990– 2006 with 5-min resolution. Observations were checked and validated by a comparison with the Spanish Meteorological Agency (AEMET) daily observations.
Santander is located on the northern Atlantic coast of Spain. The city is under the influence of a humid oceanic climate; its main features are a mild and warm tempera-ture regime and plenty of rainfall well distributed through-out the year. Thus, average temperatures are between 9◦C in February and 20◦C in August and average annual rainfall depth is over 1100 mm. The rainfall series was observed by AEMET with 5-min resolution during the period 1942–1951 and 1955–1983.
To further confirm reliability of the data, rainfall obser-vations were aggregated into monthly and annual totals and then compared with those obtained at nearby raingauge sta-tions. In the case of Santander the validation was fully satis-factory and, in the case of Valencia, it allowed us to identify and correct two observation errors occurred during the years 1990 and 2000. Monthly aggregated rainfall series for both locations are shown in Fig. 1.
2.2 Case study
The analytical model developed in this paper was applied to size and verify a detention tank located in an urban catchment in Valencia. The results are compared with those obtained with a continuous simulation approach. Environmental im-pacts of CSO to the receiving water bodies (Valencia beaches and the America’s Cup leisure docks) are being increasingly taken into consideration. For this reason the local sewerage master plan is in charge of developing guidelines to design detention tanks.
The Pio XII urban catchment is located at the headwaters of one of the most important trunk sewers of the city, which frequently overflows into the above referred docks. The catchment is 68.8 ha large and the length of the considered
(a)
VALENCIA
0 50 100 150 200 250 300 350 400 450
0
1
/9
0
0
1
/9
2
0
1
/9
4
0
1
/9
6
0
1
/9
8
0
1
/0
0
0
1
/0
2
0
1
/0
4
0
1
/0
6
Month
R
a
in
fa
ll
in
te
n
s
it
y
(
m
m
/m
o
n
th
)
(b)
SANTANDER
0 50 100 150 200 250 300 350 400 450
0
1
/4
2
0
1
/4
7
0
1
/5
2
0
1
/5
7
0
1
/6
2
0
1
/6
7
0
1
/7
2
0
1
/7
7
0
1
/8
2
Month
R
a
in
fa
ll
in
te
n
s
it
y
(
m
m
/m
o
n
th
[image:3.595.59.537.75.275.2])
Fig. 1. Monthly rainfall time series for Valencia and Santander.
[image:3.595.128.470.309.564.2]
200 m
OUTFALL
Fig. 2. The Pio XII urban catchment in Valencia: tributary area and topology.
sewer network is 13.4 km, with 565 manholes, i.e, one man-hole each 23.7 m on average (see Fig. 2).
The network topology and geometry, as well as historical hydraulic data, are provided by the Municipality of Valencia. Land use distribution, which is needed in order to estimate infiltration parameters for the rainfall-runoff model, is ob-tained from data provided by the Urban Master Plan and re-classified according to the local guidelines for sewer system design (Municipality of Valencia, 2004), which considers 4
land use types only: paved areas, high density building areas, low density building areas and green spaces. For each land use, a dimensionless area ratio,ai, is defined as
ai=
Ai
A, (1)
whereAis the total tributary area of the catchment andAi
the total area of land use i in the catchment. In addition, each land use is characterized by an infiltration parameterP0i
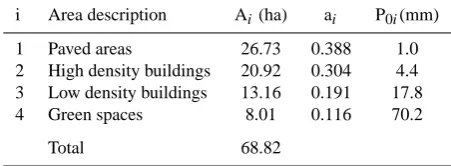
Table 1. Pio XII urban catchment parameters.
i Area description Ai(ha) ai P0i(mm)
1 Paved areas 26.73 0.388 1.0
2 High density buildings 20.92 0.304 4.4
3 Low density buildings 13.16 0.191 17.8
4 Green spaces 8.01 0.116 70.2
Total 68.82
(mm), which represents the runoff threshold, i.e. the amount of rainfall needed for runoff to begin. Table 1 summarizes all these parameters.
3 Framework of the analysis
3.1 Rainfall model
Rainfall characterisation is carried out by identifying and calibrating a suitable stochastic process for rainfall inten-sity along time. We consider a point process as a candidate model and assume rainfall events can be represented as rect-angular pulses occurring accordingly to a Poisson process. This means that interevent time is exponentially distributed (Cox and Isham, 1980). We also assume that event rainfall depth and duration are outcomes from two different and inde-pendent stochastic processes. Therefore the rainfall descrip-tors are interevent time,s(t ), event rainfall depth,v(t ), and event duration,d(t ). These are supposed to be governed by stochastic processes indicated with the symbolsS,V andD, respectively.
Main steps for identification and calibration of the above rainfall model are (1) identification of statistically indepen-dent storms, (2) study of temporal dependence and cross de-pendence between rainfall descriptors which are derived for each event and, finally, (3) fitting of probability density func-tions (pdfs) to the descriptors themselves. As for step (1), the approach that is adopted here consists of selecting a critical valuescrit for the interevent times(t ), so that events sepa-rated by a dry period greater thanscrit are considered to be independent (note that the interarrival time between events is also used with the same purpose. For a discussion see Bonta and Rao, 1988). A technique that is frequently used for selec-tion of the optimal value ofscrit was proposed by Restrepo-Posada and Eagleson (1982). Accordingly, all events are first considered to be statistically independent therefore obtaining a sample ofs(t )values. Then,scritis identified so that the
hy-pothesis that thes(t )values greater thanscritcan be
consid-ered outcomes from the exponentially distributed stochastic processScannot be rejected (see also Bonta and Rao, 1988). The obtained value ofscritis used for identifying independent
storms.
The original methodology as developed by Restrepo-Posada and Eagleson (1982) establishes the selection ofscrit
by considering that the coefficient of variation (CV) of the exponentially distributed interevent times should be equal to unity. In the operational practice, for a trial value of scrit,
statistical tests can be applied in order not to reject the hy-pothesis that CV=1 for an assigned confidence level.
In the present study we developed a modified statistical criteria for the selection of scrit. In fact, we fitted to each
realisation ofS resulting from the corresponding trial scrit
value a bounded exponential distribution in order to take into account that theSseries is limited from below byscrit. The bounded exponential distribution is given by
FS(s)=1−e−β(s−scrit) s≥scrit. (2)
Note that the CV of the bounded exponential distribution is different from unity. Then, we applied the Kolmogorov-Smirnov (KS) test (as done by Koutsoyiannis and Xan-thopoulos, 1990) to compare the empirical and theoretical probability distribution given by (2), by using modified test statistics for the exponential model (Law and Kelton, 1991). Subsequently, we estimated the parameter β by maximum likelihood and theoretical probabilities for eachs were ob-tained by Eq. (2). The goodness of fit was also checked by computing the Nash-Sutcliffe (NS) index of the empirical versus the theoretical distributions and the progress of the mean value ofS and the average number of events per year againstscrit, which should follow a linear relationship for a Poisson process (see Sect. 4.1). If a reasonable value forscrit
can be estimated, suitability of the exponential distribution for interevent time is confirmed, therefore providing support to the assumption that rainfall events occur according to a Poisson process.
Oncescritis selected,v(t )andd(t )values can be estimated
for each independent event. Then, step (2) of the analysis can be carried out, which consists of checking the mutual inde-pendence ofS,V andD. This check is necessary to provide further support to the assumption of independence among the identified rainfall events. In fact, independent events are characterised by the absence of temporal correlation for each of the stochastic processesS,V andD, as well the absence of mutual correlation betweenS,V andS,D. Besides, in-dependence amongS,V andDallows us to introduce sim-plifying assumptions for the analytical model of the number and volume of tank overflows (see Sect. 4.1).
The dependence structure was analysed by estimating the linear autocorrelation coefficient, for increasing lags up to 10, of each stochastic process and the cross correlation co-efficient, at lag 0, among them. The obtained coefficients were compared against Anderson limits of the null value at the 98% confidence level.
Finally, step (3) of the analysis can be carried out by fit-ting pdfs to the stochastic processesV andD. Different can-didate models were considered, namely, the exponential dis-tribution, which is traditionally chosen in many studies, as
well as the Weibull, Gamma-2, Lognormal and generalised Pareto distributions. This latter distribution turned out to be the most appropriate forv(t )in the case studies consid-ered here (see Sects 4.1 and 4.2). In fact, this choice is sup-ported by the maximum entropy principle applied to hydro-logical variables, which implies that the appropriate distribu-tion of certain variables, for a given coefficient of variadistribu-tion, should lead to the maximum entropy. The physical reason for this outcome would be that “nature behaves in a manner that makes uncertainty as high as possible” (Koutsoyiannis, 2005). The cumulative probability function for the gener-alised Pareto distribution is given by
FV(v)=1−(1+κv/α)−1/κ, (3)
where κ>0 and α >0 are the shape and scale parame-ters, respectively. The generalised Pareto distribution per-formed satisfactorily fordas well, although for Valencia the Gamma-2 model provided a slightly better fit (see Sects. 4.1 and 4.2).
The above theoretical framework works under the assump-tion that rainfall descriptors are not affected by seasonality. However, seasonality could indeed play an important role with regard to pollutants build-up and wash-off processes. Therefore, the results for the case study are also computed by taking seasonality into consideration, to check its actual significance (see Sect. 4.3).
3.2 Rainfall-runoff model
An aggregated event rainfall-runoff model was used in order to estimate the volume of sewer discharge generated in the catchment by each rainfall event. The SCS-CN model was adopted, which was previously recalibrated for the urban area of Valencia (Gonz´alez, 2001). Model basis is the continuity equation
v=r (v)+f (v)+P0, (4)
whereP0is the initial abstraction andv,r(v)andf (v)are volumes of rainfall, runoff and infiltration of the event, re-spectively. According to the SCS-CN modelr(v)is given by
(
r (v)=0 ifv≤P0
r (v)=(v−P0)2
v+4P0 ifv > P0.
(5)
Equation (5) implies that no runoff occurs when event rain-fall depth is smaller than the threshold valueP0. Thus, under
the assumption that V is distributed according to the gen-eralised Pareto probability distribution, we obtained that the cumulative probability of null flow is given by
FR(0)=FV(P0)= Z P0
0
fV(v)dv=1− 1+κP0
α−1/κ.(6) In (6), R indicates the random variable whose outcome is the event runoffr. On the other hand, when the threshold
valueP0is exceeded thenR >0, and the expression for the cumulative probability distribution of runoff volume is
FR(r)=
Z r 0
fR(r)dr=FR(0)+
Z v
P0
fV(v)dv
=1−(1+κv/α)−1/κ (7) with an implicit expression forv(r). Thus, the probability density function for runoff volume is given by
fR(r)=
d
drFR(r)=
1
α
1+κv α
−1−1/κ ·dv
dr
= 1
α 1+κ v α
−1−1/κ
d dvr (v)
(8) with again an implicit expression forv(r).
Total areaAof the urban catchment was divided into 4 dif-ferent types of land use, each one affected by a difdif-ferent ini-tial abstractionP0i.Considering the catchment size (68.8 ha)
and shape for the case study considered here the assumption of spatial uniform rainfall appears to be reasonable. Thus, the runoff volume generated by the rainfall event is:
r (v)= 4 X
i=1
air(i)(v) (9)
whereai is the land use area ratio defined by (1) andr(i)(v)
is the runoff generated in areaAi computed by applying (5)
to areai. Therefore, Eq. (8) can be rewritten as
fR(r)=
d
drFR(r)=
1
α
1+κv α
−1−1/κ ·dv
dr
= 1
α 1+κ v α
−1−1/κ 4
P
i=1
aidvd r(i)(v)
. (10)
According to the minimum initial abstractionP01which
cor-responds to paved areas (see Table 1), the impulse probability forr=0 is
FR(0)=FV(P01)=
Z P01
v=0
fV(v)dv=1−
1+κP01
α
−1/κ
.(11) Finally, taking into account Eq. (10) and the impulse prob-ability atr=0, the expected value of event runoff volume in the catchment takes the form
E (R)=
Z ∞
0
rfR(r)dr= 1
α
Z∞
0
1+κv
α
−1−1/κX4
i=1
air(i)(v)dv. (12)
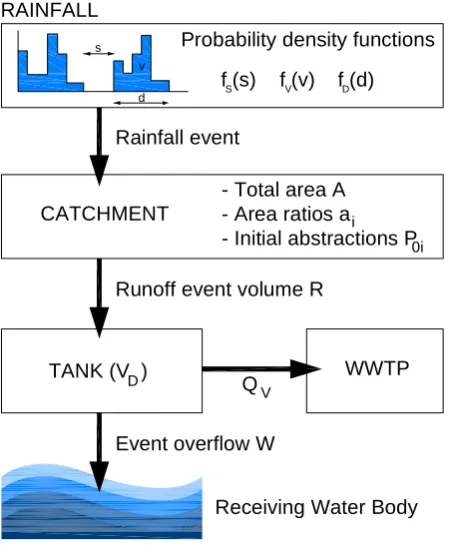
3.3 Tank overflow model
The purpose of tank overflow model is to provide an analyti-cal relationship for the number and volume of overflows from a CSO system controlled by a tank with volumeVD. We
in-dicate with the symbolQV the maximum flow rate from the
tank to the waste water treatment plant (WWTP) (see Fig. 3).
RAINFALL
CATCHMENT
TANK (V )D
QV WWTP
Rainfall event
Runoff event volume R
Event overflow W
Receiving Water Body Probability density functions
f (s)S f (v)V f (d)D
- Total area A - Area ratios a
- Initial abstractions Pi 0i v
s
d
Fig. 3. System elements: rainfall, runoff and detention.
To derive the above analytical expression, we need to first deduce the probability density function of the overflow vol-ume which we assvol-umed to be a random variable that will be indicated with the symbolW. Let us assume that runoff oc-curs as a rectangular pulse. Then, overflow volume during an assigned event is given by
w=0
ifr (v)≤VD+QV·(d (t )+tC−tR)
w=r (v)−VD−QV·(d (t )+tC−tR)
if r (v) > VD+QV·(d (t )+tC−tR)
(13)
whered(t )is duration of rainfall event,tCis concentration
time of the catchment andtRis lag time between storm and
runoff origins. In order to obtain a precautionary estimation, we setQV =0 during the event, so that the event durationd
does not play any role in the derivation of the tank efficien-cies (see Eqs. 20 and 21). Therefore the probability of no overflow is given by
FW(0)=FR(VD), (14)
and the runoff volumeris determined by event rainfall depth only, which we assumed to be distributed according to a generalised Pareto distribution (see Sect. 3.1). Given that
QV = 0, it follows that
FW(0)=FR(VD)=FV VD∗
=1− 1+κVD∗α−1/κ
w=0⇔v≤VD∗ (15)
whereVD∗ is the rainfall depth generating a runoff volume equal to the tank volume, that is,r(VD∗)=VD. Thus, if
rain-fall volume is smaller or equal than this threshold value, that is, if v≤V∗D, then there is no overflow (w=0). If v>VD∗, thenw >0 and therefore,
FW(w)−FW(0)=FR(r)−FR(VD)=
Z r VD
fR(r)dr
w >0⇔v > VD∗. (16)
By considering thatFR(r)=FV(v)andFR(VD)=FV(VD∗),
the latter probability can be written as
FW(w)−FW(0)=FV(v)−FV(VD∗)=
Z v VD∗
fV(v)dv
= 1+κVD∗α−1/κ−(1+κv/α)−1/κ. (17) Then, the distribution function assumes the following expression:
FW(w)=
(
1− 1+κVD∗ α−1/κ
if w=0
1−(1+κv/α)−1/κ if w >0. (18)
Therefore, the expected value of the spilled volume can be derived, given by the relationship
E (W )=1 α
Z ∞
VD∗ N
X
i=1
air(i)(v)−VD
!
1+κv α
−1−1/κ
dv.(19) From Eqs. (12) and (19) volumetric efficiency of the tank,
µv(VD), can be derived, that is,
µv(VD)=1−
E (W ) E (R)=1−
R∞
V∗
D
N
P i=1
air(i)(v)−VD
1+κvα−1−1/κ
dv
R∞
0 N P i=1
air(i)(v)1+κvα
−1−1/κ
dv
. (20)
The volumetric efficiency is an important index of perfor-mance, allowing to assess the mean volume detained by the tank expressed as fraction of event runoff.
Finally, the overflow reduction efficiency,µo(VD), can be
derived from Eq. (15) as it states the probability of no over-flow. It is expressed by the relationship
µo(VD)=FW(0)=1− 1+κVD∗
α−1/κ (21)
and gives the probability of an event not to produce overflow as a function of detention tank volume.
4 Results
4.1 Rainfall data analysis for Valencia
Different trial values ofscritwere considered in the range
be-tween 5 min (the temporal resolution of the available data record) and 48 h. For each selected value ofscritthe
result-ingsseries was extracted and maximum likelihood estimates for theβ parameter were obtained. Besides, for each case,
[image:6.595.56.281.65.338.2](a) 0 100 200 300 400 500
0 10 20 30 40 50
Interevent time (h)
M
e
a
n
e
v
e
n
ts
p
e
r
y
e
a
r
(b) 0.1 1.0 10.0 100.0
0 10 20 30 40 50
Interevent time (h)
K
S
G
o
o
d
n
e
s
s
-o
f-F
it
t
e
s
t
v
a
lu
e
(c) 0 50 100 150 200 250 300
0 10 20 30 40 50
Interevent time (h)
1
s
t o
rd
e
r
m
o
m
e
n
t
(m
m
)
(d) 0.0 0.1 0.2 0.3 0.4 0.5 0.6 0.7 0.8 0.9 1.0
0 10 20 30 40 50
Interevent time (h)
N
a
s
h
-S
u
tt
c
li
ff
e
i
n
d
e
[image:7.595.55.542.67.396.2]x
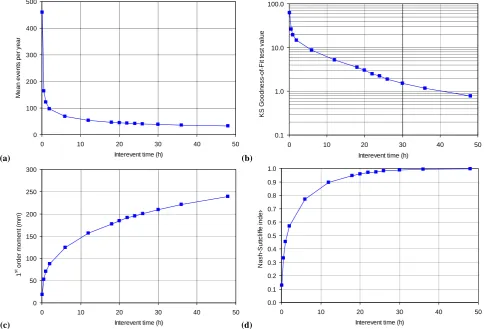
Fig. 4. Decision parameter evolution for critical interevent time selection.
the statistical tests mentioned in Sect. 3.1 were performed. The results are summarized in Fig. 4. Notice that, according to the tests,scritseems to vary in the range between 18 and
30 h. Relationships of the average number of events per year and the mean value ofS againstscrit, begin to exhibit
lin-earity from anscrit of 18–20 h. The NS index is above 0.95 for anscritgreater than 18 h. Finally, the KS test is satisfac-tory for anscritvalue around 30 h (thep-value is 1.308 for a significance levelα=0.01). Thus, a value of 22 h, which cor-responds toβ=0.0059 h−1, was finally selected. It is close to
the lower bound of the plausible values in order to increase the sample size of the rainfall events. Given thatscritis well greater than 1 h (the same result is obtained for Santander, see Sect. 4.2) it turns out that the time resolution of the rain-fall record is fine enough to effectively describe the temporal dynamics of rainfall events.
The selection of the optimal value ofscritis also supported
by the correlation analysis. In fact, it can be proved that the autocorrelation coefficients,ρV(k)andρD(k), for event
rainfall depth and event duration are always included within the 98% confidence limits for null value. For cross correla-tion analysis, cross correlacorrela-tions coefficients betweens,vand
s,d are close to 0 (ρS,V(0)= −0.01 andρS,D(0)= −0.03)
and so included within the same confidence limits. Figure 5 shows scatterplots ofvversusdands. Notice that mutual in-dependence betweenvandsis confirmed while one notes the presence of correlation betweenvandd (ρV ,D(0)=0.667).
This outcome was also found by other authors (Adams and Papa, 2000). However, the above cross correlation is not ap-preciable enough to affect the probabilistic analysis later de-veloped on Sect. 4.3, also because event duration is finally not affecting the results (see Eqs. 20 and 21).
Table 2 shows the CV andγ values for thev(t )andd(t )
time series. These values were also computed by censor-ing events whose rainfall depth is lower than 1 mm. Results show that the exponential model is quite unlikely in all cases, because CV and γ are not close to target values of 1 and 2, respectively, with the sole exception of the CV value for censoredd(t )series. Therefore a different pdf has to be se-lected for event rainfall depth and event duration. Competing formulations were identified by taking into account that the identified series are characterised by high skewness. Accord-ingly, Weibull, Gamma-2, Lognormal and Pareto distribu-tions were considered by estimating their parameters with the
(a)
0 50 100 150
0 50 100 150
Event duration (h)
R
a
in
fa
ll
D
e
p
th
(
m
m
)
(b)
0 50 100 150
0 250 500 750 1000
Interevent time(h)
R
a
in
fa
ll
D
e
p
th
(
m
m
[image:8.595.59.540.64.225.2])
Fig. 5. Scatterplots ofvversusd(left) ands(right).
Table 2. Sample coefficients of variation (CV) and skewness (γ) of event rainfall depth and duration estimated for the Valencia raingauge.
Non censored series Censored series (1 mm)
CV γ CV γ
Depth 2.06 4.76 1.57 3.97
Duration 1.47 2.80 1.14 2.32
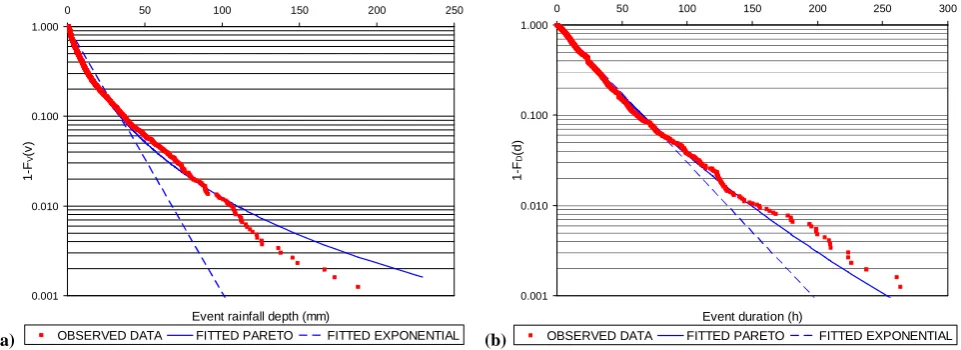
maximum likelihood procedure (MLE) and graphically com-pared against the empirical distribution (see Fig. 6). More-over, goodness-of-fit testing was performed by Kolmogorov-Smirnov (KS) test for exponential distribution, and Cramer-von-Mises (CVM) test (Choulakian and Stephens, 2001) for Pareto and Gamma-2 distributions. It turns out that, for the selected distributions, fit improves significantly if cen-sored series are used, as summarized in Table 3. It turns out thatv(t )is better described by the Pareto model, while the Gamma-2 model provides the better fit ford(t ), even though fitting provided by the exponential model is not much differ-ent in this latter case (see Fig. 6). Parameter values for best distributions are summarized in Table 4.
In order to take seasonaolity into account the same anal-ysis is carried out separately for the four seasons. The re-sults (not shown) indicate that the Pareto model is still out-performing the exponential one. The seasonal rainfall model will be used to compute tank efficiencies for each season (see Sect. 4.3).
Other models than the exponential one for event rainfall depths were employed by other authors. For instance, the Weibull model turned out to be more appropriate for some lo-cations (Brescia, Milano, Palermo, Parma and Pavia) in Italy (Balistrocchi et al., 2008).
4.2 Rainfall data analysis for Santander
Rainfall analysis was repeated for the Santander rainfall se-ries. In this case, ascrit=12 h was obtained. As for the
Va-lencia case study,v(t )is well described by the Pareto distri-bution (see Table 5), which turns out to be the best model for d(t ) also. The fit provided by the exponential model is again significantly outperformed by the Pareto alternative (see Fig. 7).
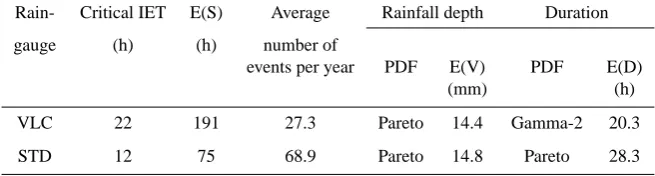
It is interesting to compare the results obtained for Valen-cia and Santander, which are characterised by a semiarid and humid climate, respectively. The critical interevent time is half at Santander compared to that at Valencia, highlighting that for a maritime climate storms occur more frequently (Ta-ble 6). An important difference lies in the event duration pdf. While at Valencia the Gamma-2 probability function pro-vides good fit (being very close to the exponential model), the Pareto model provides a better fit at Santander as expected for a more heavy-tailed behaviour. These results confirm the significant variability of statistical behaviours regarding the rainfall regime and justify the effort undertaken in this paper to develop a flexible approach to identify the most appropri-ate probability distributions for rainfall descriptors.
4.3 Application of the probabilistic model for detention tank design
The analytical model is finally applied to the selected case study of the Pio XII urban drainage catchment in Valencia. According to catchment land use (see Table 1) and estimated rainfall descriptors (see Table 4), expected values for runoff volume, E(R), and overflow volume, E(W ), are obtained for different trial values of tank volumeVD. The above
ex-pected values have been estimated by means of numerical integration ofFR(r) andFW(w). Thus, the tank
efficien-ciesµv(VD)andµo(VD)were evaluated through Eqs. (20)
and (21).
[image:8.595.52.279.326.386.2]Table 3. Goodness of fit statistic values (p-value) for original and censored rainfall series.
Rainfall descriptor Probability Goodness of fit test
distribution function Test Series test statistic value
Event rainfall depth Pareto CVM Original 0.76
CVM Censored 0.62
Gamma-2 CVM Original 1.01
Event duration CVM Censored 0.11
Exponential KS Original 6.93
[image:9.595.123.469.285.408.2]KS Censored 2.39
Table 4. Distribution functions and related MLE parameters for rainfall descriptors related to Valencia raingauge. Rainfall series was
censored by excluding events whose rainfall depth is lower than 1 mm.F andf indicate cumulative probability and the probability density,
respectively. Note that an explicit formulation ofF can not be provided for the Gamma-2 distribution.
Rainfall descriptor Probability function MLE Parameters
Interevent time Exponential FS(s)=1−e−β(s−scrit) β=0.0059
scrit=22 h
Event rainfall depth Pareto FV(v)=1− 1+καv
−1/κ
κ=0.4110
α=8.4605
Event duration Gamma-2 fD(d)=
λε 0(ε)dε
−1e−λd ε=0.7401
λ=0.0364
Exponential FD(d)=1−e−λd λ=0.0492
Table 5. Distribution functions and related MLE parameters for rainfall descriptors estimated for Santander raingauge.
Variable Probability function MLE Parameters
Interevent time Exponential FS(s)=1−e−β(s−scrit) β=0.0158
scrit=12 h
Event rainfall depth Pareto FV(v)=1− 1+καv
−1/κ
κ=0.3435
α=9.7431
Event duration Pareto FD(d)=1−
1−γ d
µ
−1/γ
γ=0.1000
µ=25.4573
Table 6. Comparison between Valencia (VLC) and Santander (STD) rainfall descriptors.
Rain- Critical IET E(S) Average Rainfall depth Duration
gauge (h) (h) number of
events per year PDF E(V) PDF E(D)
(mm) (h)
VLC 22 191 27.3 Pareto 14.4 Gamma-2 20.3
STD 12 75 68.9 Pareto 14.8 Pareto 28.3
[image:9.595.120.472.456.566.2] [image:9.595.132.460.617.705.2](a)
0.001 0.010 0.100 1.000
0 50 100 150 200 250
Event rainfall depth (mm)
1
-F
V
(v
)
OBSERVED DATA FITTED PARETO FITTED EXPONENTIAL (b)
0.001 0.010 0.100 1.000
0 20 40 60 80 100 120 140 160
Event duration (h)
1
-F
D
(d
)
[image:10.595.64.540.63.238.2]OBSERVED DATA FITTED GAMMA-2 FITTED EXPONENTIAL
Fig. 6. Exponential and alternative probability distributions for rainfall event depth and duration (Valencia raingauge).
(a)
0.001 0.010 0.100 1.000
0 50 100 150 200 250
Event rainfall depth (mm)
1
-F
V
(v
)
OBSERVED DATA FITTED PARETO FITTED EXPONENTIAL (b)
0.001 0.010 0.100 1.000
0 50 100 150 200 250 300
Event duration (h)
1
-F
D
(d
)
OBSERVED DATA FITTED PARETO FITTED EXPONENTIAL
Fig. 7. Exponential and alternative probability distributions for rainfall event depth and duration (Santander raingauge).
In order to validate the results given by the analytical method, a continuous simulation was performed by using the observed 17-year rainfall record which includes a total of 464 independent rainfall events (identified by adoptingscrit= 22 h). A complete model of the sewer network was built with InfoWorks CS software (Wallingford Software, 2008). The model describes the whole sewer network over the catchment with 565 nodes and 562 pipes, by adopting a number of sub-catchments equal to the number of nodes. Infiltration pa-rameters of the SCS-CN model were previously calibrated as referred in Sect. 3.2. With regard to numerical calculations, the implicit Preissmann scheme is used, with a minimum 60 s time step. Simulations were thus performed for a set of 7 tank volumes defined by specific volumes equal to 5, 10, 36, 50, 75, 100 and 200 m3/ha. The value 36 m3/ha was simu-lated because it corresponds with the specific volume tradi-tionnally recommended by the Municipality of Valencia.
For each tank volume,VD, total volume spilled per event
wj was obtained. Depending on total runoff volume per
event,rj, volumetric efficiencies are evaluated by
µv,sim=1− 464 P
j=1 wj
464 P
j=1 rj
. (22)
Similarly, the number of simulations generating overflow were counted to evaluate the overflow reduction efficiency,
µo,sim=1− 464 P
j=1 δj
464 (23)
[image:10.595.59.540.285.460.2](a) 0.0 0.1 0.2 0.3 0.4 0.5 0.6 0.7 0.8 0.9 1.0
0 50 100 150 200 250
Specific storm tank storage volume VD (m 3
/ha)
V
o
lu
m
e
tr
ic
e
ff
ic
ie
n
c
y
IW continuous simulation
Probabilistic model
(b)
0.0 0.1 0.2 0.3 0.4 0.5 0.6 0.7 0.8 0.9 1.0
0 50 100 150 200 250
Specific storm tank storage volume VD (m3/ha)
O
v
e
rf
lo
w
r
e
d
u
c
ti
o
n
e
ff
ic
ie
n
c
y
[image:11.595.68.529.63.203.2]IW continuous simulation Probabilistic model
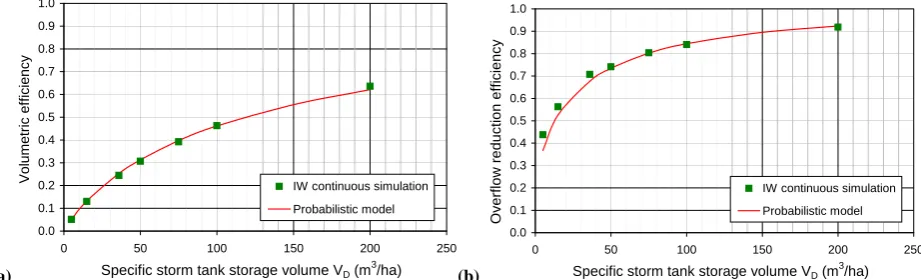
Fig. 8. Comparison between probabilistic model and continuous simulation results.
(a)
0.0 0.1 0.2 0.3 0.4 0.5 0.6 0.7 0.8 0.9 1.0
0 50 100 150 200 250
Specific storm tank storage volume VD (m3/ha)
V
o
lu
m
e
tr
ic
e
ffi
c
ie
n
c
y
Annual
Winter
Spring
Summer
Fall
[image:11.595.66.532.249.408.2](b)
Fig. 9. Comparison between annual and seasonal results for the analytical model.
where
δj=
1 if wj>0
0 if wj=0.
(24)
Figure 8 summarizes volumetric efficiencies and overflow re-duction efficiencies obtained with both the probabilistic and the continuous approaches. It can be seen that the proba-bilistic model provided satisfactory results. In particular, the specific volume recommended by the Municipality of Valen-cia allows to reach an overflow reduction efficiency of 70%. However, this corresponds to a poor volumetric efficiency of 20%. This latter value could be improved by considering a flow rate to the WWTP (QV>0).
Finally, tank performances are recalculated taken season-ality into account for the series of Valencia (Fig. 9). For each season, a volumetric and overflow reduction efficiency curve is obtained and compared with respect to those previously obtained. One can see that the effect of seasonality is indeed noticeable, but the essence of the results is unchanged. In fact one can see that the seasonal growth curves of volumetric ef-ficiency and overflow reduction efef-ficiency against the return
period have basically similar shapes, with maximum effi-ciency in Summer and minimum effieffi-ciency during Fall and Winter, as expected.
5 Conclusions
Exponential models have been widely and successfully used in the US and Canada for rainfall regime characterization as a preliminary step for the development of detention tank de-sign procedures. Nevertheless, case studies prove that such a modelling solution is simpler but often inefficient in many locations, including Valencia and Santander, considered in this study. As expected according to entropy based consid-erations, the Pareto probability distribution provided a better fit for event rainfall depth, while event duration is better fit-ted by the Gamma-2 and Pareto distributions at Valencia and Santander, respectively. These facts highlight the importance of local conditions for this issue.
An analytical approach was proposed to assess long term volumetric and overflow reduction efficiencies of storm detention tanks for sewer systems. Application of these
probabilistic expressions at an urban catchment in Valencia shows satisfactory performance for a simple single tank system. Results presented here provide support to the design of storm detention tanks for limiting pollutant concentration into receiving water bodies.
Edited by: D. Koutsoyiannis
References
Adams, B. J., Fraser, H. G., Howard, C. D. D., and Hanafy, M. S.: Meteorological data analysis for drainage system design, J. Environ. Eng.-ASCE, 112(5), 824–847, 1986.
Adams, B. J. and Papa F.: Urban stormwater management planning with analytical probabilistic methods, John Wiley & Sons, Inc, New York, USA, 358 pp., 2000.
Balistrocchi, M., Grossi, G., and Bacchi, B.: Assessment of the long term efficiency of CSO capture tanks by semiprobabilistic methods. Proceedings of the 11th International Conference on Urban Drainage, Edinburg, Scotland, UK, 1–5 September, 2008. Bonta, J. V. and Rao, R.: Factors affecting the identification of
in-dependent storm events, J. Hydrol., 98(3–4), 275–293, 1988. Calabro, P. S.: Design storms and water quality control, J. Hydrol.
Eng., 9(1), 28–34, 2004.
Choulakian, V. and Stephens, M. A.: Goodness-of-fit tests for the generalized Pareto distribution, Technometrics, 43(4), 478–484, 2001.
Cox, D. and Isham, V.: Point Processes, 1st edn., Chapman and Hall, London, England, 188 pp., 1980.
Deutsch, J-C., Revitt, M., Ellis B., and Scholes, L.: Review of the use of stormwater BMPs in Europe. Project EU RTD 5th Frame-work Prog, DayWater Research Project, Middlesex University, 2003.
Di Toro, D. M. and Small, M. J.: Stormwater interception and stor-age, J. Environ. Eng.- ASCE, 105(EE1), 43–54, 1979.
Driscoll, E. D., Di Toro, D. M., and Gaboury, D.: Methodology for analysis for detention basins for control or urban runoff quality, EPA 440/5-87-001, US Environmental Protection Agency, Of-fice of Water, Nonpoint Source Branch, Washington, DC, USA, 1986.
Gonz´alez, J.: Metodolog´ıa para la modelaci´on y dise˜no de redes de saneamiento urbano aplicada a la ciudad de Valencia. Tech-nical dissertation, Universidad Polit´ecnica de Valencia, Valencia, 2001.
Guo, Y. and Adams, B. J.: Analysis of detention ponds for storm water quality control, Water Resour. Res., 35(8), 2447–2456, 1999.
Guo, J. C. Y. and Urbonas, B.: Runoff capture and delivery curves for storm-water quality control designs, J. Water Res. Pl. ASCE, 128(3), 208–215, 2002.
Koutsoyiannis, D. and Xanthopoulos, A.: A dynamic model for short-scale rainfall disaggregation, Hydrol. Sci. J., 35(3) 303– 322, 1990.
Koutsoyiannis, D.: Uncertainty, entropy, scaling and hydrological stochastics. 1. Marginal distributional properties of hydrologi-cal processes and state shydrologi-caling, Hydrol. Sci. J., 50(3), 381–404, 2005.
Law, A. M. and Kelton, W. D.: Simulation, modeling and analysis, 2nd edn., McGraw Hill, Inc, New York, USA, 759 pp., 1991. Municipality of Valencia: Normativa para obras de saneamiento de
la ciudad de Valencia Servicio del Ciclo Integral del Agua, 2004. Papa, F. and Adams, B. J.: Application of derived probability and dynamic programming techniques to planning regional stormwa-ter management systems, Wastormwa-ter Sci. Technol., 36(5), 227–234, 1996.
Restrepo-Posada, P. J. and Eagleson, P. S.: Identification of inde-pendent rainstorms, J. Hydrol., 55(1–4), 303–319, 1982. Wallingford Software Ltd.: Infoworks CS (Collection Systems)
ver-sion 8.5.0. Desktop Help, 2008.
Walker, D., Golden, J., Bingham, D. and Driscoll, E. D.: Combined Sewer Overflow Control. EPA 625/R-93-007, US Environmental Protection Agency, Office of Research and Development, Center of Environmental Research Information, Cincinnati, Ohio, 1993. Woods-Ballard, B., Kellagher, R., Martin, P., Jefferies, C., Bray, R., and Shaffer, P.: The SUDS Manual, CIRIA C697, London, UK, 2007.