doi:10.5194/hess-15-345-2011
© Author(s) 2011. CC Attribution 3.0 License.
Earth System
Sciences
Soil surface moisture estimation over a semi-arid region using
ENVISAT ASAR radar data for soil evaporation evaluation
M. Zribi1, A. Chahbi1,2, M. Shabou1,2, Z. Lili-Chabaane2, B. Duchemin1, N. Baghdadi3, R. Amri1,2, and A. Chehbouni1
1CESBIO (CNRS/IRD/UPS/CNES), UMR 5126, 18 avenue Edouard Belin, BPI 2801, 31401 Toulouse cedex 9, France 2INAT-LRSTE, 43, Avenue Charles Nicolle 1082, Tunis, Mahrajene, Tunisia
3UMR-TETIS, CEMAGREF, Montpellier, France
Received: 23 September 2010 – Published in Hydrol. Earth Syst. Sci. Discuss.: 15 October 2010 Revised: 25 December 2010 – Accepted: 14 January 2011 – Published: 26 January 2011
Abstract. The present paper proposes a method for the eval-uation of soil evaporation, using soil moisture estimations based on radar satellite measurements. We present firstly an approach for the estimation and monitoring of soil moisture in a semi-arid region in North Africa, using ENVISAT ASAR images, over two types of vegetation covers. The first map-ping process is dedicated solely to the monitoring of moisture variability related to rainfall events, over areas in the “non-irrigated olive tree” class of land use. The developed ap-proach is based on a simple linear relationship between soil moisture and the backscattered radar signal normalised at a reference incidence angle. The second process is proposed over wheat fields, using an analysis of moisture variability due to both rainfall and irrigation. A semi-empirical model, based on the water-cloud model for vegetation correction, is used to retrieve soil moisture from the radar signal. Mois-ture mapping is carried out over wheat fields, showing high variability between irrigated and non-irrigated wheat covers. This analysis is based on a large database, including both ENVISAT ASAR and simultaneously acquired ground-truth measurements (moisture, vegetation, roughness), during the 2008–2009 vegetation cycle. Finally, a semi-empirical ap-proach is proposed in order to relate surface moisture to the difference between soil evaporation and the climate demand, as defined by the potential evaporation. Mapping of the soil evaporation is proposed.
Correspondence to: M. Zribi (mehrez.zribi@ird.fr)
1 Introduction
climatic demand. Various empirical relationships, relating the soil resistance to the surface soil moisture, have been pro-posed (Chanzy, 1991; Mahfouf and Noilhan, 1991; Chanzy and Bruckler, 1993; Simonneaux et al., 2009). Chanzy and Bruckler (1993) proposed an empirical model linking soil evaporation to soil moisture and climate demand, for differ-ent types of soil texture.
Concerning soil moisture estimation, over the last twenty years, radar remote sensing has demonstrated its strong po-tential (Ulaby et al., 1996; Moran et al., 2000; Le H´egarat-Mascle et al., 2002; Wagner et al., 2007). Using SAR ob-servations, soil moisture can be estimated with a high spatial resolution, which is not the case with other types of remote sensing measurement (Jackson et al., 1996; Baup et al., 2007; Rahman et al., 2008).
[image:2.595.311.545.62.271.2]The backscattered radar signal over bare soil strongly de-pends on soil moisture and surface roughness (Zribi et al., 2007; Baghdadi et al., 2007). In the case of sparse veg-etation, the return signal depends both on the vegetation’s backscattering characteristics, and on the attenuation it intro-duces to backscattering from the soil (Bindlish et al., 2001; Le H´egarat-Mascle et al., 2002). For bare soils, various theoretical and empirical approaches have been developed (Fung et al., 1992; Oh et al., 1992; Dubois et al., 1995; Zribi and Dechambre, 2002; Baghdadi et al., 2006; Thoma et al., 2008). Among these, the “linear approach” linking sur-face soil moisture to calibrated and validated SAR (Synthetic Aperture Radar) measurements (SIRC, ERS, RADARSAT, ASAR, TerraSAR-X, ... is widely used (Quesney et al., 2000; Zribi et al., 2007; Paris et al., 2010). The backscattered contribution from the vegetation is determined using phys-ical or empirphys-ical models (Ulaby et al., 1986; Magagi and Kerr, 1997; Wigneron et al., 1999). Because of the high spa-tial variability of soil moisture in the studied region, result-ing from variable convective phenomena causresult-ing the rain-fall to be strongly localized in small areas, and as a conse-quence of the presence of a large fraction of irrigated areas, we propose a methodology in which soil moisture is esti-mated from SAR radar data. Our approach in this study is based on ASAR/ENVISAT radar data, acquired simultane-ously with in situ measurements of surface parameters (mois-ture, roughness and vegetation). Two methodologies are pro-posed to map soil moisture over non-irrigated olive groves and wheat fields. Moisture estimations over olive groves are based, in particular, on a change-detection approach using ASAR/ENVISAT data, developed for the Sahel (Zribi et al., 2007). The methodology was broken down into several suc-cessive steps: (1) normalisation of radar data to one inci-dence angle equal to 20◦, (2) for each cell, estimation of the areas with a low vegetation density, (3) elimination of sur-face roughness by subtracting the radar data recorded during the dry season from that used for the soil moisture determi-nation, (4) retrieval of soil moisture, by inverting a linear re-lationship between the processed signals and the soil mois-ture. Moisture estimations over wheat fields are based on the
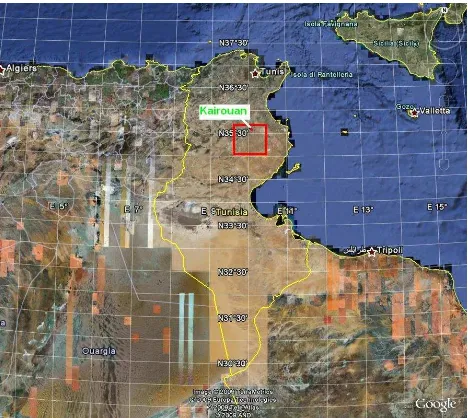
Fig. 1. Illustration of the studied site.
Cloud water model (Attema et al., 1978), using parameters estimated empirically from our database.
The present paper is organised as follows: Sect. 2 presents the data collected from the Kairouan plain region (Tunisia) under study: the database including satellite and ground-truth measurements is discussed. In Sect. 3, the proposed methodology for soil moisture retrieval is described. The de-rived results, including the validation of soil moisture estima-tions and mapping, are presented in Sect. 4. The evaluation of soil evaporation is discussed in Sect. 5. Finally, our con-clusions are provided in Sect. 6.
2 Site description and ground-truth measurements
2.1 Site description
The Kairouan plain (Leduc et al., 2007) is situated in central Tunisia (9◦300E–10◦150E, 35◦N, 35◦450N) (Fig. 1). The climate in this region is semi-arid, with an average annual rainfall of approximately 300 mm per year, characterised by a rainy season lasting from October to May, with the two rainiest months being October and March. As is generally the case in semi-arid areas, the rainfall patterns in this area are highly variable in time and space. The mean temperature in Kairouan City is 19.2◦C (minimum of 10.7◦C in January and maximum of 28.6◦C in August). The mean annual po-tential evapotranspiration (Penman) is close to 1600 mm.
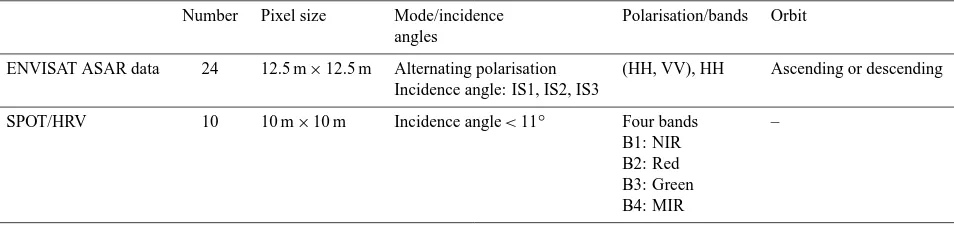
Table 1. Characteristics of ENVISAT ASAR and SPOT data used in this study.
Number Pixel size Mode/incidence Polarisation/bands Orbit angles
ENVISAT ASAR data 24 12.5 m×12.5 m Alternating polarisation (HH, VV), HH Ascending or descending Incidence angle: IS1, IS2, IS3
SPOT/HRV 10 10 m×10 m Incidence angle<11◦ Four bands – B1: NIR
B2: Red B3: Green B4: MIR
or at the time of dam releases since the construction of the Sidi Saad and El Haouareb dams. Surface and groundwater streams are drained into Sebkha Kelbia, a large salt lake. 2.2 Satellite data
2.2.1 Description
In March 2002, the European Space Agency launched the ENVISAT platform, carrying ASAR in its suite of instru-ments. Compared with ERS/SAR, this instrument has an extended measurement capacity, due to its multiple operat-ing modes (Rosich, 2002). In particular, it has a greatly improved measurement repetition rate, with less than three days between two successive images taken at two different incidence angles, as opposed to a 35-day repeat cycle for ERS/SAR. In the present study, we chose to use the nar-row observation mode, which generates high-resolution data (12.5 m×12.5 m pixel spacing). Acquisitions were made be-tween 2008 and 2010, at three different incidence angles (18◦
“IS1”, 23◦ “IS2” and 27◦ “IS3”) in co-polarized,
alternat-ing HH and VV polarization mode. Details of the SAR im-age characteristics are provided in Table 1. A large number of SPOT/HRV images was acquired simultaneously with the radar soundings. SPOT/HRV is a multi-spectral optical sen-sor, with two bands in the visible domain, one in the near infrared, and one in the medium infrared. These proved par-ticularly useful for the mapping of land use and vegetation dynamics.
2.2.2 Data processing
Radar data
Absolute calibration of the ASAR images was carried out, to transform the radar signals (digitized values) into a backscat-tering coefficient (σ◦). All images were geo-referenced us-ing a geo-referenced SPOT/HRV image, resultus-ing in an RMS control point error of about 10 m. The registration error of the ASAR images was taken into account in selecting Areas Of Interest (AOI) within each test field.
SPOT data
The SPOT/HRV images were firstly geo-referenced. Radio-metric and atmospheric corrections were then applied in or-der to estimate the reflectance of the vegetation canopy. Fi-nally, for each image, the Normalized Difference Vegetation Index (NDVI) was estimated. This index, given by the ratio between the difference between the visible and near-infrared channels, and the sum of these two channels, is related to the green vegetation photosynthetic activity (Rouse et al., 1973). 2.3 Ground truth measurements
Ground-truth measurements were carried out over different test fields, simultaneously to different satellite acquisitions. Ten test fields were selected for these measurements, to rep-resent different types of land use: wheat fields (P4 – 2 ha, P6 – 1.5 ha, P7 – 6 ha, P9 – 3 ha and Pst2 – 2 ha), non-irrigated olive groves (P4bis – 6 ha), P10 – 2 ha, P12 – 6 ha), and bare soils (P5 – 2.5 ha). The studied site is characterised by the reduced size of most fields.
2.3.1 Surface moisture
Table 2. Gravimetric volumetric soil moisture measurements (%) over test fields.
Field P4 P4bis P6 P7 P9 P10 P12 Pst2
23 December – 6.26 6.11 7.23 6.3 5.78 5.9 –
16 January 31.65 23.68 16.4 32.04 18.62 17.7 17.56 –
21 January 40.43 36.15 34.77 39.64 33.75 28.34 28.57 –
31 January 28.65 21.17 18.91 29.7 18.07 14.55 18.8 –
6 February 21.38 18.63 18.28 20.67 14.86 12 – 17.56
18 February 15.61 14.97 14.57 16.98 13.2 12.15 11.5 16.35
25 February 14.07 14.1 12.96 15.97 11.5 10.94 8.43 –
[image:4.595.311.545.234.413.2]4 March 20.57 11.2 8.98 24.85 11.75 – – 20
Table 3. Roughness Rms height (cm) measurements.
Field P4 P4bis P6 P7 P9 P10 P12
24 March 0.8 2.5 0.8 0.6 0.7 1.5 1.6
2.3.2 Soil roughness
Roughness measurements were made using a pin profiler (to-tal length of 1 m, and resolution of 2 cm). In order to guar-antee suitable precision in the roughness computations, ap-proximately 10 profiles were recorded for each field. As the surface height profile is considered to be ergodic and station-ary, we can compute the correlation function for each profile (Zribi et al., 1997), and derive two statistical parameters: the rms height (vertical scale of roughness), and the correlation length (l) which represents the horizontal scale over which similar roughness conditions are detected. The rms height values are approximately equal to 0.7 cm for wheat fields, and are generally greater than 1.5 cm for olive groves, as il-lustrated in Table 3.
2.3.3 Vegetation covers
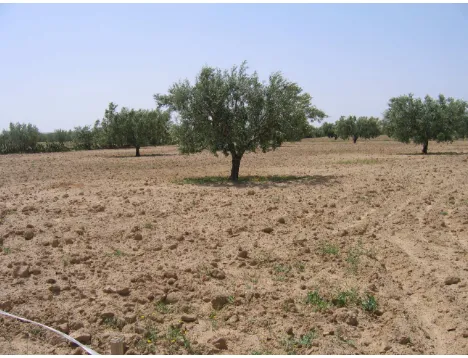
In order to characterise the vegetation covers, we consid-ered three types of measurement. For the non-irrigated olive groves, we measured the distances between trees and the size of the trees in a large number of test fields. Distance between olive trees is of approximately 20 m, and the mean projected surface area of an adult olive tree, is approximately 16 m2 (Fig. 2).
In the case of wheat fields, we implemented two types of measurement:
Leaf Area Index data
The Leaf Area Index (LAI) is defined as the total one-sided area of leaf tissue per unit ground surface area. Accord-ing to this definition, the LAI is a dimensionless quantity
Fig. 2. View of a typical non-irrigated olive tree field.
characterizing the canopy of an ecosystem. During the 2008/2009 agricultural season, the LAI was derived from hemispherical digital photography based on analysis of the canopy gap fraction (Duchemin et al., 2008). These mea-surements were applied to each wheat field, on different days during the vegetation season. Irrigated wheat fields are gen-erally characterised by a higher LAI than non-irrigated wheat fields. Before the end of March, the highest observed LAI was approximately 2. At the end of April we observed the highest vegetation density, with its maximum generally lying in the interval (4–6). Table 4 illustrates measurement values over wheat test fields.
Vegetation water content (VWC) data
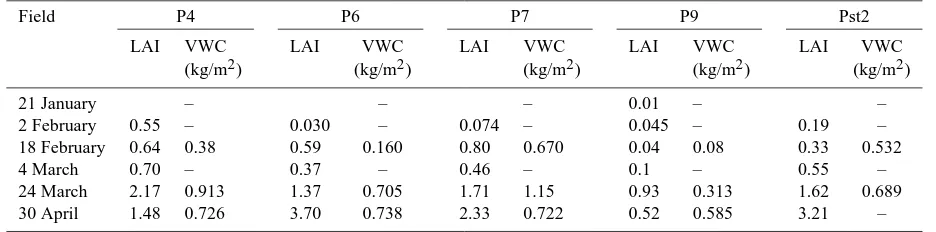
[image:4.595.52.281.261.294.2]Table 4. Leaf Area Index and vegetation water content measurement.
Field P4 P6 P7 P9 Pst2
LAI VWC LAI VWC LAI VWC LAI VWC LAI VWC
(kg/m2) (kg/m2) (kg/m2) (kg/m2) (kg/m2)
21 January – – – 0.01 – –
2 February 0.55 – 0.030 – 0.074 – 0.045 – 0.19 –
18 February 0.64 0.38 0.59 0.160 0.80 0.670 0.04 0.08 0.33 0.532
4 March 0.70 – 0.37 – 0.46 – 0.1 – 0.55 –
24 March 2.17 0.913 1.37 0.705 1.71 1.15 0.93 0.313 1.62 0.689
30 April 1.48 0.726 3.70 0.738 2.33 0.722 0.52 0.585 3.21 –
Land use
Land use validation was carried out in March 2009, with dif-ferent fields being selected from the studied region (more than 150 fields) with two parts, a first one for the identifi-cation of empirical NDVI limits between different types of vegetation classes, and a second one for the validation of our approach to land use classification.
Land use mapping is based on a decision tree, using three types of satellite data: four SPOT images, SRTM data and finally two radar images. We established eight classes of land use: non-irrigated olive trees, irrigated olive trees, ir-rigated winter vegetables, irir-rigated summer vegetables, bare soils, urban areas, mountainous areas, water cover and ar-eas of coastal salt flats “sebkhas”. In the case of vegetables, as previously mentioned, we considered two classes, one for winter and the other for summer. We used empirical NDVI thresholds with the images acquired at the end of Decem-ber 2008 (NDVI>0.4) and during July 2009 (NDVI>0.3). In fact, during these two periods, only irrigated vegetables presented a high NDVI. For the wheat classes (irrigated or non-irrigated), we made our analysis on two different dates, the first at the beginning of the cycle (in December 2008), and the second at the end of the vegetation development pe-riod (April 2009). The distinction between irrigated and non-irrigated wheat is based on a NDVI threshold equal to 0.5, since the irrigated class has a higher NDVI. Irrigated and non-irrigated olive trees are separated using a K-mean ap-proach, based on a single optical SPOT image. The DTM provided by the Shuttle Radar Topography Mission (SRTM, http://srtm.usgs.gov/) allowed certain zones to be eliminated from our land use analysis. We excluded mountainous areas with an altitude greater than 300 m. We also identified water cover and urban classes. Validation of these remotely sensed classifications, based on ground verification over more than 100 fields with different types of land uses, reveals an ac-curacy of around 94%. Figure 3 illustrates the results of our land use mapping for the 2008–2009 season. The non-irrigated olive tree class covers 43% of the studied site, and the wheat class corresponds to 12% of the surface area of the studied site.
Fig. 3. Illustration of land use conditions during the 2008–2009
vegetation season.
3 Methodology of soil moisture estimation
Our approach to soil moisture estimation and mapping is car-ried out on two types of land use: Non-irrigated olive groves and wheat fields, which represent the two most important land use classes.
3.1 Soil moisture estimation over non-irrigated olive groves
Introduction
For the purposes of surface soil moisture estimation, we used the IS1, IS2, IS3 configurations, corresponding to low in-cidence angles of less than 30◦. The aim of this approach
was to limit the influence of vegetation and soil roughness, thereby increasing the accuracy of the moisture estimations.
[image:5.595.308.547.183.411.2]between olive trees of approximately 20 m, and the mean projected surface area of an adult olive tree, i.e. approxi-mately 16 m2, we derive for different incidence angles lower than 30◦ a value between 4% and 10% for vegetation frac-tion. We propose to use the approach proposed by Zribi et al. (2007), detailed in introduction, and applied over disperse vegetation cove. The radar signal could be modelled with a linear relationship between radar signal and moisture, as:
σtotal0 ≈ α (veg) ×Mv +g (Roughness,veg) (1)
Whereαis related to vegetation fraction and to the attenua-tion due to the olive tree characteristics.
gis a function of soil roughness and vegetation cover ef-fects on radar signal.
Mv is volumetric soil moisture.
The inversion process is based on three successive steps: Normalisation of the radar signals to an incidence angle of 20◦
Normalisation of the ASAR data is based on the interpre-tation of radar signal data, for different incidence angles, recorded over large olive tree AOIs. These areas are selected to be in the olive tree class, and only those radar images recorded on very dry dates are considered, in order to elimi-nate noise contributed by soil moisture effects. The angular dependence of backscattering coefficient is modelled with a mathematical function (Baghdadi et al., 2001) written as: σ0 = a cos(θ )b (2) We retrieveb respectively equal to 5.5 and 6.3 for HH and VV polarisation.
Roughness and vegetation effect reduction
In order to limit roughness and vegetation effects, we con-sider a change-detection approach (Wagner et al., 1999; Moran et al., 2000; Zribi et al., 2007). We computed the dif-ference between each raw data image and a redif-ference image taken under dry conditions at the beginning of the vegeta-tion season (21 December 2008), with a moisture content of approximately 5% over the studied site without spatial vari-ations.
In the case of the olive groves, we observed very small variations during the vegetation cycle, due in particular to the olive trees being evergreen. We thus consider, as an initial hypothesis, that the vegetation has an approximately constant effect on the radar signal.
If we now consider a reference image, with a roughnessR1
and moisture content Mv1and a data image with a roughness
Rand moisture content Mv,
1σtotal0 = α (Mv−Mv1) +g (veg, R) −g (veg, R1) (3)
As for surface roughness, the olive groves generally have a tillage corresponding to ploughed soil with an rms height
of around 1.5–3 cm, as shown in ground measurements. Only small variations could be observed after rainfall events. However, the soil is ploughed at different times during the year, which induces low variations on rms heights. For such roughness levels the backscattered radar signals are nearly saturated (Fung, 1994; Zribi et al., 1997). The subtraction of a reference image is therefore sufficient to considerably re-duce the influence of roughness in the observed pixels, even for cases where there are small differences in roughness be-tween the two images. We can thus simplify the above ex-pression to:
1 σtotal0 ≈ α (Mv −Mv1) +ε (4)
Relationship between moisture and processed radar signals
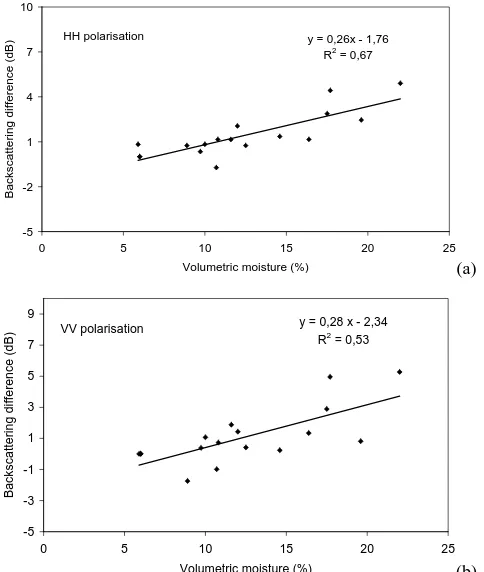
Figure 4 illustrates the linear relationship found between a part of ground surface moisture measurements and radar sig-nals over different test fields. Each point corresponds to a set of two measurements (ground-truth measurement, radar signal) recorded for different test fields. A strong correlation can be seen between the two types of data, for HH and VV polarisations, with a correlation coefficientR2equal to 0.67 and 0.53 respectively. The measured moisture contents range between 5% and 22%.
3.2 Moisture estimation over wheat fields
Introduction
Following an estimation of soil moisture related to precipi-tation effects, carried out over non-irrigated olive groves, we propose a second methodology over wheat fields. Because of limited fields scale (generally lower than 2ha), and high spatial variability of moisture between irrigated and non-irrigated wheat fields, we need to realize moisture estimation in higher spatial resolution.
In this case, the inversion algorithm is based on two steps: Vegetation correction
In order to estimate the soil moisture over fields covered by vegetation, we first need to eliminate the vegetation’s influ-ence on the backscattered radar signal. We propose to use the water-cloud model developed by Attema and Ulab (1978). For an incidence angleθ, the backscatter coefficient is repre-sented in the water cloud model by the expression:
y = 0,26x - 1,76 R2 = 0,67
-5 -2 1 4 7 10
0 5 10 15 20 25
Volumetric moisture (%)
B
a
c
k
s
c
a
tt
e
ri
n
g
d
if
fe
re
n
c
e
(
d
B
) HH polarisation
(a)
y = 0,28 x - 2,34 R2 = 0,53
-5 -3 -1 1 3 5 7 9
0 5 10 15 20 25
Volumetric moisture (%)
B
a
c
k
s
c
a
tt
e
ri
n
g
d
if
fe
re
n
c
e
(
d
B
) VV polarisation
[image:7.595.47.289.63.349.2](b)
Fig. 4. Processed ENVISAT ASAR signals (in decibels) versus
measured volumetric moisture over olive tree fields, (a) HH polar-ization, (b) VV polarization.
wheat scattering (Ulaby et al., 1986). Expression Eq. (5) can thus be simplified to:
σ0 = σcanopy0 +τ2σsoil0 (6)
with
τ2 = exp(−2B .VWC.secθ ) (7) and
σcanopy0 =A .VWC.cosθ1−τ2 (8)
where VWC is the vegetation water content (kg/m2). A and B are parameters which depend on the type of canopy. This formulation represents a first-order solution for the radiative transfer equation through a weak medium, where multiple scattering is neglected.
The database is divided into three sets: the first of these contains measurements acquired just before the vegetation starts to develop: from the end of December until the end of January, the soils are bare with no vegetation cover on the wheat fields. This set is used to estimate the backscattering contribution from bare soil. A second set is used to estimate the parameters of the radiative transfer model (AandB). Fi-nally, a third set is used for model validation.
Relationship between soil moisture and bare soil radar signals
For bare soil backscattering, we consider a simple relation-ship between moisture and radar signal.
σsoil0 (θ ) = β (θ )exp (γ . Mv) (9) Whereβis dependent on roughness and incidence angle, and γ corresponds to the slope of the moisture expressed as a function of the logarithm (dB) of the processed radar signal.
The slopeγ is estimated using the first of the aforemen-tioned database sets.
After sowing, the farmers do not till the soil again before harvesting. Our roughness ground measurements indicated the presence of smooth soils with an rms height approxi-mately between 0.6 and 0.8 cm. It is reasonable to assume that for some wheat fields roughness could have a small de-crease throughout our period of inversion. IEM simulations show approximately a 2 dB decrease of backscattering co-efficient, at low incidence angles, for surfaces with a rms height going from 0.8 cm to 0.6 cm (Zribi and Dechambre, 2002). Our hypothesis of a constant mean β value for all wheat fields during period of inversion could then introduce a supplementary maximum error in volumetric moisture es-timation of about 3% due to±1 dB error in roughness effect.
4 Results and discussions of soil moisture estimation
4.1 Moisture estimation over olive trees
Validation of the proposed algorithm
0 5 10 15 20 25 30
0 5 10 15 20 25 30
Ground measurements (%)
E s ti m a te d v o lu m e tr ic m o is tu re ( % )
Rmse = 3.8% HH polarisation (a) 0 5 10 15 20 25 30
0 5 10 15 20 25 30
Ground measurements (%)
E s ti m a te d v o lu m e tr ic m o is tu re ( % )
Rmse = 4% VV polarisation
[image:8.595.48.287.63.348.2](b)
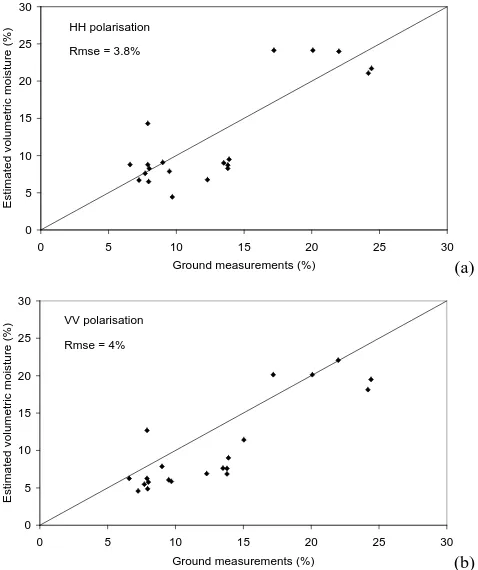
Fig. 5. Soil moisture estimations from ENVISAT ASAR data,
ex-pressed as a function of the soil moisture derived from ground-truth measurements, for fields in the “olive tree” class of land use, (a) HH polarisation, (b) VV polarisation.
Mapping of soil moisture
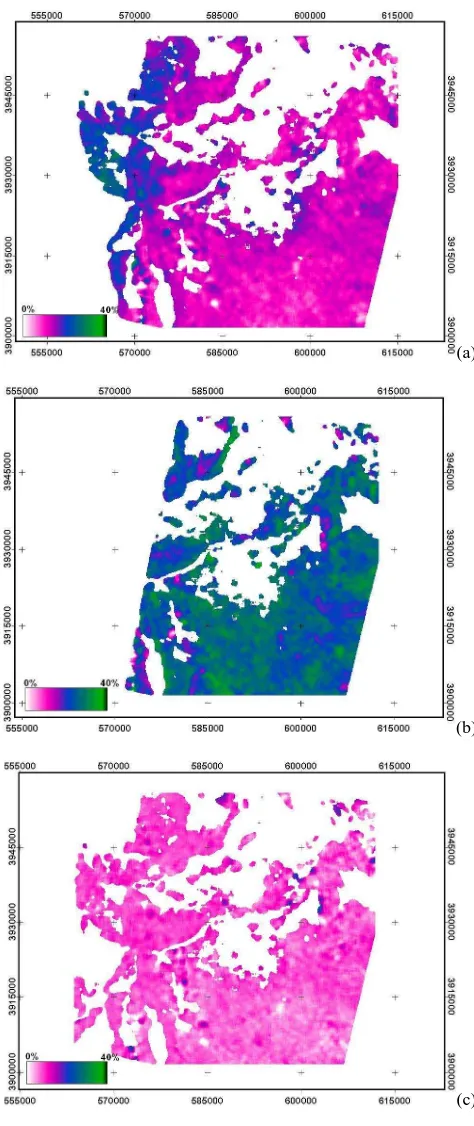
In order to eliminate the effects of local terrain geneities (due to soil texture, vegetation dispersion hetero-geneity, discontinuities between fields, etc) in the processed radar signal, the soil moisture was estimated over large cells defined by 100×100 pixel areas (about 1 km2). For each resulting cell, the soil moisture estimation is applied only if more than 25% of the cell’s pixels belong to olive groves. The value of the computed moisture can be then considered to be representative of the whole cell. To validate these es-timations, the ground-truth measurements taken within the same cell are averaged. When the inversion is applied to the HH and VV radar signals, we observe similar results for both polarisations. In order to increase the precision of our esti-mations, we took the mean value of the two polarisations as the final result in the mapping process. In Fig. 7, soil mois-ture maps are shown for three different dates. These maps are directly related to the temporal and spatial variability of the precipitation over this region. For example, on date 9 De-cember 2009, dry soil is observed over the full studied site, with a low moisture content of around 10%. Indeed, no rain-fall was recorded during the 15 days preceding the acquisi-tion of this satellite image. In the case of the image taken
0 5 10 15 20 25 30
0 5 10 15 20 25 30
Estimated moisture with HH signal (%)
E s ti m a te d m o is tu re w it h V V s ig n a l (% ) Rmse=2% Bais=1.6%
Fig. 6. Inter-comparison between HH and VV radar signal moisture
estimations.
on 11 April 2009, strong spatial variability of the surface moisture can be observed. In fact, a rainfall event arriving from the West occurred during the afternoon of 11 April. In the Eastern part of this image, the soil moisture remained low. The third image in this figure provides the moisture map produced one day later, on 12 April, showing gener-alised rainfall throughout the studied site, associated with a global increase in soil moisture with a mean value of around 25%. Our approach allows the moisture to be estimated over approximately 50% of the studied site. It is presented partic-ularly in the South East, where irrigated agriculture is absent. The interest of the choice of this class of land use is evident, since the computed moisture has only a small sensitivity to roughness and vegetation, both of which are affected by very limited changes from one year to another. This type of algo-rithm can thus be applied each year, with no need for it to be adapted to variations in local conditions.
4.2 Moisture estimation over wheat fields
Validation of moisture estimation
Validation of the proposed algorithm is based on com-parisons between ground-truth measurements made in test wheat fields (P4, P6, P7, P9, Pst2) characterised by different soil moistures, ranging between dry and wet conditions and different vegetation development states, and estimations de-rived from ENVISAT ASAR radar signal acquisitions, made in 2009 and 2010. The results are illustrated in Fig. 8. We observe more validation points in HH polarisation because of the use of one ASAR image with just this configuration.
[image:8.595.308.545.64.205.2](a)
(b)
(c)
Fig. 7. Illustration of moisture mapping for an area containing
fields in the “olive tree” class of land use, (a) 11 April 2009,
(b) 12 April 2009, (c) 9 December 2009.
0 10 20 30 40
0 5 10 15 20 25 30 35 40 45
Ground measurements (%)
E
s
ti
m
a
te
d
v
o
lu
m
e
tr
ic
m
o
is
tu
re
s
(
%
)
RMSE = 5.3%
Polarisation HH
0 10 20 30 40
0 5 10 15 20 25 30 35 40 45
Ground measurements (%)
E
s
ti
m
a
te
d
v
o
lu
m
e
tr
ic
m
o
is
tu
re
(
%
) Polarisation VV
[image:9.595.312.541.63.346.2]RMSE = 6.4 %
Fig. 8. Soil moisture estimations from ENVISAT ASAR data,
ver-sus soil moisture derived from ground truth measurements, for dif-ferent test wheat fields.
possible that our ground-truth measurements were affected by irrigation which commenced during the satellite measure-ments. Finally, as discussed in the last section, the hypothesis of a constant roughness effect could increase the rms error. Mapping of soil moisture over wheat fields
For the studied site, application of the inversion algorithm requires some information related to the vegetation’s water content. For this reason, we developed an approach based on the interpretation of SPOT satellite optical measurements, linking VWC to LAI and then to NDVI index estimations.
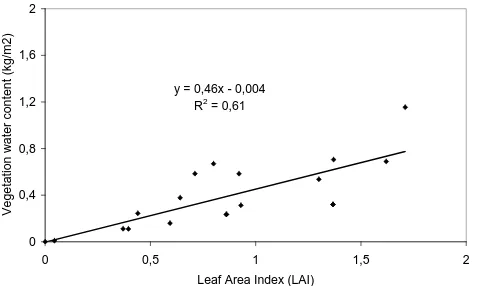
Figure 9 illustrates the relationship between measurements of water content and LAI over different test fields. We ob-serve a good correlation between the two variables, withR2 equal to 0.61. Therefore, knowledge of the LAI values can be used to estimate the vegetation’s water content (VWC), using the following equation:
VWC = 0.46 LAI−0.004 (10)
[image:9.595.47.284.88.651.2]y = 0,46x - 0,004 R2 = 0,61
0 0,4 0,8 1,2 1,6 2
0 0,5 1 1,5 2
Leaf Area Index (LAI)
V
e
g
e
ta
ti
o
n
w
a
te
r
c
o
n
te
n
t
(k
g
/m
2
[image:10.595.49.289.62.205.2])
Fig. 9. Vegetation water content as a function of Leaf Area Index
measured over wheat fields.
This expression is:
NDVI = NDVI∞+(NDVIsoil−NDVI∞)×e−kLAI (11)
with NDVI∞= 0.75, NDVIsoil= 0.15 andk=−1.24.
For LAI<2, we observe an increase in the LAI with NDVI indices. For higher values of LAI, the estimation be-comes more complex, with saturation of the NDVI values resulting in reduced accuracy for the LAI estimations. In or-der to make reliable estimations of the vegetation moisture content, allowing accurate vegetation corrections, we ran the inversions only for the period between January and March, for which the LAI were still not high (lower than about 1.5). The expressions for water content estimation could then be applied with good accuracy. In the case of dense vegetation cover, it is very difficult to retrieve the soil moisture with sufficient precision. This is also an intrinsic limitation of the use of C-band SAR data, since the radar signal is strongly attenuated by the vegetation.
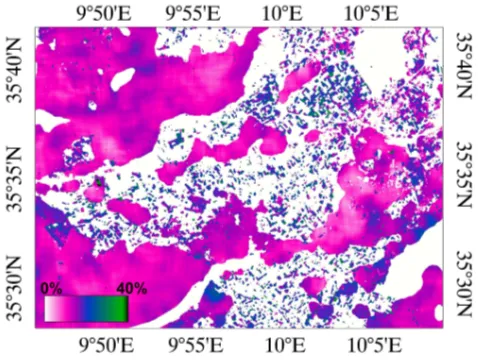
Our process thus involves, firstly NDVI mapping from SPOT satellite images, from which the LAI and then vege-tation water content are deduced over wheat fields. Finally, after applying corrections for the influence of vegetation, we derive the soil moisture. All pixels in the wheat class of land use are considered to be valid candidates for soil moisture es-timations. However, a radar signal from a minimum number of neighbouring pixels is required to avoid adding speckle noise to the results. We thus considered 5×5 pixel windows (about 0.4 ha) for the computation of effective radar signals in the wheat class, which were then used to estimate the soil moisture. Figure 10 illustrates the resulting soil moisture maps, computed over wheat fields at different dates. For wet days corresponding to rainfall events, such as that of 16 Jan-uary 2009, a high soil moisture value can be observed for all wheat fields. For dry dates such as 7 March 2009, we observe different moisture values. Increasing moisture values can be observed over irrigated fields. On 24 December 2008 date, non-irrigated wheat fields are found to have soil moisture of approximately 6%. For irrigated wheat fields, the values are
(a)
(b)
[image:10.595.307.546.85.639.2](c)
Fig. 10. Example of moisture mapping over wheat fields on three different dates: (a) 16 January 2009, (b) 20 Feburary 2009,
generally higher; even very high moistures (around 40%) can be observed in some cases. The variability of these moisture observations is in complete agreement with the land use clas-sification, distinguished by two classes, i.e. non-irrigated and irrigated wheat. This type of mapping process, if enhanced by means of high temporal monitoring, could become a very useful tool for the regional analysis of irrigation and water consumption, particularly in semi-arid areas with limited wa-ter resources.
4.3 Final moisture mapping
Figure 11 provides an illustration of our mapping process in a small area of our studied region, in 7 March 2009, in which moisture map computed for non irrigated olive groves and wheat fields are combined. Differences in moisture level can be observed between the two classes. The mean moisture level in the olive groves is approximately equal to 10%, as opposed to 15% for the wheat class fields. This difference is not due to irrigation alone, but also to differences in soil tex-ture (for wheat fields – 45% clay, 26% silt and 39% sand, for olive groves – 29% clay, 8% silt, and 63% sand). With sandy soil, surface moisture decreases more rapidly after rainfall events.
5 Soil evaporation evaluation
5.1 Proposed methodology
As discussed in the introduction, the estimation of soil evap-oration is essential in arid and semi-arid regions. In fact, for agriculture with a low density of vegetation cover, the contri-bution from soil evaporation is significant, particularly after rainfall events. An accurate estimation of this term thus al-lows a reliable estimation to be made of the stock of water available for use by the vegetation. In this section, we pro-pose a simple approach for the estimation of soil evaporation. Simonneaux et al. (2009) have proposed an integrating of the soil evaporation into a semi-empirical FAO evapotranspi-ration model (Allen et al., 2000), with a soil model repre-sented with three layers: surface layer, root zone layer and a deeper layer. They consider the evaporation to be equal to ETP if surface layer is saturated. In this paper, we pro-pose a simple approach for relating the soil evaporation to surface soil moisture (0–5 cm) estimated from radar satellite measurements. The soil evaporation can be written as: Es =
Mv −Mvi
Mvs −Mvi
.ETP (12)
[image:11.595.308.547.62.242.2]where Es is the soil evaporation, and ETP is the potential evaporation, which depends on climate demand and can be estimated using the FAO Penman-Monteith equation (Allen et al., 1998).
Fig. 11. Example of moisture mapping, showing soil moisture
es-timations for fields in the “olive tree” and “wheat” classes of land use on 7 March 2009.
Mviis the minimum soil surface moisture, as measured on
the site. This is estimated from continuous ground thetaprobe measurements, acquired over a period of two years.
Mvs is the soil saturation moisture. It is also estimated
from continuous and spot ground measurements, acquired over a period of two years.
The soil evaporation is assumed to be at its maximum for saturated soils, with a value equal to the ETP. It is close to zero for very dry surfaces.
5.2 Application
In this section, we propose to generate a map of the soil evap-oration, using retrieved soil moisture maps based on the in-version of ASAR/ENVISAT and ETP data acquired over the studied site.
Figure 12 illustrates the ETP variations during the 2008– 2009 season, in which we observe a maximum during the summer season, with values of approximately 15 mm. The soil evaporation is however very low in this season, as a re-sult of an absence of rainfall events, with surface soil mois-ture levels generally close to 0%. During the rainy season, as shown in Fig. 12, we observe a small number of rainfall events, followed by an increase in soil moisture. Thetaprobe continuous measurements show a drying process of the soil moisture lasting many days.
In the case of olive trees, we apply Expression Eq. (12) to each pixel of the moisture maps, without taking the veg-etation cover fraction into account. In fact, soil evaporation takes place even directly beneath the olive trees. An Mvs
value of 28% is estimated for olive areas.
Fig. 12. Illustration of potential evapotransipration, calculated
us-ing Pennaman Monteith equation, durus-ing the agricultural season 2008–2009.
SPOT vegetation data. We apply the relationship proposed by Er-Raki et al. (2007) over wheat fields in semi-arid areas. The soil evaporation can then be written as:
Es = (1 −Fc)
Mv −Mvi
Mvs − Mvi
.ETP (13) Mvsvalue of 37% is estimated for wheat fields.
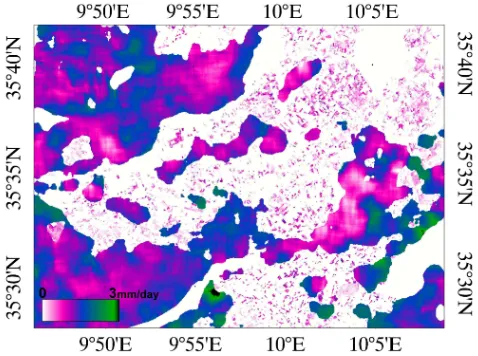
Figure 13 provides an example of soil evaporation map-ping, on 7 March 2009. Particularly highest evaporation val-ues can be observed over the olive fields without vegetation cover. The mean soil moisture over the olive groves is proximately 12%, and the soil evaporation is therefore ap-proximately equal to 1.2 mm/day.
6 Conclusions
The objective of this paper was to propose a simple ap-proach to evaluate soil evaporation using soil moisture re-trievals from SAR radar measurements. Numerous studies have been published on the topic of soil moisture estima-tion over bare soil, or over land with one type of vegetaestima-tion. The present study describes an approach for the mapping of soil moisture over two types of vegetation cover. The first of these concerns the “non-irrigated olive tree” land use class, dependent on rainfall events. A relationship is established between ground-truth measurements and backscattered radar signals. The proposed inversion approach is based on three main steps:
– Normalisation of the ENVISAT ASAR data to one inci-dence angle.
– Reduction of roughness effects through the subtraction of a reference image corresponding to a dry day. – Implementation of an empirical relationship, enabling
the soil moisture to be derived from the processed radar signals.
Fig. 13. Example of soil evaporation mapping over olive tree and
wheat classes of land use on 7 March 2009.
The validation of this approach has been demonstrated to have good accuracy in terms of moisture estimation. Mois-ture mapping using this process is shown for several dates, revealing various temporal and spatial variations, linked only to rainfall events. This estimation is proposed at a cell resolu-tion of 100×100 pixels. The approach developed for fields in the non-irrigated olive tree class (about 43% of used land) allows nearly all areas of the studied region to be covered, from which a quantitative and precise estimation of the spa-tial variability of soil moisture can de derived.
A second type of moisture estimation is proposed over wheat fields. The principal objective of this estimation is to identify a relationship between moisture variability and irri-gation in the studied region. The methodology developed for this application is based on two steps:
– Correction for vegetation effects using a simple first-order radiative transfer model. This correction is based on the relationships established between vege-tation water content and optical satellite measurements (SPOT/HRV data).
– Determination of a linear relationship between ground moisture measurements and processed bare soil radar signals.
Good agreement is found between the inversion results and the ground-truth measurements, with a mean rms error of about 5.8%. Moisture mapping over wheat fields allows those fields that are irrigated, and thus characterised by gen-erally higher moisture values, to be clearly identified, partic-ularly during dry periods.
[image:12.595.48.289.63.209.2]high repetition rate, it would make it possible to quantify the water stock available for the vegetation in rain-fed agricul-ture, characterised by a dominant non-covered surface, par-ticularly during frequent periods of drought. In addition to the vegetation transpiration estimation, it would also allow the wheat fields’ irrigation requirements to be monitored. Using ASAR/ENVISAT data, we can propose approximately one to two such estimations per week. With the arrival of new sensors, the SENTINEL-1 and RADARSAT constella-tions in particular, it will be possible to propose nearly daily estimations of soil evaporation which allows a high potential of surface moisture assimilation on land surface models. Acknowledgements. This study was funded by two programs:
the PNTS (French National Remote Sensing Program), and the AUF (Agence Universitaire de la Francophonie) and Institut de Recherche pour le D’eveloppement. The authors wish to thank ESA (European Space Agency) and ISIS program for kindly providing ASAR/ENVISAT and SPOT images. ASAR images were obtained 5 under proposal C1.P 5962. We would like also to thank CTV Chbika, the cereal institute, and the CRDA for their assistance with the ground-truth measurements. We also thank all of the technical 5 teams of the IRD and the INAT for their strong collabo-ration and support in implementing the ground-truth measurements.
Edited by: W. Wagner
The publication of this article is financed by CNRS-INSU.
References
Allen, R. G.: Using the FAO-56 dual crop coefficient method over an irrigated region as part of an evapotranspiration intercompar-ison study, J. Hydrol., 229, 27–41, 2000.
Allen, R. G., Pereira, L. S., Raes, D., and Smith, M.: Crop Evapotranspiration-Guidelines for Computing Crop Water Re-quirements, Irrigation and Drain, Paper No. 56, FAO, Rome, Italy, 300 pp., 1998.
Attema, E. P. W. and Ulaby, F. T.: Vegetation modeled as a water cloud, Radio Sci., 13, 357–364, 1978.
Baghdadi, N., Bernier, M., Gauthier, R., and Neeson, I.: Evaluation of C-band SAR data for wetlands mapping, Int. J. Remote Sens., 22(1), 71–88, 2001.
Baghdadi, N., Holah, N., and Zribi, M.: Soil moisture estimation using multi-incidence and multi-polarization ASAR SAR data, Int. J. Remote Sens., 27(8), 1907–1920, 2006.
Baghdadi, N., Aubert, M., Cerdan, O., Franchist’eguy, L., Viel, C., Martin, E., Zribi, M., and Desprats, J. F.: Operational mapping of soil moisture using synthetic aperture radar data: application to Touch basin (France), Sensors J., 7, 2458–2483, 2007.
Bastiaanssen, W. G. M., Molden, D. J., and Makin, I. W.: Remote sensing for irrigated agriculture: examples from research and possible applications, Agr. Water Manage., 46, 137–155, 2000. Baup, F., Mougin, E., De Rosnay, P., Timouk, F., and Chˆenerie,
I.: Surface soil moisture estimation over the AMMA Sahelian site in Mali using ENVISAT/ASAR data, Remote Sens. Environ., 109(4), 473–481, 2007.
Bernard, R., Soares, J. V., and Vidal Madjar, D.: Differential bare field drainage properties from airborne microwave observations, Water Resour. Res., 22, 869–875, 1986.
Beven, K. J. and Fisher, J.: Remote Sensing and Scaling in Hydrol-ogy, in: Scaling in Hydrology Using Remote Sensing, edited by: Stewart, J. B., Engman, E. T., Feddes, A., and Kerr, Y., Wiley, New York, 93–111, 1996.
Bindlish, R. and Barros, A. P.: Parameterization of vegetation backscatter in radar-based soil moisture estimation, Remote Sens. Environ., 76, 130–137, 2001.
Chanzy, A.: Mod´elisation simplifi´ee de l’´evaporation du sol nu utilisant l’humidit´e et la temp´erature de surface accessibles par t´el´ed´etection, Th`ese de doctorat, p. 208, 1991.
Chanzy, A. and Bruckler, L.: Significance of soil surface moisture with respect to daily bare soil evaporation, Water Resour. Res., 29(4), 1113–1125, 1993.
Dubois, P. C., Van Zyl, J., and Engman, T.: Measuring soil moisture with imaging radars, IEEE T. Geosci. Remote, 33(4), 915–926, 1995.
Duchemin, B., Maisongrande, P., Boulet, G., and Benhadj, I.: A simple algorithm for yield estimates: Evaluation for semi-arid irrigated winter wheat monitored with green leaf area index, En-viron. Modell. Softw., 23, 876–892, 2008.
Engman, E. T.: Applications of microwave remote sensing of soil moisture for water resources and agriculture, Remote Sens. Env-iron., 35(2–3), 213–226, 1991.
Er-Raki, S., Chehbouni, A., Guemouria, N., Duchemin, B., Ezza-har, J., and Hadria, R.: Combining FAO-56 model and ground-based remote sensing to estimate water consumptions of wheat crops in a semi-arid region, Agr. Water Manage., 87, 41–54, 2007.
Fung, A. K., Li, Z., and Chen, K. S.: Backscattering from a ran-domly rough dielectric surface, IEEE T. Geosci. Remote, 30(2), 356–369, 1992.
Fung, A. K.: Microwave scattering and emission models and their applications, Artech House, Boston, MA, 1994.
Jackson, T.-J., Schmugge, J., and Engman, E.-T.: Remote sens-ing applications to hydrology: soil moisture, Hydrol. Sci., 41(4), 517–530, 1996.
Koster, R. D., Dirmeyer, P. A., Guo, Z., Bonan, G., Chan, E., Cox, P., Gordon, C. T., Kanae, S., Kowalczyk, E., Lawrence, D., Liu, P., Lu, C. H., Malyshev, S., McAvaney, B., Mitchell, K., Mocko, D., Oki, T., Oleson, K., Pitman, A., Sud, Y. C., Taylor, C. M., Verseghy, D., Vasic, R., Xue, Y., and Yamada, T.: Regions of Strong Coupling Between Soil Moisture and Precipitation, Sci-ence, 305, 1138–1140, doi:10.1126/science.1100217, 2004. Le H´egarat-Mascle, S., Zribi, M., Alem, F., Weisse, A., and
Leduc, C., Ben Ammar, S., Favreau, G., B’eji, R., Virrion, R., La-combe, G., Tarhouni, J., Aouadi, C., Zenati Chelli, B., Jebnoun, N. O. M., Michelot, J. L., and Zouari, K.: Impacts of hydrologi-cal changes in the Mediterranean zone: environmental modifica-tions and rural development in the Merguellil catchment, central Tunisia, Hydrolog. Sci. J., 52(6), 1162–1178, 2007.
Magagi, R. D. and Kerr, Y. H.: Retrieval of soil moisture and veg-etation characteristics by use of ERS-1 wind scatterometer over arid and semi-arid areas, J. Hydrol., 188–189, 361–384, 1997. Mahfouf, J. F. and Noilhan, J.: Comparative study of various
formu-lations of evaporation from bare soil using in-situ data, J. Appl. Meteorol, 30(7), 1354–1365, 1991.
Moran, M. S., Hymer, D. C., Qi, J., and Sano, E. E.: Soil moisture evaluation using multitemporal synthetic aperture radar (SAR) in semiarid rangeland, Agr. Forest Meteorol., 105, 69–80, 2000. Oh, Y., Sarabandi, K., and Ulaby, F. T.: An empirical model and an
inversion technique for radar scattering from bare soil surfaces, IEEE T. Geosci. Remote, 30(2), 370–381, 1992.
Paris, A. T., Zribi, M., Baghdadi, N., and Loumagne, C.: Analysis of local variation of soil surface parameters with TerraSAR-X radar data over bare agricultural fields, IEEE T. Geosci. Remote, 48(2), 874–881, 2010.
Quesney, A., Le H’egarat-Mascle, S., Taconet, O., Vidal-Madjar, D., Wigneron, J. P., Loumagne, C., and Normand, M.: Estima-tion of watershed soil moisture index from ERS/SAR data, Re-mote Sens. Environ., 72, 290–303, 2000.
Rahman, M. M., Moran, M. S., Thoma, D. P., Bryant, R., Holifield-Collins, C. D., Jackson, T., Orr, B. J., and Tischler, M.: Mapping surface roughness and soil moisture using multi-angle radar im-agery without ancillary data, Remote Sens. Environ., 112, 391– 402, 2008.
Rosich, B.: ASAR Validation Review, ESRIN, Frescatti, 11–12 De-cember, 2002.
Rouse, J. W., Haas, R. H., Schell, J. A., and Deering, D. W.: Mon-itoring vegetation systems in the great plains with ERTS, Third ERTS Symposium, NASA SP-351 I, 309–317, 1973.
Saux-Picart, S., Ottl´e, C., Perrier, A., Decharme, B., Coudert, B., Zribi, M., Boulain, N., Cappelaere, B., and Ramier, D.: SEtHyS Savannah: a multiple source land surface model applied to sahelian landscapes, Agr. Forest Meteorol., 149(9), 1421– 1432, 2009.
Simonneaux, V., Duchemin, B., Helson, D., ER-Raki, S., Olioso, A., and Chehbouni, A. G.: The use of high-resolution image time series for crop classification and evapotranspiration estimate over an irrigated area in central Morocco, Int. J. Remote Sens., 29(1– 2), 95–116, doi:10.1080/01431160701250390, 2007.
Simonneaux, V., Lepage, M., Helson, D., Metral, J., Thomas, S., Duchemin, B., Cherkaoui, M., Kharrou, H., Berjami, B., and Chehbouni, A.: Estimation spatialis´ee de l’´evapotranspiration des cultures irrigu´ees par t´el´ed´etection : application `a la ges-tion de l’irrigages-tion dans la plaine du Haouz (Marrakech, Maroc), S´echeresse, 20(1), 123–130, 2009.
Thoma, D. P., Moran, M. S., Bryant, R., Rahman, M. M., Holifield Collins, C. D., Keefer, T. O., Noriega, R., Osman, I., Skrivin, S. M., Tischler, M. A., Bosch, D. D., Starks, P. J., and Peters-Lidard, C. D.: Appropriate scale of soil moisture retrieval from high resolution radar imagery for bare and minimally vegetated soils, Remote Sens. Environ., 112(2), 403–414, 2008.
Ulaby, F. T., Moore, R. K., and Fung, A. K.: Microwave Re-mote Sensing Active and Passive, Artech House, Inc., Addison-Wesley, Reading, MA, 1986.
Ulaby, F. T., Dubois, P. C., and van Zyl, J.: Radar mapping of sur-face soil moisture, J. Hydrol., 184(1/2), 57–84, 1996.
Wagner, W., Lemoine, G., and Rott, H.: A method for estimat-ing soil moisture from ERS Scatterometer and soil data, Remote Sens. Environ., 70, 191–207, 1999.
Wagner, W., Bloschl, G., Pampaloni, P., Calvet, J.-C., Bizzarri, B., Wigneron, J.-P., and Kerr, Y.: Operational readiness of mi-crowave remote sensing of soil moisture for hydrologic applica-tions, Nord. Hydrol., 38, 1–20, 2007.
Wigneron, J. P., Ferrazzoli, P., Olioso, A., Bertuzzi, P., and Chanzy, A.: A Simple Approach To Monitor Crop Biomass from C-Band Radar Data, Remote Sens. Environ., 69(2), 179–188, 1999. Zribi, M. and Dechambre, M.: A new empirical model to retrieve
soil moisture and roughness from Radar Data, Remote Sens. En-viron., 84(1), 42–52, 2002.
Zribi, M., Taconet, O., Le H´egarat-Mascle, S., Vidal-Madjar, D., Emblanch, C., Loumagne, C., and Normand, M.: Backscat-tering behavior and simulation comparison over bare soils us-ing SIRC/XSAR and ERASME 1994 data over Orgeva, Remote Sens. Environ., 59(2), 256–266, 1997.