Georgia State University Georgia State University
ScholarWorks @ Georgia State University
ScholarWorks @ Georgia State University
Business Administration Dissertations Programs in Business Administration
Summer 8-1-2012
Is Your Brand Going Out of Fashion? A Quantitative, Causal Study
Is Your Brand Going Out of Fashion? A Quantitative, Causal Study
Designed to Harness the Web for Early Indicators of Brand Value
Designed to Harness the Web for Early Indicators of Brand Value
Maureen S. ColeGeorgia State University
Follow this and additional works at: https://scholarworks.gsu.edu/bus_admin_diss
Recommended Citation Recommended Citation
Cole, Maureen S., "Is Your Brand Going Out of Fashion? A Quantitative, Causal Study Designed to Harness the Web for Early Indicators of Brand Value." Dissertation, Georgia State University, 2012.
https://scholarworks.gsu.edu/bus_admin_diss/13
PERMISSION TO BORROW
In presenting this dissertation as a partial fulfillment of the requirements for an advanced
degree from Georgia State University, I agree that the Library of the University shall
make it available for inspection and circulation in accordance with its regulations
governing materials of this type. I agree that permission to quote from, to copy from, or
publish this dissertation may be granted by the author or, in his/her absence, the professor
under whose direction it was written or, in his absence, by the Dean of the Robinson
College of Business. Such quoting, copying, or publishing must be solely for the
scholarly purposes and does not involve potential financial gain. It is understood that any
copying from or publication of this dissertation which involves potential gain will not be
allowed without written permission of the author.
NOTICE TO BORROWERS
All dissertations deposited in the Georgia State University Library must be used only in accordance with the stipulations prescribed by the author in the preceding statement.
The author of this dissertation is:
Maureen Schumacher Cole Google, Inc
Atlanta, GA 30309
[email protected] [email protected]
The director of this dissertation is:
V Kumar, Ph.D.
Richard and Susan Lenny Distinguished Chair Professor of Marketing,
Executive Director, Center for Excellence in Brand & Customer Management, and Director of the Ph.D. Program in Marketing
J. Mack Robinson College of Business Georgia State University
Is Your Brand Going Out of Fashion?
A Quantitative, Causal Study Designed to Harness the Web for Early
Indicators of Brand Value
BY
Maureen Schumacher Cole
A Dissertation Submitted in Partial Fulfillment of the Requirements for the Degree Of
Doctor of Philosophy
In the Robinson College of Business Of
Copyright by Maureen Schumacher Cole
ACCEPTANCE
This dissertation was prepared under the direction of the Maureen Schumacher’s
Dissertation Committee. It has been approved and accepted by all members of that
committee, and it has been accepted in partial fulfillment of the requirements for the
degree of Doctoral of Philosophy in Business Administration in the J. Mack Robinson
College of Business of Georgia State University.
H. Fenwick Huss, Dean
DISSERTATION COMMITTEE
V. Kumar, Ph.D. (Chair) Nita Umashankar, Ph.D.
Table of Contents
ABSTRACT ... 1
Chapter 1: INTRODUCTION ... 2
Chapter 2: LITERATURE REVIEW ... 10
Research Domain ... 12
Chapter 3: THEORETICAL FRAMEWORK ... 15
Customer Information-‐Processing Model ... 15
Interaction With a Search Engine ... 18
Chapter 4: CONCEPTUAL MODEL ... 20
Brand Value ... 22
Customer-‐Based Variables ... 23
1. CUSTOMER ACTION ... 24
2. CUSTOMER VALUE ... 24
Financial Variables ... 29
1. MARKETING ACTION ... 29
2. BRAND HISTORY ... 29
3. FIRMOGRAPHICS ... 30
4. CONTROL VARIABLES ... 31
Chapter 5: METHODOLOGY ... 34
Database Overview ... 34
Predictor Variables ... 34
Chapter 6: ANALYSIS ... 39
Chapter 7: CONTRIBUTION, LIMITATIONS AND FUTURE RESEARCH ... 49
Contribution ... 49
Limitations and Future Research Direction ... 50
Appendix ... 52
Bibliography ... 53
[image:7.612.73.504.172.587.2]
Figures and Tables
FIGURE 1: APPLE, COCA COLA, AND GE ... 5
FIGURE 2: MOTOROLA, RAZR, AND KRISPY KREME ... 8
FIGURE 3: CONSUMER INFORMATION-‐PROCESSING ... 16
FIGURE 4: INTERACTION WITH A SEARCH ENGINE ... 19
FIGURE 5: CONCEPTUAL MODEL ... 22
FIGURE 6: DECISION-‐MAKING FLOW CHART ... 39
FIGURE 7: REVISED CONCEPTUAL MODEL ... 44
FIGURE 1: APPLE, COCA COLA, AND GE ... 5
FIGURE 2: MOTOROLA, RAZR, AND KRISPY KREME ... 8
FIGURE 3: CONSUMER INFORMATION-‐PROCESSING ... 16
FIGURE 4: INTERACTION WITH A SEARCH ENGINE ... 19
FIGURE 5: CONCEPTUAL MODEL ... 22
FIGURE 6: DECISION-‐MAKING FLOW CHART ... 39
ABSTRACT
Can Internet search query data be a relevant predictor of financial measures of brand value? Can
Internet search query data enrich existing financial measures of brand valuation tools and
provide more timely insights to brand managers? Along with the financial based motivation to
estimate the value of a brand for accounting purposes, marketers desire to show “accountability”
of marketing activity and respond to the customer’s perception of the brand quickly to maintain
their competitive advantage and value. The usefulness of the “consumer information processing”
framework for brand, consumer and firm forecasting is examined. To develop our hypotheses,
we draw from the growing body of work relating web searches to real world outcomes, to
determine if a search query for a brand is causal to, and potentially predictive of brand, consumer
and firm value. The contribution to current literature is that search queries can predict
perception, whereas previous research in this nascent area predicted behavior and events. In this
direction, we propose arguments underpinning this research as follows: the theoretical
background relative to brand valuation and the theoretical frame based on an in-depth review of
how scholars have used search query data as a predictive measure across several disciplines
including economics and the health sciences. From a practitioner perspective, unlike traditional
Chapter 1: INTRODUCTION
Can Internet search query data be a relevant predictor of financial measures of brand value? Can
Internet search query data enrich existing financial measures of brand valuation tools and
provide more timely insights to brand managers?
The concept of brand value first emerged in the marketing literature in the late 1980s. The use of
a financial term for what was a consumer-based construct was a highly effective technique to
communicate the idea that brands are long-lived business assets that can have significant
financial value. As a result, there was increased interest in the boardroom in the value of brands;
leading to the disclosure of the value of acquired brands on the balance sheet (Hull, 2008).
Brand valuation plays an important role in business practice for three distinct reasons. First,
firms are financially motivated to estimate the value of a brand for accounting purposes (Keller,
1993). Second, marketers can show “accountability” for marketing activity and report results
using the language of finance (Salinas and Ambler, 2009). Third, the value of a brand name is
closely associated with the customer’s satisfaction, awareness, and perception of the quality of
the product (Aaker, 1991).
Brand value has typically been measured from either a financial market analysis or a
consumer-demand-driver analysis of the brand. Methodologies, like suppliers, have proliferated. In 2009,
were many others.
In general, Salinas and Ambler (2009) categorized suppliers of brand valuation methods as
technical or brand management providers. Technical providers define the financial market value
of the brand at arm’s length between the buyer and seller. Brand Finance is an example of a
technical provider using royalty relief, a method that tends to be the choice among this sector.
Brand Finance describes royalty relief as the application of an appropriate royalty rate to
an estimate of likely future sales which leads to the
income attributable to brand royalties in future years.The stream of brand royalty is discounted
back to a net present value—the brand value (Brandfinance, 2011). The variables to arrive at the
income attributable to brand royalties take into account market data, including quantitative
consumer research, insights into competitors, and forecasted brand earnings. Brand Finance is
well known for its annual release of a league table of the most valuable brands based on their
financial strength (Brand Finance, 2011). The release of the annual league table is in March of
the following year.
Brand management providers prefer demand-driver analysis designed to improve marketing
effectiveness and accountability. Demand-driver analysis applies an economic use approach to
brand valuation using valuation methodology similar to that employed by analysts and
accountants. This approach is focused on the intrinsic value of the brand determined by its ability
to generate demand. The actual value of the brand is the sum of the future earnings that brand is
annual league table of the top 100 most valuable global brands. This ranking focuses on
consumer-facing brands and, like other rankings, includes customer brand perception metrics in
its valuation methodologies. Consumer perceptions are typically gathered over the course of the
year through interviews and surveys and incorporated into the final value. The release of the
actual valuation or annual league table is in April or May of the following year.
To illustrate the variations between providers, Salinas and Ambler (2009) compared brand
valuations published in 2005 for Toyota, Samsung, and Apple across three brand management
providers: Interbrand, Millward Brown Optimer, and Vivaldi Partners. The findings varied by a
factor of two or more. Likewise, Knowles (2008) compared valuations for eight well-known
brands across three providers, Interbrand, Millward Brown, and Brand Finance, again with wide
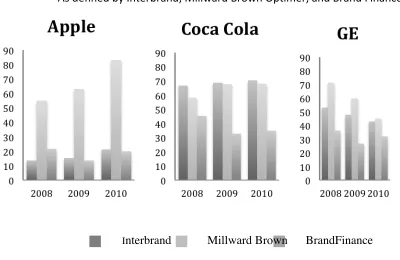
variations in their findings. We conducted our own comparison of Interbrand, Millward Brown
Optimer, and Brand Finance valuations for Apple, Coca Cola, and GE during the years 2008,
Figure 1: Apple, Coca Cola, and GE Brand Values 2008, 2009, and 2010
As defined by Interbrand, Millward Brown Optimer, and Brand Finance
Interbrand Millward Brown BrandFinance
Despite each provider using legitimate valuation approaches, the disparity in the results is
evident and undermines the credibility of current valuation processes. Even if their
measurements differ, all tend to be backward looking. Thus, although interesting from a news
perspective, practitioners cannot build strategies or predict turning points in the value of their
brands.
Two inherent challenges to valuing brands are evident: (1) Brand valuations and rankings are
made available after a lag period from the time the data is collected, compiled, and analyzed to
old and that do not adequately represent a key asset, the consumer.
This raises the question as to whether or not brand values can be predicted; i.e., are there any
forward-looking metrics that could help us explain brand value? Specifically, can Internet search
query data be a relevant, timely predictor of a brand’s financial value? In this research, we posit
that the firm is able to predict brand value via a consumer’s search query on the Internet for
brand terms. We believe that branded search queries are the forward-looking metric that explains
brand value and could be used to make reliable predictions about a brand’s value in the
marketplace literally months before that change is validated through traditional brand valuation
methods.
The downside of not being able to predict brand value is that this can have a great impact on the
practitioner. Motorola is an example of a brand that customers lost interest in, while brand
managers were slow to adapt to changing signals in the marketplace for feature-rich phones and
3G. Having successfully created demand for the RAZR, which launched in 2004, Motorola
released a series of product extensions including a limited edition version given to guests at the
Academy Awards ceremony in 2005. This cemented the RAZR's reputation as an iconic brand
and distinctive phone. As sales of the RAZR boomed, Motorola seems to have rested on its
laurels, failing to develop a pipeline of exciting replacement products to maintain upward
momentum (Frampton, 2007). The RAZR, highly successful at launch and significantly raising
the profile of the brand, was not followed by any “blockbuster” handsets before the RAZR
Consumer insight is at the heart of successful branding, according to experts. Motorola would
have been well advised to gain a deep understanding of its brand value, what drives its
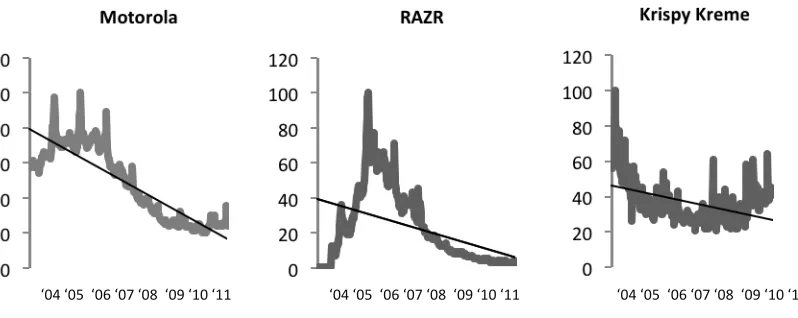
consumers, and to keep on top of emerging trends (Frampton, 2007). From the search queries in
Figure 2, we see a noticeable rise in queries worldwide for the brand Motorola and RAZR as
anticipated during the height of the RAZR releases in 2005. Both queries reached their highest
levels the week ending December 25, 2005. Foreshadowing the decline of Motorola, we see a
dramatic drop in the number of queries for RAZR, down 30% in one week and 50% within eight
months. By early 2007, the number of people searching online for RAZR and Motorola had
dropped significantly. Clearly RAZR was no longer top of mind, and without a product pipeline,
Figure 2: Motorola, RAZR, and Krispy Kreme Google Insight Search Queries
Worldwide, January 1, 2004–August 31, 2011 All categories; collected on September 12 and 17, 2011
In 2003, FORTUNE magazine called Krispy Kreme, the doughnut maker, “America's hottest
brand.” What followed was a period of aggressive expansion in New England, including a
well-publicized Krispy Kreme store at the Prudential Center in Boston, Massachusetts, which opened
on April 15, 2004. During this time, search queries for the Krispy Kreme brand reached their
height the week ending March 7, 2004, followed by a sharp decline. Within four months, the
number of searches for the branded term “Krispy Kreme” was cut in half. By the end of the year,
Krispy Kreme was forced to close all but one store following its recent expansion, and the
well-hyped Krispy Kreme at the Prudential Center in Boston was closed sixteen months after it
opened (Surowiecki, 2004). By 2005, the company faced defaulting on its $150M credit line
(Anderson, 2008). Would the knowledge of the dramatic decrease in searches for the Krispy
Kreme brand have prompted executives to reconsider their expansion plans?
In what follows, we will describe the current state of the relationship between brand value and
search queries, as well as other variables of interest including, customer actions, customer
values, marketing actions, brand history, and firmographics. The data we will use is available
over time, and for multiple brands. Typically this type of research would be a descriptive
analysis as it specifies the relationship between brand value and search queries. However, we
will use a hierarchical cross-sectional and time-series analysis framework to explain the
relationship between our predictive variables and future brand value, along with controlling for
numerous other factors that can impact brand value.
Looking ahead, in Chapter 2, we explore the literature concerning the practice of gathering
forward-looking metrics to help researchers explain lag data. We will understand how that
practice has carried over to digital data, and describe the studies’ contributions to the literature
by using search queries to predict the present in terms of a consumer’s real-time perception of a
brand. In addition, we extend the domain of past studies beyond the fields of epidemiology and
health to the social sciences specific to marketing. In Chapter 3, we will explain the consumer
information-processing model and search engine behavioral model as theoretical underpinnings
of our research. In Chapter 4, we describe our conceptual model and hypotheses followed by
Chapter 5, where we outline the methodology and data-gathering process. In Chapter 6, we
complete our analysis to determine if the number of search queries for a brand is positively
associated with brand value. In Chapter 7 we conclude by summarizing the contribution to
practitioners and existing literature, we further outline the limitations and provide guidance on
Chapter 2: LITERATURE REVIEW
The practice of gathering forward-looking metrics to help researchers explain lag data is well
known. Health practitioners collect information concerning school absenteeism, pharmaceutical
sales, and medical diagnoses in an effort to provide early detection of disease outbreaks (Hulth,
Rydevik and Linde, 2009). Companies gather sales data, and governments gather unemployment
and consumption information. The benefits are that early detection allows for interventions to
lower morbidity, allows companies to modify strategies, or governments to enact policy.
Conversely, the use of gathering digital data as a forward-looking metric to explain lag variables
is a fairly nascent area. With billions of people online, the digital footprint and the number of
search queries on the web is vast. In our literature review, we explore early studies focused on
the relationship of digital metrics, and web searches, to lag variables. We will examine the
evolution of this body of work that began in health sciences to identify epidemics and outbreaks,
through the adoption within economics to identify unemployment and consumption trends. This
research is similar in many ways to previous studies as it associates the number of search queries
with an outcome. In previous studies, the outcome was a behavior or an event. This research
varies in that it is the first of its kind used in marketing sciences, and the first of its kind to
associate search queries with perception, specifically the customer’s perception or efficacy
The practice of gathering digital data has been challenging in some respects due to a lack of
access. Early studies arose from the fields of economics and health sciences with the data utilized
in their digital surveillance coming from varied sources. For example, Johnson et al. (2004) used
the counts from articles viewed on a U.S. medical site with the Centers for Disease Control and
Prevention for surveillance of incidences of influenza. Ettredge, Gerdes and Karuga (2005) used
unemployment-related queries captured by Wordtracker, a keyword research tool, to predict the
number of unemployed in the United States.
Even with a limited supply of data, researchers continued to study the phenomena of the
statistical linkage between online behavior and offline occurrences. Cooper, Mallon, Ledbetter,
Pollack, and Peipins (2005) used Yahoo Buzz and LexisNexis news reports to correlate search
activity for cancer with their estimated incidence over the period from 2001 to 2003. Some
researchers employed creative methods such as launching ad campaigns related to flu symptoms
as a means to gather counts of user clicks to correlate with epidemiological data during the
2004–2005 Canadian flu season (Eysenbach, 2006). Others partnered with website operators like
a Swedish medical website for query counts to facilitate influenza monitoring (Hulth, Rydevik
and Linde, 2009) or with yahoo.com to show that search volume for select influenza queries
Research Domain
While search engines maintain a record of the searches entered into their websites, it was not
until the advent of the Google Trends and Insights for search applications in 2007 that this
information was made available to researchers and the public at large. Including counts for all
queries on a weekly basis since 2004, the data amounts to a vast and rich database. With this
information at their disposal, researchers embraced the opportunity to correlate search queries to
real-world outcomes across a variety of disciplines. At the outset, the data was documented and
used to describe the evolution of particular queries before the U.S. presidential elections
(Constant and Zimmerman, 2008). Using regression models, what soon evolved was the
discovery of a high correlation between search queries and unemployment in Germany and the
United States. (Askitas and Zimmermann, 2009; D’Amuir and Marucci, 2010).
Ultimately, Ginsberg et al. (2009) used search engine query data to develop a simple model that
would estimate the probability that a random physician in a region of the United States would see
a patient with influenza. This well-cited, seminal work led to more extensive research that
pushed the boundaries within epidemiological studies and econometrics. An early example prior
to the release of traditional indicators was Choi and Varian’s (2009) research using a simple
forecasting model to “predict the present” in terms of travel, as well as auto, retail, and home
sales.
Relying on regression analysis, the focus expanded from predicting events to predicting
determine the relationship of search queries to the opening weekend box office revenue for
feature films. Goel et al. (2010) also used search to predict first-month sales of video games, and
the rank of songs on the Billboard Hot 100 chart, finding in all cases that search counts were
predictive of future outcomes.
Kissan, Wintoki & Zhang (2011, p. 2) believe “the availability of measures of consumer search
behavior is only going to increase as we move further into the digital age”. Consistent with this
trend, scholars are coming to recognize that what individuals are searching for leaves a trail of
“what we collectively think” and “what might happen in the future” (Rangaswamy, Giles and
Seres, 2009, p.58). Across the empirical cases that we have considered, we observe that search
counts are predictive of an event prior to the release of traditional indicators, or a behavior that
will occur within days or weeks in the future. The predictions have typically been
epidemiological or economic events including unemployment, consumption, travel, or game, and
real estate sales. Our intent is to contribute to the literature by using search queries to predict the
present in terms of perception, specifically in terms of a consumer’s real-time perception of a
brand. In addition, we will extend the domain of past studies from epidemiological and health
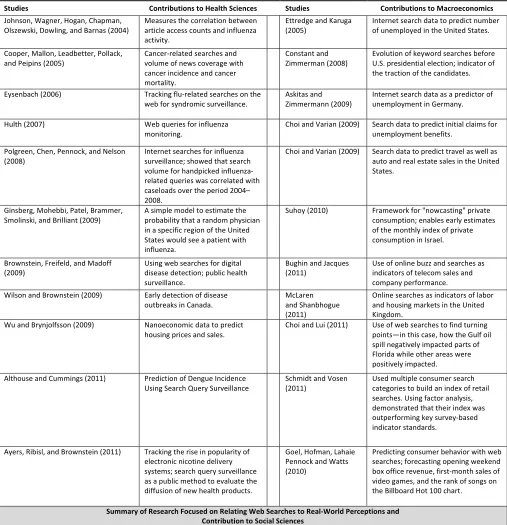
fields to the social sciences specific to marketing. See Table 1 for a summary of this study’s
contribution with regard to other studies that have focused on relating web searches to real-world
Table 1: Summary of Related Studies Relating Web Searches to Real-‐World Outcomes
Delineated by health, macroeconomics, and marketing sciences
Studies Contributions to Health Sciences Studies Contributions to Macroeconomics Johnson, Wagner, Hogan, Chapman,
Olszewski, Dowling, and Barnas (2004) Measures the correlation between article access counts and influenza activity.
Ettredge and Karuga
(2005) Internet search data to predict number of unemployed in the United States.
Cooper, Mallon, Leadbetter, Pollack,
and Peipins (2005) Cancer-‐related searches and volume of news coverage with cancer incidence and cancer mortality.
Constant and
Zimmerman (2008) Evolution of keyword searches before U.S. presidential election; indicator of the traction of the candidates.
Eysenbach (2006) Tracking flu-‐related searches on the
web for syndromic surveillance. Askitas and Zimmermann (2009) Internet search data as a predictor of unemployment in Germany.
Hulth (2007) Web queries for influenza
monitoring. Choi and Varian (2009) Search data to predict initial claims for unemployment benefits.
Polgreen, Chen, Pennock, and Nelson
(2008) Internet searches for influenza surveillance; showed that search volume for handpicked influenza-‐ related queries was correlated with caseloads over the period 2004– 2008.
Choi and Varian (2009) Search data to predict travel as well as auto and real estate sales in the United States.
Ginsberg, Mohebbi, Patel, Brammer,
Smolinski, and Brilliant (2009) A simple model to estimate the probability that a random physician in a specific region of the United States would see a patient with influenza.
Suhoy (2010) Framework for "nowcasting" private consumption; enables early estimates of the monthly index of private consumption in Israel.
Brownstein, Freifeld, and Madoff
(2009) Using web searches for digital disease detection; public health surveillance.
Bughin and Jacques
(2011) Use of online buzz and searches as indicators of telecom sales and company performance.
Wilson and Brownstein (2009) Early detection of disease
outbreaks in Canada. McLaren and Shanbhogue (2011)
Online searches as indicators of labor and housing markets in the United Kingdom.
Wu and Brynjolfsson (2009) Nanoeconomic data to predict
housing prices and sales. Choi and Lui (2011) Use of web searches to find turning points—in this case, how the Gulf oil spill negatively impacted parts of Florida while other areas were positively impacted. Althouse and Cummings (2011) Prediction of Dengue Incidence
Using Search Query Surveillance Schmidt and Vosen (2011) Used multiple consumer search categories to build an index of retail searches. Using factor analysis, demonstrated that their index was outperforming key survey-‐based indicator standards.
Ayers, Ribisl, and Brownstein (2011) Tracking the rise in popularity of electronic nicotine delivery systems; search query surveillance as a public method to evaluate the diffusion of new health products.
Goel, Hofman, Lahaie Pennock and Watts (2010)
Predicting consumer behavior with web searches; forecasting opening weekend box office revenue, first-‐month sales of video games, and the rank of songs on the Billboard Hot 100 chart.
Current Study The proposed study is designed to determine if brand search query data is positively associated with brand value and if search query data can offer greater empirical evidence as to the brand’s efficacy. This study furthers existing science in that it is the first of its kind to relate web searches to real-‐world perceptions,
breaking from the historic disciplines of health sciences and economics.
Chapter 3: THEORETICAL FRAMEWORK
Two models provide the theoretical underpinnings of our research. First, the consumer
information-processing model adopted from Kotler (1997), Schiffman and Kanuk (1997), and
Solomon (1996) introduces the concept that a consumer has a fundamental need to search for
information prior to making a purchase. The perspective being that information search begins
after a consumer recognizes a problem, or need for a product. Later theorists, like Bloch, Sherrell
and Ridgeway (1986), postulate that a consumer is always searching, either to make a purchase
or to gather information for use at a later time. This model lays the foundation that a customer’s
search query for a brand is a measure of their intent, be it positive or negative.
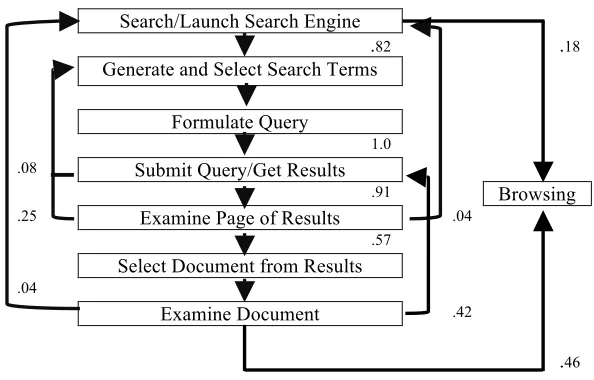
Second foundational model is the interaction with a search engine (Holscher, 2000). This model
details a consumers searching behavior online as a series of querying, clicking, and browsing.
Pentland (2008) describes this behavior as a more “honest signal” of actual interests and
preferences. Wu and Brynjolfsson (2009) supports this belief by describing a consumers search
query as a digital trace left by consumers that can be compiled to reveal comprehensive pictures
of the true underlying intentions and activities. This model solidifies the foundation that a
customer’s search query for a brand is a measure of their intent and that search queries in their
Marketing theorists have long argued that consumers seek information from a variety of sources
(Cox, 1967). This concept has evolved into the dominant school of thought among consumer
researchers known as the consumer information-processing model depicted in Figure 3
[image:25.612.184.422.194.407.2](Matsuno, 1997).
Figure 3: Consumer Information-Processing
Model
Source: Adopted from Kotler (1997), Schiffman and Kanuk (1997), and Solomon (1996)
In this model, the consumer passes through five stages: (1) problem recognition, (2) information
search, (3) evaluation and selection of alternatives, (4) decision implementation, and (5)
post-purchase evaluation. A principal determinant used in the information process is information
search. Though the consumer information-processing model identifies information search as a
prominent aspect of the pre-purchase decision process, Bloch et al. (1986) postulates that
information search is conducted throughout the entire information processing cycle as consumers
are driven by an immediate purchase decision, as well as building a bank of information for
future use.
Problem Recognition
Information Search
Evaluation and Selection of Alternatives
Decision Implementation
Traditional sources of information that consumers rely on to reduce the uncertainty related to
purchase decisions have been advertisements (radio, TV, and print), packaging, store displays, or
brochures. Information is also indirectly conveyed by the price and type of store in which the
product is sold. Consumers may also draw upon their own prior experience. He or she may
obtain information from friends, family, or salespeople or read about products in product-rating
publications or specialty magazines. In addition, the consumer may observe products being used
by others (Bettman, Johnson and Payne, 1991).
With the advent of the Internet, the consumer can gather near-perfect information (Reibstein,
2002). Historically, the amount of information delivered to the consumer was constrained by the
size of the package, the space available to deliver a message, the time available in a TV spot, or
the space available in a print ad (Reibstein, 2002). Alternatively, in the digital world the
information is not limited by the physical space (Alba and Hutchinson, 1987; Johnson, Lohse
and Mandel, 1997). Web sites, natural search links, and ads provide detailed information about
their merchandise, and comparison sites offer decision aids for making product price
comparisons. Discussion forums, chat rooms, and online consumer reviews provide consumers
with detailed experiences, opinions, and knowledge of others, both positive and negative, about a
product or a seller.
Another perspective is that the Internet allows consumers to become more efficient in their
buying processes. This efficiency results primarily because the cost of information, as well as the
Brynjolfsson and Kahin, 2000). The consumer can benefit from multiple points of view to make
informed assessments with less effort required to inform their purchase decisions.
Interaction With a Search Engine
It is hard for many to believe the important role that search engines play in today’s world. Be it
for academics, work or leisure, search engines can be used to find every conceivable kind of
information. Some of the searches conducted are directional, meaning a customer is looking for a
specific site. Some searches are fun and frivolous, meaning a customer is exploring hobbies,
favorite past times, or entertainment. However, according to Rangaswamy et al. (2009), many
searches are imbued with purpose, and search results can influence important decisions about
someone's life, health, or a major purchase.
The online search process does not start with the search query itself, but with the idea to search
(Joo, Mingyu, Wilbur and Zhu, 2010). The search idea may be general or very specific; a
consumer may want to learn more about an entire product category or may want to consider a
particular brand. Once the idea to search is formed, the consumer selects a search engine and the
query. The query, or set of words knows as keywords, can be one word or up to a full sentence.
The search query determines the breadth of information returned by the search engine. After
entering the query, the consumer examines the results and chooses the one of interest. The
consumer makes this choice by clicking on the result, either an ad or a link to the information
deemed most relevant. Holscher (2000) describes this process as one where an individual
Figure 4: Interaction With a Search Engine
Values represent transition probabilities to the next unit
Search/Launch Search Engine
.82 .18
Generate and Select Search Terms
Formulate Query
1.0
.08 Submit Query/Get Results
.91 Browsing
.25 Examine Page of Results .04
.57
Select Document from Results
.04
Examine Document .42
.46
Source: Holscher (2000)
The majority of the querying, clicking, and browsing behavior is conducted on Google: Google
accounts for 65.5% of the search volume on the Internet resulting in billions of daily queries that
are retained by Google in a database (Comscore, 2011). Pentland (2008) describes search as a
more “honest signal” of actual interests and preferences since there is no bargaining, gaming, or
strategic signaling involved in contrast to many market-based transactions. As a result, these
digital traces left by consumers can be compiled to reveal comprehensive pictures of the true
Chapter 4: CONCEPTUAL MODEL
This chapter presents the conceptual model for this study and states the hypotheses tested. The
central objective of this study is to determine if the number of search queries is positively
associated with brand value. Throughout the literature, researchers identify numerous variables
relative to brand value. Some of these variables are connected to financial models like sales and
market value (Farquhar, 1989; Simon and Sullivan, 1993; Haigh, 1999). Research has also
indicated customer-based variables relative to brand value like satisfaction and awareness
(Aaker, 1991; Keller,1993; Yoo and Donthu, 2000; Vazquez, Del Rio and Iglesias 2002; de
Chernatony, Harris and Christodoulides 2004; Pappu, Quester and Cooksey, 2005;
Christodoulides, Chernatony, Furrer and Abimbola , 2006). In developing the conceptual
framework, we incorporate both financial and customer-based variables into our model for the
purpose of explaining the relationship between search queries, consumer and financial variables
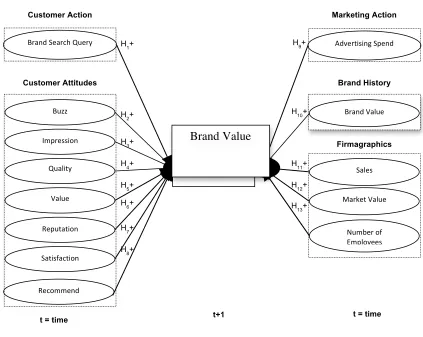
to brand value. Figure 5.
The selected predictor variables from a financial perspective are those derived from
firmographics, the brand’s history and related marketing actions. The customer-based
perspective is derived from customer values and actions. The conceptual model shows the
temporal relationship of the predictor variables represented at time t (year) and the dependent
variable, brand value at time t+1 (year+1), while controlling for economic factors that can impact
To address causality, the proposed framework specifies a time-based relationship among the
focal variables. Specifically, a one-year lag relationship is defined between branded search
queries, other predictor variables and brand value. Although such lags have not been defined in
the marketing sciences for search query data, a year lag is largely supported for a change in level
of measured communication, followed in the next year by a change in reputation and in the year
following by a change in financial performance. A one-year lag is common when investigating
the relationship between R&D activities and firm performance, and one-year lag effects are used
when accounting for the impact of advertising and R&D expenditures (Peterson and Jeong,
2010).
The model is simple in terms of the number of variables. The rational, as described by
Balasubramanian and Kumar (1990), is that as more variables are added, the model becomes
more complex and less interpretable, and understanding the interaction effects becomes more
difficult. Also, several predictor variables usually belong to the same domain, thus increasing the
Figure 5: Conceptual Model
Brand Value
In light of the inconsistencies of the brand valuation methods described earlier, the International
Standards Organization (ISO) created brand valuation standards known as ISO 10668. ISO
10668 is the international norm that sets minimum standard requirements for the procedures and
methods used to determine the monetary value of brands. It defines a coherent and reliable
approach for brand valuation that takes into consideration financial, legal and behavioral science
aspects (International Organization for Standardization, 2010). A certification program on the
Customer-Based Variables
Customer Action
Brand Search Query
Reputation Quality Value Satisfaction Recommend Customer Attitudes Impression Buzz
H1+
H6+ H5+ H4+ H3+ H2+
H7+
H8+
t+1 t = time
t = time
Firmagraphics
Market Value
Number of Employees Marketing Action
Brand History
Brand Value
Sales Advertising Spend
H12+
H13+ H10+
H11+ H9+
Financial Variables
Brand Value
ISO 10668 standards (ISO, 2010). Interbrand and BrandFinance are two such valuation providers
whose methodologies have been certified since ISO 10688’s inception in October 2010. For
purposes of our research, we use BrandFinance valuation characterized by Salinas and Ambler
(2009) as a technical provider, with an emphasis on financial market value to minimize
collinearity.
Brand Finance first issued its top 250 brand value ranking table in 2007 (reflecting 2006 values).
In 2008, the study was extended to report the top 500 brands worldwide. (Brandfinance, 2011).
Our data sets consists of 74 brands, each accorded a brand rating with values for each year from
2007 through 2011 (released in years 2008 to 2012). The brands in the dataset represent 15
industries (consumer banking, consumer package goods, department discount and grocery stores,
fast food dining, insurance, travel, apparel, auto, consumer electronics, beverages, financial
advisors, retail gasoline, retail specialty and telecom) and are headquartered across 15 countries
(US, Japan, Switzerland, Sweden, Germany, Australia, Hong Kong, Spain, France, Great Britain,
India, Korea, Netherlands, Finland and Italy). Brand values range from a low of $1.4 trillion for
Sprint in 2008, to a high of $70 trillion for Apple in 2011. In addition, our data set represents
brands that have declined and increased in value over the five-year period.
Customer-‐Based Variables
In most customer-based brand value research, surveys are used to determine the cognitive and
behavioral value of a brand at the individual consumer level (Yoo et al., 2001). For our research,
1. CUSTOMER ACTION
Brand Search Query. Chaudhuri and Holbrook (2001) support that brand value includes some
degree of predisposition toward a brand by the consumer (Aaker, 1991; Assael, 1998; Beatty and
Kahle, 1988; Jacoby and Chestnut, 1978). Historically, brand search queries have not been
modeled as a predictive measure of brand value. The hypotheses is that when consumers are
browsing, querying and searching on the Internet, this activity represents a predisposition to the
brand, and the brand search queries are reliable predictors of a brand’s value literally months
before that change is validated through traditional brand valuation methods. As described in our
literature review, the use of search queries is a growing body of work relating web searches to
real world outcome, specifically healthcare and macroeconomics. If we extrapolate the
theoretical underpinnings to the social sciences specifically marketing, we would expect
increases in branded search queries for a particular brand to reflect in the brand’s value released
the following year. Therefore,
H1: increases in brand search queries at t, increased brand value at t+1.
2. CUSTOMER VALUE
Researchers of brand value evaluate customer value indirectly by asking certain questions and
drawing particular conclusions about the customer’s response (Banyte, Joksaite and Virvilaite,
2007). Consumer surveys are often used to capture customer values, attitudes, beliefs, and
behaviors toward a brand (Lehmann, Keller and Farley, 2008; Srinivasan and Hanssens, 1979;
Rangaswamy, 1993; Keller, 1993; Berg, Matthews and O’Hare, 2007). A key challenge in
developing survey-based brand values and metrics is the wide range of possible measures that
For this reason, multidimensional measures are used in this research to capture a customer values
toward the brand. A traditional customer value metric used for marketing sciences has been the
American Customer Satisfaction Index (ASCI), (Anderson, Fornell and Mazvancheryl, 2004;
Fornell, Mithas, Morgeson and Krishnan 2006; Gupta, 2006). As the data is not consistently
available at the brand level (Srinivasan and hanssens, 2009), we selected YouGov’s Brandindex
as our measure of customer value as it is available at the brand level, can be regionally
segmented, and based on the segmentation it is available typically since 2007. YouGov’s
information is interval data, collected daily, on hundreds of brands, rather than just a few
predetermined brands. The data is derived from surveys conducted over the Internet using an
opt-in panel of the general public. YouGov’s survey metrics have proven to be both meaningful
and versatile in a variety of research areas including Omnicom’s BrandScience projects. In
particular, BrandIndex metrics have proven valuable as both upper and lower funnel analytics
(Collins et al., 2010).
The customer value metrics from YouGov used in this research include buzz, impression,
quality, value, reputation, satisfaction and recommendation. Each metric is taken independently
– in other words, in any one survey, any individual respondent is asked about only one measure
for the sector, not all seven. Therefore, none of the ratings influence each other within the survey
(Brandindex, 2011)
buzz measure reflects what the consumer has heard in the media, news or advertising, or in
conversations among friends and family about the brand. Buzz indicates whether a consumer
noticed good or bad news, advertising or PR campaigns, product launches or whether there is
any 'word on the street' emerging. As buzz reflects the recent brand sentiment and the
direction of recent awareness, we hypothesize that an increase in positive and neutral buzz
be associated with an increase in the brand value.
H2: Increase in the customer’s positive and neutral buzz at t, increased brand value at t+1
Impression. Impression is the strength, favorability, and uniqueness of perceived attributes and
benefits of the brand. The impression variable reflects positive or negative feelings toward the
brand. Leuthesser, Kohli and Harich (1995) determined that a brand represents the value of a
product’s impression, or the global effect, above that which would result for an otherwise
identical product without brands name. Thus, we hypothesize that an increase in positive and
neutral impressions of the brand, will be associated with an increase in the brand value.
H3: Increase in the customer’s positive and neutral impression of the brand at t, increased
brand value at t+1
Quality. Quality reflects whether the brand is perceived as good or poor quality, irrespective of
price. Many researchers have identified perceived quality as a dimension of brand value (Aaker,
We hypotheses that an increase in perceived quality of a brand will be associated with an
increase in the brand value.
H4: Increase in the customer’s positive and neutral perception of the quality of the brand
at t, increased brand value at t+1
Value. Value measures the perception of a brand’s price-point, its value offering. Value does not
mean “cheap” or “expensive”, but what the brand offers a customer in return for the price paid.
Value is defined by Lasser, Mittal and Sharma (1995) as the perceived brand utility relative to its
costs. From a customer perspective this means the customer weighs and measures what is
received, with what must be given up to receive it. This gets at the heart of the value versus the
price paid, and the utility the product offers. Therefore, we hypothesize that an increase in
positive and neutral value will be positively associated with an increase in the brand value.
H10: Increase in the customer’s positive and neutral perception of the value of a brand at t,
increased brand value at t+1
Reputation. Reputation informs us about what products to buy, what companies to work for or
what stocks to invest in (Fombrun, 1996). Reputation is the image associated with owning or
using a brand, the measure of a brand’s ”prestige” explained via consumers desire to work for a
brand. Positive responses indicate that one would be proud to work for the brand, or advise a
our hypothesis that an increase in positive and neutral reputation will lead to an increase in
the brand value.
H5: Increase in the customer’s positive and neutral perception of a brand’s reputation at t,
increased brand value at t+1
Satisfaction. Satisfaction is a measure of performance against customer expectations, it is
centrally related to all elements and has some of the strongest correlations with brand health
(Berg et al., 2007). It answers the question: Are customers satisfied with their experience with
the brand? It measures the extent to which consumers purchase and use the brand, talk to others
about the brand, and seek out brand information, promotions, and events. Satisfaction is a
measure of the number of people feeling generally ‘positive’ or 'generally negative' toward a
brand. Overall, we postulate the following:
H6: Increase in the customer’s positive and neutral satisfaction measures of the value of a
brand at t, will lead to increased brand value at t+1
Recommend. Recommendation, like a referral reflects a positive promotion by individuals,
increasing the likelihood of adding new customers or sales, Berg, Matthews and O’Hare (2007).
Recommend measures the impact of the ambassadors and the equity destroyers of a brand.
Recommend measures if your brand will be recommended for consumption or use, or
recommended as a brand to avoid. We hypothesize that an increase in positive and neutral
H7: Increase in the customers’ positive and neutral recommendations at t, increased brand
value at t+1
Financial Variables
In contrast to customer-based variables, for financial-based measures researchers collect
financial market, accounting, firm level data without contacting consumers; these then identify
dollar-metric and financial brand value at the firm or brand level (Yoo, 2000). For our research
we use (1) marketing action, (2) brand history and (3) firmographics as a proxy for
financial-based measures to predict the brand value at the brand level.
1. MARKETING ACTION
Advertising spend. In the marketing literature there is extant studies on the value creation of a
firms advertising spend on brand value (Mizik and Jacobson, 2003; Chaudhuri, 2002; Shah and
Akbar, 2008; Peterson and Jeong, 2010; Abdel-khalik, 1975; Hirschey and Weygandt, 1985).
Consistent with the literature, it is our hypothesis that increased advertising spend for a particular
brand is reflected in the brands value released the following year.
H8: Increase in advertising spend by the firm at t, increased brand value at t+1.
2. BRAND HISTORY
Brand Value. Brand loyalties influence brand value (Aaker, 1991). Increased loyalty results in
reason, it is our hypothesis that increases in loyalty reflected in a brand’s value in year t will
have a spillover effect in a brand’s value in year t+1. Thus,
H9: Increase in brand value at t, increased brand value at t+1
3. FIRMOGRAPHICS
A number of structural variables at the firm level have been used in empirical studies
(Proceedings of the International Conference on Information Systems, 1987).
In selecting our variables we indicate net sales (Kumar, Venkatesan, Bohling, and Beckmann,
2008) and the number of employees (Kaen and Baumann, 2003; Evans, 1987) as a measure of
growth. We use and market value (Simon and Sullivan, 1993) as a measure of shareholder return.
Sales. Sales reflect the revenue generated by the firm from the sale of a good or service. It is defined in each company’s annual report after discounts and allowances. Berg et al., (2007),
observed statistically significant correlations between brand value and sales, the healthiest brands
having twice the amount of customers increasing spending than the worst-performing brands.
These findings allow us to incorporate sales as a key element of brand value. It is our hypothesis
that favorable consumer brand value will be reflected in purchase behavior and sales. Therefore,
H10: Increase in firm sales at t, increased brand value at t+1
Market Value. Simon and Sullivan, 1993 outline a technique for estimating a firm’s brand
value, based on a firms’ market value. Market value is the ultimate metric of shareholder value
Equity + Short-Term and Long-Term Debt + Other Long-Term Liabilities + Minority Interest –
Cash & Equivalents. For Banks and Financials it is calculated at: Market Capitalization +
Preferred Equity + Short-Term and Long-Term Debt + Other Long-Term Liabilities + Minority
Interest + Total Deposits.
It is our hypothesis, similar to Simon and Sullivan’s findings that firms with commonly known
brand names have higher estimates of brand value.
H11: Increase in a firm’s market value at t, increased brand value at t+1.
Number of Employees. As in previous research by Kaen and Baumann (2003) and Evans
(1987), our measure of firm size is the natural log of the number of employees. It is our
hypothesis that an increase in the number of employees is indicative of the need to increase
production to meet increased demand. Therefore, we expect the following:
H12: Increase in a firm’s number of employees at t, increased brand value at t+1
4. CONTROL VARIABLES
Although they are not of primary theoretical interest to our study, we include in our model
control variables that have been found in prior research to affect brand outcomes. Beyond
whatever substantive interest these control variables possess in their own right, similar to
Chaudhuri and Holbrook (2001), their main purpose here is to help remove statistical noise due
to omitted-variables bias in a case in which we can capture effects that have been shown
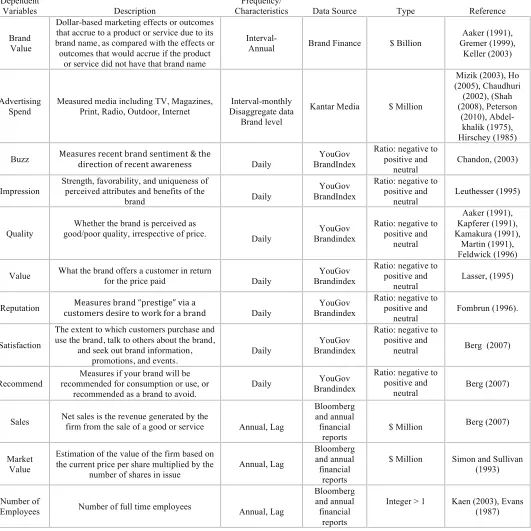
A summary of the variables, a detailed description, frequency and characteristic of the data and
Table 2: Variable Description and Source
Dependent
Variables Description Characteristics Frequency/ Data Source Type Reference
Brand Value
Dollar-based marketing effects or outcomes that accrue to a product or service due to its brand name, as compared with the effects or outcomes that would accrue if the product
or service did not have that brand name
Interval-
Annual Brand Finance $ Billion
Aaker (1991), Gremer (1999),
Keller (2003)
Advertising
Spend Measured media including TV, Magazines, Print, Radio, Outdoor, Internet Disaggregate data Interval-monthly Brand level
Kantar Media $ Million
Mizik (2003), Ho (2005), Chaudhuri (2002), (Shah (2008), Peterson (2010), Abdel-khalik (1975), Hirschey (1985)
Buzz Measures recent brand sentiment & the direction of recent awareness Daily BrandIndex YouGov
Ratio: negative to positive and
neutral Chandon, (2003)
Impression
Strength, favorability, and uniqueness of perceived attributes and benefits of the
brand Daily
YouGov BrandIndex
Ratio: negative to positive and
neutral Leuthesser (1995)
Quality good/poor quality, irrespective of price. Whether the brand is perceived as Daily Brandindex YouGov Ratio: negative to positive and neutral Aaker (1991), Kapferer (1991), Kamakura (1991), Martin (1991), Feldwick (1996)
Value What the brand offers a customer in return for the price paid Daily Brandindex YouGov
Ratio: negative to positive and
neutral Lasser, (1995)
Reputation customers desire to work for a brand Measures brand “prestige” via a Daily Brandindex YouGov Ratio: negative to positive and
neutral Fombrun (1996).
Satisfaction
The extent to which customers purchase and use the brand, talk to others about the brand,
and seek out brand information, promotions, and events.
Daily
YouGov Brandindex
Ratio: negative to positive and
neutral Berg (2007)
Recommend recommended for consumption or use, or Measures if your brand will be recommended as a brand to avoid.
Daily Brandindex YouGov
Ratio: negative to positive and
neutral Berg (2007)
Sales Net sales is the revenue generated by the firm from the sale of a good or service Annual, Lag
Bloomberg and annual financial
reports
$ Million Berg (2007)
Market Value
Estimation of the value of the firm based on
the current price per share multiplied by the number of shares in issue
Annual, Lag
Bloomberg and annual financial
reports
$ Million Simon and Sullivan (1993)
Number of
Employees Number of full time employees Annual, Lag
Bloomberg and annual financial
reports
Chapter 5: METHODOLOGY
Database Overview
To evaluate our conceptual model, we compiled a cross sectional data set of seventy-four brands
for five consecutive years from 2007 through 2011. The data set consists of each brands’ value,
the associated customer search queries for the brand term conducted on Google’s search engine,
along with the brand’s history, the firm’s marketing actions, customer attitudes and associated
firmographics.
Predictor Variables
The predictor variable is a customer’s query for a brand that has been searched for on the Google
engine; these queries are stored on Google in what is known as records. Each record stored
includes the search query itself, the IP address, the date it was entered, and the type of device it
was entered from (mobile phone, desktop computer). These records collectively are referred to as
search logs. Most websites store records of visits to their site in a similar way. For more on
search logs and privacy see Appendix, Disclosure 1.
To access and analyze search query data, we use two tools, Google Insights found at
http://www.google.com/insights/search/ and Google’s internal tool for categorization and counts.
Google Insights provides an index of the volume of Google queries by geographic location and
category measured against total query volume. Google Insight data are automatically filtered for
spam and porn, and the researcher can apply filters by query string, query category and time. The
number represents the normalized query share by each filter. For a given query of interest,
of interest as a substring is included in the statistics. Google Insights has been used in many
studies including capital markets (Vlastakis and Markellos, 2010; Da and Gao, 2010),
entertainment (Choi and Varian, 2009; 2010), labor markets (Askitas and Zimmerman; 2009;
Suhoy, 2009; D’Amuri and Marcucci, 2010), real estate markets (Wu and Brynjolfsson, 2009;
healthcare (Polgreen et al., 2008; Brownstein, Freidield, and Madoff, 2009; Corley, Mikler,
Singh and Cook, 2009; Hulth et al., 2009; Pelat, Turbelin, Bartten, Flahault and Valleron, 2009;
Valdivia and Monge-Corella, 2010), economic indices (Ettredge and Karuga, 2005; Schmidt and
Vosen, 2009) and travel (Choi and Liu, 2011).
Google’s internal tool for categorization and counts is similar to Insights in that it filters for spam
and one can apply filters for geography and time. However, Google’s internal tool uses an
“exact” match algorithm such that any query string containing the exact query will be included in
the statistics, queries in a substring will not. Google’s internal tool does not index the data and no
other filters are automatically applied.
To extract and compile the data we invoke a three stage process involving (1) building query
libraries for each brand, (2) quantifying and detrending queries, (3) coding and collating.
Step (1), building query libraries for each brand involves the identification, extraction and
storage of brand and associated brand queries. Many queries for a brand are simply the brand
itself, like “apple”, however many users will input brand association such as apple computer,
it uses the “broadmatch” algorithm that provides us with the query substrings. Researchers
typically use Google Insights to obtain the indexed volume of search queries by geographic
location and category (Ginsberg et al., 2011; Polgren et al., 2008; Goel et al., 2010; Schmidt and
Vosen, 2011; Choi and Lui, 2011 and 2009; McLaren and Shanbhogue, 2011; Askitas and
Zimmermann, 2009). For our purposes, we use Insights to gather the query substrings that are
displayed as top and rising queries associated with the brand. This process allows us to capture
the queries associated with the brand with the most significant level of interest and those that
experienced significant growth in a given time period. For example, when you input a specific
query into Insights, for a specific period of time, you will see a list of the top 10 rising queries
related to that term. The Insights tool determines relativity by examining searches that have been
conducted by a large group of users preceding the search term entered, as well as after. For
example, if a user inputs "apple," the list of rising searches will include apple, but it may also
include a product (apple ipod) or a navigational query (apple location). This process is repeated
for each brand, for each year 2007 through 2011, with the associated queries captured in a file
called a library.
For purposes of our research we apply filters for the US, to coincide with our dependent
longitudinal variables of advertising spend, customer value and brand value, we include all
categories and specify the year. If a brand query could mean different things (example, Visa
means a credit card association as well as travel and residency documentation) Insights takes a
look at broad search patterns among people who search for the credit cards versus those who
search for travel and residency documentation. Specifically, people looking for the credit card
brand may have also looked for Mastercard in the few searches immediately before and after,
related to immigration or customs immediately before or after. In the event the queries
significantly cross into other categories (VISA is 10 to 25 percent in the financial category and
25 to 50 percent in law and government) we specify the desired category, in the case of VISA we
select financial services. For each brand, the size of the library is n>20.
Step 2 of our process involves obtaining a count of the number of times each query from the
newly created brand library was entered into Google as a search. As the brand variables of
interest are reported on a calendar basis, we aggregate the search query counts into an annual
amount, for a given year. We access Google server logs through the internal tool to obtain the
count by reading the number of times the query was entered by desktop, laptop, mobile or
tablets, the related year and country. We utilize the internal tool due to the “exact” match
algorithm that counts exact queries strings, not substrings which would introduce confounding
variables into our process. We repeat this process for each brand and for each year 2007 through
2011. Once we have the counts we normalize the data to 2007 levels, accounting for Internet
adoption and Google’s share of core search.
In Step 3 we analyze the emotional content of the queries using SentiStrength, a publically
available list of 890 positive and negative sentiment terms (Thelwall, Buckley, Paltoglou, Cai
and Kappas, 2010). SentiStrength detects positive and negative sentiment strength in short
informal text and assigns an integer from 5 to -5 to reflect sentence-level subjectivity, examples
include: dislike = -3, hate=-4, coolest = 3, love = 4. Sentistrength has been used to analyze the
emotional content of tweets, blogs and other short text (Bollen, Mao and Zeng, 2009; Paltoglou
and Thelwall, in press). For purposes of our analysis, the queries are multiplied by their
To finalize, we append the values for the remaining predictive variables including brand,
customer value and firmographics as well as the control variables.
The methodology described employs qualitative approaches to the large volumes of textual
search query data. The amount of data, in the order of billions of queries per day, poses
considerable challenges to identifying and manual coding relevant brand queries and counts over
the five-year period. In this research we utilize the fully automatic identification and
categorization of queries by leveraging the output of Google’s machine language algorithms as
made available through their Google Insights tool and internal query categorization and access
tool. SentiStrenth is a semi-automatic coding on textual data (specifically, short text). The use of
machine language processing is preferred due to the size of the database, and to eliminate any
Chapter 6: ANALYSIS
To enable us to assess the proposed hypotheses, we use a modeling framework that accounts for
the various sources of errors, outliers, multicollinearity and brand specific effects of search
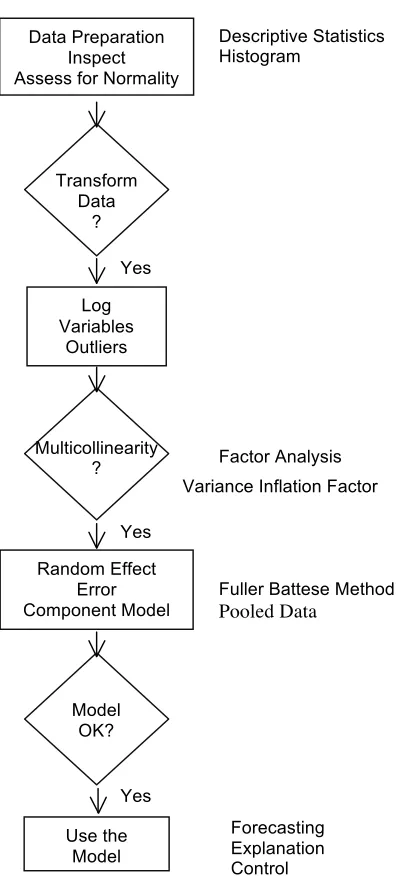
queries. Figure 6 is a flow chart depicting the decision-making steps and selected analysis.
To begin, standard diagnostic checks were conducted on the data to assess for normalcy.
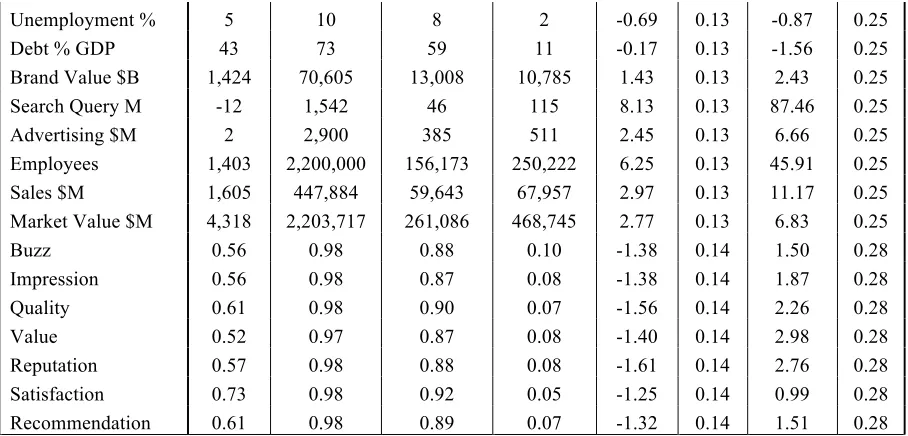
Descriptive statistics (Table 3) indicate a need to logarithmicly transform brand, search and
firmographic variables. Outlying search query variable BP is removed, as it is explainable, an
[image:49.612.199.398.63.504.2]anomaly and a negative value that cannot be logged.
Table 3: Descriptive Statistics
Min Max Mean St. Dev. Skewness Kurtosis
Data Preparation Inspect Assess for Normality
Log Variables Outliers Random Effect Error Component Model Use the Model Transform Data ? Multicollinearity ? Model OK? Descriptive Statistics Histogram Factor Analysis
Fuller Battese Method
Pooled Data Forecasting Explanation Control Yes Yes Yes