Development of Methods to Study Secondary Organic
Aerosol
Thesis by
Yuanlong Huang
In Partial Fulfillment of the Requirements for the
Degree of
Doctor of Philosophy
CALIFORNIA INSTITUTE OF TECHNOLOGY Pasadena, California
2019
© 2019
Yuanlong Huang
ORCID: 0000-0002-6726-8904
ACKNOWLEDGEMENTS
My success at Caltech relies on help from many people.
First, I would like to thank my advisor, John Seinfeld, for his unlimited trust in me and the freedom he gave me to work on the topics that interest me. I am extremely
fortunate to have John, a great scientist of atmospheric chemistry, as my advisor.
I witnessed John’s 50th year in Caltech and he is humble and eager to learn new
things from others and responsive to his students. I am impressed by how efficiently
John works. He is always there whenever I have a problem. I appreciate his patience
on editing my writing. I also learned time management from him. In addition to
his academic guidance, I also want to thank him for offering the annual mini-golf
outing and Dodgers game. I am deeply grateful to him for his invitation to his house
for Thanksgiving dinner.
I also want to thank Rick Flagan for his kind instruction on DMA theory and
engineering. I enjoy talking with Rick about research ideas. I like to stop by
his office, chat with him about my new ideas, and listen to his suggestions, which
always surprise me. I appreciate that he spends time with me side-by-side to solve the
problems I have encountered in research, no matter whether they are instrumentation
or model. The Flagan Laboratory in Schlinger always looks like a big stock room of
“toys”, which I have a lot of fun playing with. I enjoy the time soldering and forging
in Schlinger. Thanks to Rick for introducing these electrical and mechanical tools to me.
I would like to thank Paul Wennberg for serving as my committee chair. I am very
impressed by how quickly he picks up my thoughts even though I describe them
terribly. I still remember the time I went to ask him if he can serve as my committee
member. After I said “Can I borrow you one minute”, he replied “Yes, I am glad
to be your committee member”. I was so surprised since it looks like he can read
from my mind. I like his question to me every time we casually meet in the hall
“Have fun?”, which always reminds me the origin of my motivation to do research. I always benefit from some random chats with him about the project I am working
on. I also want to thank the Wennberg group members for teaching me CIMS, FTIR,
UV-vis and GC techniques.
I thank Michael Hoffmann for being my committee member. I first met Michael
am very fortunate to have the access to the Hoffmann Laboratory, where I have the
chance to see ongoing research projects, like the very cool small electrical-chemical reaction chamber. Thanks to Michael for introducing the basic aqueous-phase
chemistry and mass transport to me in his class. It is very generous of Michael to
allow me to use the 3D printer in his lab, without which I could not construct the
instrument I am building. Thanks to Michael for loaning me some of his book on
chemical kinetics. I appreciate his input on aqueous-phase chemistry as well as the
help from Hoffmann group members.
I want to thank Jack Beauchamp for sharing his sparkling ideas on mass spectrometry detection techniques and allowing me to get into his lab to see those fantastic
techniques. I would like to thank Andy Thompson for his help as a representative
advisor in ESE. I appreciate his advice on fluid dynamics after my qualifying exam.
I also want to thank Prof. Shaocai Yu in Zhejiang University. During his visit
in Caltech, I enjoyed discussing with Shaocai about the concept of instantaneous
VOC yields and PM removal by water droplets. I thank him for generously insights
his experience on CMAQ modeling. He taught me about taking actions whenever
you have an idea. I want to thank my master advisor, Prof. Xin Yang in Fudan
University, without whom I could not make it to Caltech. I can still turn to him for
suggestions on my career plans. I really appreciate his help.
I would like to thank John Crounse for his unconditional help on instrumentation.
I am impressed by John’s broad knowledge on almost everything: coding and
controlling theory, wiring and electrical engineering, chemical synthesis, reaction
kinetics, etc. Every time I encounter a technical problem, I always have the feeling
that once I turn to John for help it will be solved. And it does! During this process
I learned a lot from him. I aspire to be a person like John who is trusted by all. The
second person that gives me a similar feeling is Stavros Amanatidis. His knowledge on mechanical engineering is fantastic. I always feel the instruments he made are art
pieces. Thanks to him for teaching me how to use the forging machines and thanks
to him for spending time helping me design the instruments. I learned a lot from
him!
I would like to thank Ran Zhao, not just as a mentor, but as a friend. Thanks
for introducing me to the magic world of aqueous chemistry. It is a lot of fun to
work and play ping-pong together. Your abilit to deal with different situations is
with me. I wish the best to you and your family!
Thanks to Matt Coggon for being my mentor. Thanks for transferring the CPOT
you have built, teaching me Labview and basics of mechanical engineering. Thanks
to Becky Schwantes for teaching me knowledge about CIMS as well as laboratory
safety. I also want to thank Xuan Zhang, with whom I overlapped for a year.
She taught me basic laboratory skills, especially GC calibration, DMA wiring and
calibration, as well as chamber data processing. I thank Kelvin Bates for sharing his
vision on IEPOX SOA chemistry. Though the project has many mysteries, I am sure
we will make it fruitful. Thanks to Huajun Mai for teaching me DMA inversion and some electrical engineering knowledge. I am very happy to see you get a job you
like. I thank Renee McVay for showing me how a chamber model is built. Thanks
to Kevin Barraza for teaching me the FIDI technique. I am fortunate to be able
to collaborate with you and publish my paper. I want to thank Xinxing Zhang for
showing me the colorful world of physical chemistry while we ate together and the
design of the acoustic levitator for droplets.
I would like to thank the current Seinfeld group members, from whom I got a lot
of assistance, support, understanding, and fun. In addition to all the academic help (research ideas, background knowledge, instrumentation, scientific writing,
and plotting, etc.), which I cannot list all since they happen everyday, I would like
to thank them for all the fun I had outside the lab (e.g., the dodgeball and kickball
games we played as a team): Chris Kenseth, thank you for introducing baseball to
me; Weimeng Kong, thank you for showing me how to skateboard; Brigitte Rooney,
thank you for keeping a GPS T-shirt for me; Sophia Charan, thank you for helping
me rephrase my words; Elyse Pennington, thank you for hosting the white elephant
party; Ben Schulze, thank you for arranging the magic castle; Reina Buenconsejo,
thank you for preparing the birthday surprise. Though I cannot join you in the crossword game, I feel very fortunate to have you all in my life.
I also want to thank Yuan Wang and Lu Xu. Both of you have expanded my view
from the field I focused on to another research field. Yuan taught me some basic
ideas about how large-scale models are framed, and Lu taught me new technical
skills and atmospheric chemistry. It is great to have both of you as lunch partners and
I learned many interesting ideas about academy from you. I like how we searched
for free food on campus together. I thank the Chinese-American Oceanic and
and the Southern California Chinese Environmental Protection Association
(SC-CAEPA) for serving as excellent platforms to get to know more people not just from academy, but also from industry.
I thank all my roommates at Caltech: Max Lifson, I was very lucky to have you as
my first foreign roommate from September 2014 to October 2016. I appreciate your
patience on listening to my experience despite my poor oral English. Special thanks
for inviting me to your wedding ceremony, I am so fascinated by the Jewish wedding.
Best wishes to you and Lauren! Pengfei Sui, my second roommate from November
2016 to June 2018. It was a lot of fun to snowboard and play paintball with you. Thanks for introducing me to so many delicious restaurants. I wish the best for your
professorial life at The Chinese University of Hong Kong, Shenzhen. Sang Chen,
my current roommate since August 2018, thanks for taking me to grocery stores
weekly before I got a car and thanks for sharing your cooking skills. I am glad to
see both of us are graduating at the same time and will work as postdoc fellows in
Caltech for the next year.
I thank Hao Xie for being my best man, meal partner, and playmate. It is a lot of fun
to boulder, skateboard, and swim together with you. Through talking with you, I am impressed by your broad knowledge in every topic. Thanks to Siteng Fan, Xunyi
Wu and Yanzhe Zhu for making me feel less lonely and younger. It is a lot of fun to
eat and play with you guys. Thanks to Yang Yang and Siwen Wang (and also your
cute boy Edmund) for inviting me to your house and hosting so many delicious BBQ
parties. I wish the best for Professor Yang’s career in Clarkson University. I want to
thank Cheng Li, Qiong Zhang, Lucy Yin, Xiyue Zhang, Ho-Hsuan Wei, Wen Chen,
Dandan Huang, Jinqiang Chen for being beside me and helping me when I have
problems. I want to thank to Panqu Wang and Yuan Yuan for being my friends since
we were undergraduates. It is great to have you in San Diego so I have an excuse to drive there for fun. Thanks to Hao Sun for driving a long way from Shanghai to
attend my wedding.
I thank Christine and Dwight Landis for their unconditional support of instruments
and grants to the Seinfeld Laboratory. I want to thank Martha Hepworth for helping
me purchase all the materials and arranging the conferences. I thank Suresh Guptha
for the assistance on computer issues. I also want to thank the L+R stuff: Nora
Oshima, Kathy Young, Kathy Bravo, and Bronagh Glaser, for making L+R into a
applications.
I also want to thank the Caltech Ping-pong club led by Peter Lee. I still remember
how Peter and I got to know each other for the first time, which we review every
time we have a party together. Thanks to Peter for hosting so many BBQ parties. I
like Peter’s cooking skill: the Korean style BBQ is so delicious. Thanks to Hiroyuki
Hosokawa for training me in Ping-pong, which is a lot of fun. I would also like
to thank Peter and Hiro for taking me to the Dodgers Stadium and the post-game
dinner. I missed the Gam Ja Tang team a lot since Ran and Hiro left for their own
careers. Good luck to you!
I would like to thank the GPS graduate students who began the same year as me: Elizabeth Bailey, Austin Chadwick, Sang Chen, Elle Chimiak, Alistair Hayden,
Daniel Johnson, Voon Hui Lai, Ellen Leask, Jose Luis, Peter Martin, Kyle Metcalfe,
John Naviaux, Leah Sabbeth, Nancy Thomas, and Chanel Valiente. Thank you for
the projects we have done together, including preparing for the GPS social hour in
our first year and hosting the Zilchbrau party in our second year. It was a lot of fun
to work with all of you. I also like the picture we took together after all of us passed
the qualifying exam. I am so proud of all of us.
I want to thank the softball leagues, the Flyball team and the Papa John’s team.
Though I got hit by a softball several times (and it really hurt) and we lost many games, I enjoyed when we fought together and the post-game beer on the roof of
north parking structure. I also thank the Caltech Gym for providing all facilities
to keep me healthy and strong. Thanks to Jin Yang for working out and running
together with me. Hope the best to your postdoc life at the University of Wisconsin.
I want to thank the Caltech GPS Division for hosting the Pahoehoe travel to the
Island of Hawai’i for all GPS graduating students. Through this trip I saw many
gorgeous geological phenomena for the first time: the huge crater, the Pahoehoe
and A’A all over the mountains and plains, the large lava tube, the ice lake that is 4000 m above sea level, etc. I was also impressed by how bio-diverse the island
is: plants, birds, fruits (especially bananas), and the agriculture. Thanks to John
Naviaux’s instruction and protection, I learned how to snorkel and saw colorful
fishes as well as a big turtle. I also got chance to know many new Hawaiians: the
tree house guys - Elle Chimiak, Brooke Dallas, Michelle Dan, Cody Finke, Giuliana
Viglione; the hot tub house guys - Elizabeth Eiden, Melissa Gutierrez, Lydia Kivrak,
Lyn Li, Kabir Mohammed, Alyssa Poletti, Madeline Schemel; and the old volcano
John Naviaux, Sang Chen. Special thanks to Joe Kirschvink and Jason Saleeby for
leading the team to explore the volcano. Thanks to Leticia Calderon for preparing all the paper work for flight tickets, brochures, and reimbursements. Thank you
all for making this fantastic trip so exciting and fruitful, which will be my lifetime
treasure. Mahalo!
It has been almost 15 years since I left my family to pursue my dream. I really
missed them: my father Yu Huang, mother Feng Chen, and sister Qin Huang. I
would like to thank my family for their understanding of and support to me. Lastly,
I want to thank my wife, Lin Lin, for her support and love. In the past few years, we did not have many opportunities to spend time together. I missed you a lot. I love
you all three thousand times. (It is quite odd that they are the most important people
ABSTRACT
Secondary organic aerosol (SOA) in the atmosphere contributes significantly to air
pollution and has profound impacts on regional and global climate change, as well
as human health. SOA, as opposed to directly emitted particles, refers to those
particles formed from oxidation of gas-phase compounds followed by nucleation and/or gas-particle partitioning, as well as those modified by gas-phase oxidants
(e.g., O3, OH radical, and NO3 radical) through heterogeneous reactions within
their lifetime in the atmosphere. Investigations of SOA formation in the laboratory
have been carried out in batch reactors (e.g., environmental smog chambers) and
continuous flow reactors (e.g., oxidation flow reactors). Compared with the real
atmosphere, the reactors in the laboratory have boundaries and defined residence
times under different operation conditions. To better constrain the experimental
results and derive reliable parameters for aerosol models (e.g., yields of volatile
organic compounds), a full understanding of the role of the reactors on the gas-phase components and suspended particles is needed.
In this thesis research, a number of studies were carried out to understand the role
of the reactor itself on the behavior of SOA-forming systems. This includes the
effect of the Teflon-walled Caltech Environmental Chamber on vapor molecules
and characterization of the newly-built Caltech PhotoOxidation Flow Tube reactor
(CPOT) for atmospheric chemistry studies.
Vapor-wall interactions in Teflon-walled environmental chambers have been studied;
however, conflicting results existed in the literature concerning the basic timescales
of wall loss in environmental chambers. The competition between
vapor-particle and vapor-wall interactions determines the fate of vapor molecules in the
reactor. A unified theory and empirical equations have been developed in this thesis
to explain the observed vapor-wall interaction timescales. About 100 compounds
have been studied to verify this theory. In characterizing the flow reactor
perfor-mance, computational fluid dynamics (CFD) simulations have been combined with
residence time distribution (RTD) experiments, revealing, among others, the im-portance of the inlet design of the reactor and the effect of temperature gradients
on radial mixing in the reactor. An axial-dispersed plug flow reactor (AD-PFR)
model framework was developed as a basis on which to simulate photochemistry
occurring in the CPOT. An analytical solution for the cumulative RTD, which uses
dispersion condition inside the flow rector.
Since SOA formation involves interactions among gas-phase molecules, particle
surfaces and particle bulk phases, a state-of-the-art experimental technique
(field-induced droplet ionization mass spectrometry, FIDI-MS) and a comprehensive
model coupling gas-surface-aqueous multiphase transport and chemical reactions
have been applied to investigate the gas-phase OH initiated oxidation of pinonic
acid (PA) at the air-water interface. The interfacial oxidation mechanism has been
found to differ from that of homogeneous reactions, and the kinetics depend on both
OH diffusion from gas-phase to the interface and aqueous-phase reaction of pinonic acid + OH. The model calculation shows that, under typical ambient OH levels,
PA is oxidized exclusively at the air-water interface of droplets with a diameter of
5 µm, demonstrating the critical importance of air-water interfacial chemistry in
PUBLISHED CONTENT AND CONTRIBUTIONS
Huang, Yuanlong and John H. Seinfeld (2019). “A note on flow behavior in axially-dispersed plug flow reactors with step input of tracer”. In:Atmos. Environ.: X 1, p. 100006. doi:10.1016/j.aeaoa.2019.100006.
Y. H. performed experiments, derived solution, analyzed data, and wrote the paper for this project.
Huang, Yuanlong, Kevin M. Barraza, Christopher M. Kenseth, Ran Zhao, Chen Wang, J. L. Beauchamp, and John H. Seinfeld (2018a). “Probing the OH Oxidation of Pinonic Acid at the Air–Water Interface Using Field-Induced Droplet Ionization Mass Spectrometry (FIDI-MS)”. In: J. Phys. Chem. A 122.31, pp. 6445–6456. doi:10.1021/acs.jpca.8b05353.
Y. H. developed model, analyzed data, ran simulation, and wrote the paper for this project.
Huang, Yuanlong, Ran Zhao, Sophia M. Charan, Christopher M. Kenseth, Xuan Zhang, and John H. Seinfeld (2018b). “Unified Theory of Vapor–Wall Mass Transport in Teflon-Walled Environmental Chambers”. In:Environ. Sci. Technol. 52.4, pp. 2134–2142. doi:10.1021/acs.est.7b05575.
Y. H. developed model, conducted experiments, analyzed data, and wrote the paper for this project.
Kenseth, Christopher M., Yuanlong Huang, Ran Zhao, Nathan F. Dalleska, J. Caleb Hethcox, Brian M. Stoltz, and John H. Seinfeld (2018). “Synergistic O3 + OH
oxidation pathway to extremely low-volatility dimers revealed in β-pinene sec-ondary organic aerosol”. In:Proc. Natl. Acad. Sci. U.S.A.115.33, pp. 8301–8306. doi:10.1073/pnas.1804671115.
Y. H. assisted in filter sample collection and ran MCM simulation.
Zhang, Xuan, John Ortega, Yuanlong Huang, Stephen Shertz, Geoffrey S. Tyndall, and John J. Orlando (2018). “A steady-state continuous flow chamber for the study of daytime and nighttime chemistry under atmospherically relevant NO levels”. In: Atmos. Meas. Tech.11.5, pp. 2537–2551. doi:10.5194/amt-11-2537-2018. Y. H. wrote CSTR model to run MCM for this project.
Zhao, Ran, Christopher M. Kenseth, Yuanlong Huang, Nathan F. Dalleska, Xiaobi M. Kuang, Jierou Chen, Suzanne E. Paulson, and John H. Seinfeld (2018a). “Rapid Aqueous-Phase Hydrolysis of Ester Hydroperoxides Arising from Criegee Intermediates and Organic Acids”. In:J. Phys. Chem. A122.23, pp. 5190–5201. doi:10.1021/acs.jpca.8b02195.
Y. H. assisted in filter sample collection and did UV-Vis measurement.
pp. 2108–2117. doi:10.1021/acs.est.7b04863.
Y. H. assisted in filter sample collection and did UV-Vis measurement.
Huang, Yuanlong, Matthew M. Coggon, Ran Zhao, Hanna Lignell, Michael U. Bauer, Richard C. Flagan, and John H. Seinfeld (2017). “The Caltech Photooxi-dation Flow Tube reactor: design, fluid dynamics and characterization”. In:Atmos. Meas. Tech.10.3, pp. 839–867. doi:10.5194/amt-10-839-2017.
TABLE OF CONTENTS
Acknowledgements . . . iii
Abstract . . . ix
Table of Contents . . . xi
List of Illustrations . . . xii
List of Tables . . . xiii
Chapter I: Introduction . . . 1
1.1 Background and Motivation . . . 1
1.2 Organization of Thesis . . . 3
Chapter II: The Caltech Photooxidation Flow Tube Reactor - Design, Fluid Dynamics and Characterization . . . 5
2.1 Introduction . . . 5
2.2 Design and Experimental Setup . . . 8
2.2.1 CPOT Reactor . . . 8
2.2.2 Photolytic Environment . . . 10
2.2.3 Temperature Control in the Reaction Section . . . 11
2.2.4 Experimental Testing . . . 11
2.2.5 CFD Simulations . . . 12
2.2.6 Photochemical Model . . . 13
2.3 Design of the Flow Tube Reactor . . . 14
2.3.1 Injection Method . . . 14
2.3.2 Angle of the Diffuser . . . 16
2.3.3 Non-isothermal Effect . . . 20
2.4 Behavior of Gaseous and Particulate Species in a Laminar Flow Tube Reactor . . . 22
2.4.1 Fluid Field in the Reaction Section . . . 22
2.4.2 Penetration Efficiency (η) . . . 23
2.4.3 Residence Time Distribution (RTD) . . . 25
2.5 Results and Discussion . . . 28
2.5.1 Experimental Evaluation of Penetration Efficiency . . . 28
2.5.2 Experimental Evaluation of RTD . . . 30
2.5.3 Non-ideal Flow in the Reactor . . . 31
2.6 Photochemical Model . . . 35
2.6.1 Behavior of Species in the Models . . . 35
2.6.2 OH Exposure Calculation . . . 36
2.7 Conclusions . . . 39
2.8 Supporting Information . . . 42
2.8.1 Determination of Photon Fluxes . . . 42
2.8.2 Photochemical Reactions . . . 44
2.8.4 Diffusional Loss in A Laminar Cylindrical Tube . . . 48
2.8.5 Taylor Dispersion-Based RTD . . . 49
2.8.6 Particle Size Dependent RTDs . . . 50
2.8.7 List of Symbols . . . 52
2.8.8 List of Dimensionless Numbers and Subscripts . . . 53
Chapter III: A Note on Flow Behavior in Axially-Dispersed Plug Flow Reac-tors with Step Input of Tracer . . . 54
3.1 Introduction . . . 54
3.2 Formulation and Solution . . . 56
3.3 Experimental . . . 57
3.4 Results and Discussion . . . 59
3.5 Conclusions . . . 61
3.6 Supporting Information . . . 62
3.6.1 Derivation of PDE Solution . . . 62
3.6.2 Numerical Solution of the Danckwerts Boundary Problem . 66 Chapter IV: Unified Theory of Vapor-Wall Mass Transport in Teflon-Walled Environmental Chambers . . . 68
4.1 Introduction . . . 68
4.2 Two-Layer Kinetic Sorption Model . . . 69
4.2.1 Surface Layer . . . 69
4.2.2 Inner Layer . . . 71
4.2.3 Governing Equations Describing Uptake of Vapor Molecules in the Two-Layer Model . . . 71
4.2.4 Aqueous Film Model . . . 77
4.3 Experimental Study of Vapor-Wall Uptake . . . 77
4.4 Results and Discussion . . . 79
4.4.1 Effect of Oxidation Period on Vapor-Wall Partitioning . . . . 79
4.4.2 Diffusion in Teflon Polymer . . . 82
4.4.3 Humidity Effect . . . 83
4.4.4 Mechanistic Representation of Vapor-Wall Deposition . . . . 85
4.4.5 Atmospheric Implications . . . 87
4.5 Supporting Information . . . 89
4.5.1 Gas-Phase Boundary Layer Transport . . . 89
4.5.2 Activity and Accommodation Coefficients . . . 93
4.5.3 Analytical Solution for the Kinetics of the System G −−−→k0 X−−−)−−−k1* k– 1 Y . . . 102
4.5.4 Fresh versus Aged Teflon Chambers . . . 103
4.5.5 Humidity Effect on Teflon Inner Layer Diffusivity . . . 105
4.5.6 Exact and Approximate Solutions for the Kinetics of the System X−−−)k1−−−* k– 1 Y k2 −−−→Z . . . 106
4.5.7 Application in Chamber Simulations . . . 108 Chapter V: Probing the OH Oxidation of Pinonic Acid at the Air-Water
5.1 Introduction . . . 109
5.2 Methods . . . 111
5.2.1 Experimental Setup . . . 111
5.2.2 Diffusion-Reaction Interfacial Model . . . 113
5.3 Results and Discussion . . . 118
5.3.1 OH Oxidation of Pinonic Acid Droplet . . . 118
5.3.2 Characterization of Gas-Phase OH Concentration . . . 120
5.3.3 Kinetics of Interfacial OH Oxidation of Pinonic Acid . . . . 124
5.3.4 Atmospheric Implications . . . 126
5.4 Conclusions . . . 129
5.5 Supporting Information . . . 131
5.5.1 Model Description . . . 131
5.5.2 Surface Coverage of PA at Surface-Bulk Equilibrium . . . . 135
5.5.3 Air-Surface-Water Equilibrium Constants . . . 137
5.5.4 Evaporation of PA from Droplet . . . 139
5.5.5 Identification of PA + OH Products . . . 141
5.5.6 SDS + OH Fitting . . . 142
5.5.7 PA + OH and SDS + OH Fitting . . . 143
5.5.8 Droplet Simulation . . . 144
Chapter VI: Conclusions and Future Work . . . 146
Appendix A: Iodometry-Assisted Liquid Chromatography Electrospray Ion-ization Mass Spectrometry for Analysis of Organic Peroxides: An Appli-cation to Atmospheric Secondary Organic Aerosol . . . 148
Appendix B: A steady-state continuous flow chamber for the study of daytime and nighttime chemistry under atmospherically relevant NO levels . . . . 159
Appendix C: Rapid Aqueous-Phase Hydrolysis of Ester Hydroperoxides Aris-ing from Criegee Intermediates and Organic Acids . . . 175
LIST OF ILLUSTRATIONS
Number Page
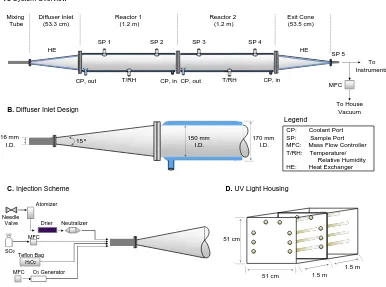
2.1 Overall schematic of the Caltech PhotoOxidation flow Tube (CPOT).
(A) The inlet design. (B) The injection scheme. (C) Schematic for
the housing chamber. (D) UV lamps. . . 9
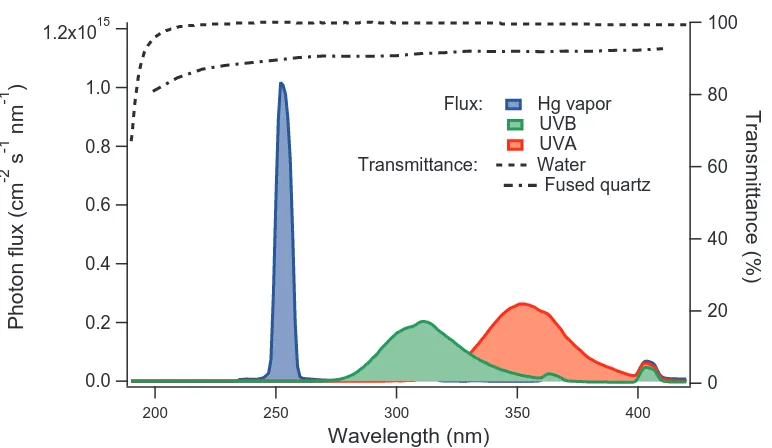
2.2 Photon fluxes inside the reactor, as well as the transmittance of water
and fused quartz (Beder et al., 1971). . . 10
2.3 (A) Overview of the geometry used to simulate flow and species
transport within the CPOT. (B) Inlet meshing for static mixer. (C) Schematic illustration of the temperature gradient used in non-isothermal
simulations. . . 12
2.4 Inlet designs exemplified by (A) straight tube injection, (B)
shower-head injection, and (C) diffuser injection. Uavg,injection, Uavg,bulk, and
Uavg,i values denote the average velocities at the inlet, in the bulk reaction section, and at the exit of a showerhead hole, respectively.
Inlet (A) also illustrates the "fire hose" effect, as demonstrated by the
visualization of smoke in a Pyrex glass tube. . . 15
2.5 COMSOL simulation results for a suite of diffuser angles assuming isothermal conditions. Images in the left column are from simulations
conducted in the absence of a static mixer. Images in the right column
are from simulations employing a 2-element static mixer upstream
of the diffuser cone. The red traces are streamlines demonstrating
the flow pattern of fluid introduced upstream of the static mixer. The
blue surfaces illustrate regions where the axial velocity < 0 m s−1.
Together, these traces illustrate the recirculation zone. ∆z is the
length that the recirculation zone penetrates into the reaction section.
2.6 COMSOL simulated velocity field at the reactor inlet under
isother-mal conditions. Simulations were performed for the actual CPOT design: a 15° diffuser cone coupled to a static mixer. The velocity
magnitude at various axial positions is shown in (A), and 1D axial
velocity profiles within the "inlet-affected" region are shown in (B).
The velocity magnitude in (B) is presented on the axis below each
ve-locity profile. Note that DL = Diffuser Length (53.3 cm). (C) shows
the normalized residence time of vapor molecules and monodisperse
particles at various axial positions. A 30 s square wave pulse is used
as the input. . . 19
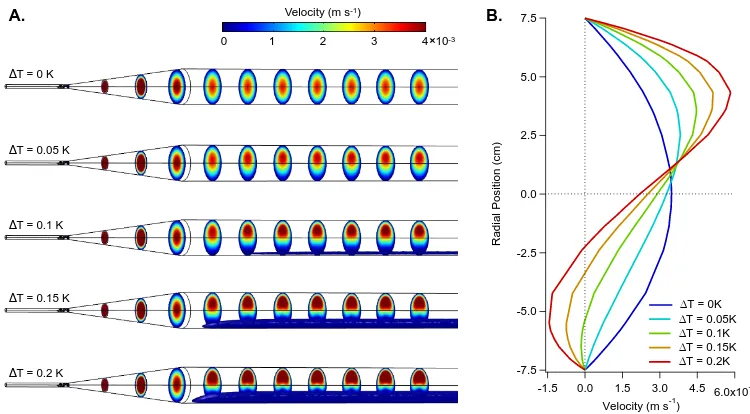
2.7 COMSOL simulated flow profiles as a function of reactor wall tem-perature gradient∆T. (A) 3D simulation results demonstrating
cross-sectional velocity profiles and consequential recirculation zones (blue
isosurface). (B) 1D velocity profiles at axial positionz= 150 cm. . . 22
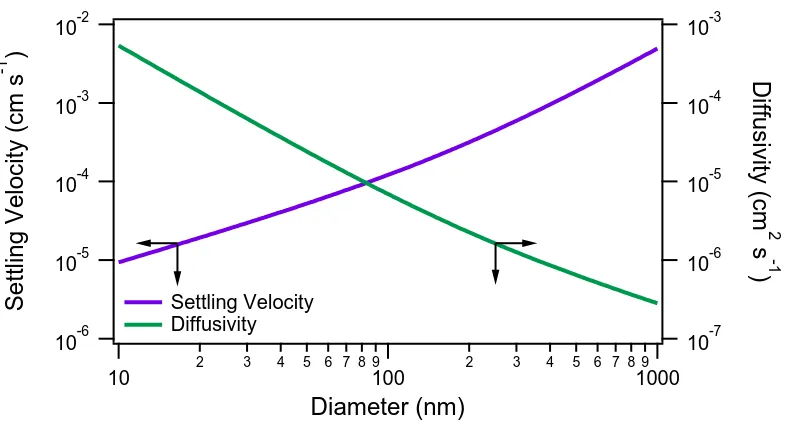
2.8 Particle settling velocity and Brownian diffusivity for spherical
par-ticles of unit density as a function of particle diameter (J. H. Seinfeld
and S. N. Pandis, 2016). . . 23
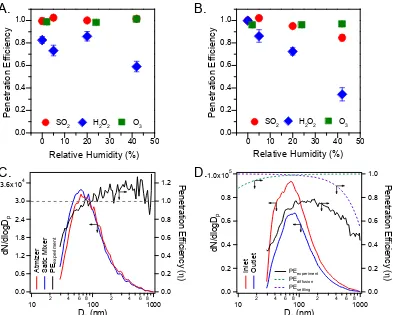
2.9 Penetration efficiency (η) of gases and particles in the static mixer
and the flow tube. (A) Relative humidity (RH) dependentη of SO2,
H2O2, and O3in the static mixer. (B) RH dependentηof SO2, H2O2,
and O3 in the flow tube. Error bar indicates the measured
uncer-tainty. (C) Measured ammonium sulfate particle size distributions
before and after the static mixer, as well as theηderived from these
measurements. The gray dashed line indicatesη= 1, i.e. no particle loss. (D) Measured ammonium sulfate particle size distributions at
the inlet and outlet of the flow tube, as well as the η derived from
these measurements. The calculated η with respect to particle
dif-fusion loss (Eq. (2.4)) and gravitational settling (Eq. (2.34)) are
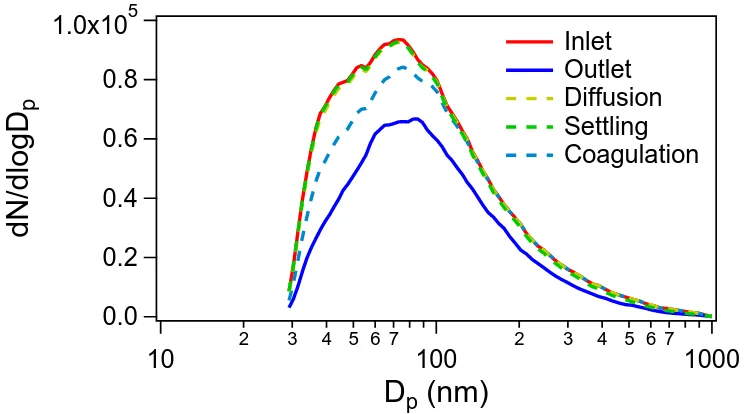
2.10 Particle size distributions at the outlet when diffusion, gravitational
settling, and coagulation precosses are coupled separately with the size distribution at the inlet. The measured size distribution at the
outlet is plotted as a reference. The coupling of diffusion and
gravita-tional settling with the inlet size distribution is the product of dashed
lines and the red line in Fig. 2.9D. The coagulation process is
cal-culated in a coagulation model, which uses a PFR model with an
average residence time of 1520 s by assuming a unity coagulation
efficiency and no wall deposition. The coagulation model input is the
size distribution at the inlet. . . 25
2.11 Experimental and COMSOL simulated residence time distributions of (A) O3vapor molecules and (B) polydisperse ammonium sulfate
particles. The diffusivity used in COMSOL for O3is that for a generic
gas-phase species 1×10⁻⁵m2s−1and for particles is 1×10⁻⁹m2s−1 corresponding to a particle size of∼100 nm. The average residence time in each case is compared in the insets as reference. . . 26
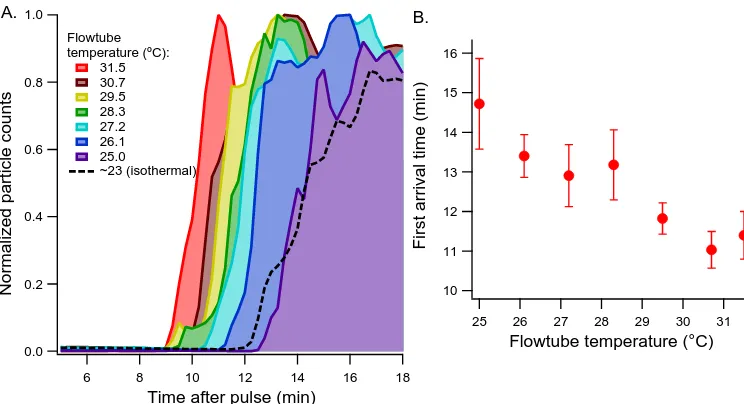
2.12 Non-isothermal effects on particle RTD. The water jacket temperature
was raised systematically against the room temperature (∼23 °C). (A) Normalized ammonium sulfate particle counts recorded at the exit
are plotted against time after a pulse is introduced at the inlet. The experiment at each temperature is repeated 3 to 4 times. The results
from a set of isothermal experiments are also included (dashed line)
for reference. (B) Arrival times of the first major peak of each
experiment. . . 32
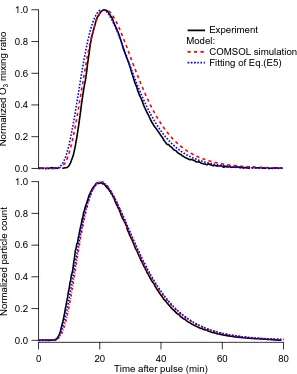
2.13 Comparison of experimentally determined RTD of (A) O3 vapor
molecules and (B) polydisperse ammonium sulfate particles to
opti-mized simulation results employing an eddy-like diffusivity (De) in
the Taylor dispersion model. The COMSOL simulation employs an
optimal De values of 4.5×10⁻⁴ m2 s−1for O3and 6.0×10⁻⁴m2 s−1
for particles. The fittings of Eq. (2.27) employs the same optimal
De, as well as an optimal average velocity (Uavg,fit) of 2.1×10⁻³ m
2.14 1D photochemical model using axially-dispersed assumption
(AD-PFR, solid line) and plug flow assumption ((AD-PFR, dashed line). 1 ppm H2O2 and 100 ppb SO2 at RH = 5% and T = 295 K is used in the
simulation. Hg vapor (purple), UVB (green), and UVA (red) lamps
at full emission are used to drive the photochemical reactions. (A)
Axial profile of H2O2, (B) Axial profile of SO2, and (C) Axial profile
of OH. . . 36
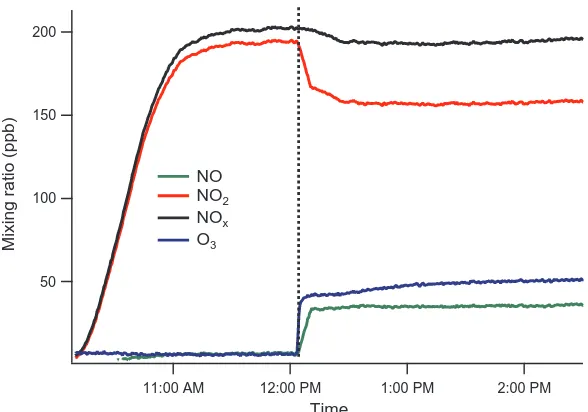
2.15 The temporal profiles of NO2, NO, NOx and O3 at the end of the
CPOT during a NO2 photolysis experiment. The lamps were turned
on at the time indicated by the dashed line. . . 43
2.16 Particle trajectories in a vertical plane in a laminar flow tube. Particles are of the same size and are subject to gravitational settling and
fluid advection. The Cartesian coordinate framework is indicated.
Two different cases are shown: blue particles are those that can
successfully penetrate through the tube, while red particles eventually
deposit on the tube wall. . . 51
2.17 Theoretical residence time distribution (Eq. (2.32)) and
penetra-tion efficiency (Eq. (2.34)) of particles with different diameters in
a horizontal flow tube. Only gravitational settling and convection
are considered. The simulation assumes a uniform distribution of monodisperse particles at the entrance of a well-developed laminar
flow with no interaction between particles. Each point corresponds
to the residence time and the initial position of the particle. The color
bar indicates the residence time (min). The open space between the
dashed curve and the tube wall indicates the region in which particles
have deposited on the tube wall (η = 0%). The residence time of purely convective, non-diffusing particles (Eq. (2.35)) is shown for
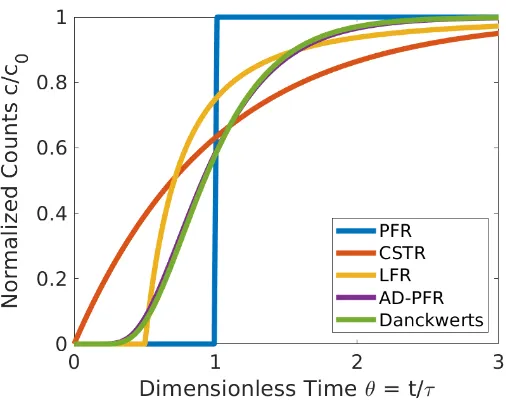
3.1 Theoretical temporal profiles (F-curve) of the tracer emerging from
a flow reactor as described in different models. The analytical di-mensionless expression for PFR is FPFR(θ) = H(θ −1), for CSTR is FCSTR(θ) = 1− exp(−θ), for tubular LFR is FLFR(θ) = H(θ −
1 2)(1−
1
(2θ)2), for AD-PFR is Eq. (3.4) (Pe = 10), and for Danckwerts
AD-PFR is numerical simulation (Pe = 10), where H(x −a) is the Heaviside step function, i.e., H(x−a)= 0 as x < a,H(x−a)=0.5 asx =a, andH(x−a)= 1 asx > a. Note thatF-curves for AD-PFR and Danckwerts AD-PFR are similar when axial dispersion (Pe) is
the same. . . 58
3.2 Experimental setup. . . 58 3.3 Experimental profiles with pulse injection (green circles) fitted by
Eq. (3.3) (red solid line) and step input (blue circles) fitted by
AD-PFR model (Eq. (3.4), magenta solid line) as well as the Danckwerts
boundary condition model (Eq. (3.5)&(3.6), cyan dashed line). . . . 59
3.4 Figure A.1: Bromwich integral path over complex plane. . . 63
4.1 Two-layer (dry) and three-layer (moist) models of vapor uptake at the
surface of Teflon film in a laboratory chamber. (A) Two-layer kinetic
sorption model. veandvc are gas-phase boundary layer and
interfa-cial mass transport coefficients, respectively. Cgb(t)is the bulk gas-phase concentration, Cs(t) is the concentration (assumed to rapidly achieve uniformity) within the Surface Layer, andCi is the transient
concentration in the Inner Layer. The vapor-Teflon wall equilibrium
constant,Kw, plays a role similar to that of a Henry’s law dissolution
constant. Timescales, τbulk, τsurf, and τinner, corresponding to each
layer are indicated. (B) Vapor uptake process in the presence of a thin
aqueous film on the Teflon wall. Assumption of H Kw, whereH is the corresponding Henry’s law constant, is made. Caq(t)denotes the concentration of dissolved vapor in the aqueous film. LeandLaq
4.2 Deviation from equilibrium state at the end of oxidation periodτoxas
a function of equilibrium constant KwA
VLe and oxidation periodτox
for the system represented by G −−−→k0 X −−−)−−−k1*
k– 1 Y, where k0 =
0.05 τox
(s−1, assume 5% of G is consumed at the end of oxidation periodτox),
k1= A Vvl(s
−1), k – 1=
1
LeKwvl (s
−1), A
V is the surface area to volume
ratio of the chamber (m−1), vl is the vapor-to-wall mass transport
coefficient (m s−1), Le is the surface layer thickness (m), Kw is the
dissolution equilibrium constant of vapor molecule in Teflon film.
The equilibrium constantKeq = k1 k−1 =
KwA
VLe. . . 80
4.3 (A) Diffusivity in FEP film inferred from measurements by Xuan
Zhang et al. (2015) using CIMS and from this study using GC/FID
as a function of saturation concentration (c∗) predicted by
EVAPO-RATION (Compernolle et al., 2011; Tropo, 2014). (B) Comparison between measured and fitted diffusivity (Deff in m2 s−1) in Teflon
film. The molecular volume (θ in cm3mol−1) and saturation vapor
concentration (c∗inµg m−3) dependent fitting equation in (B) is used.
Molecular volume is estimated by summing the characteristic atomic
volumes (θ= C×16.35 + H×8.71 + O×12.43 + N×14.39 cm3mol−1, where C, H, O, and N represent the number of carbon, hydrogen,
oxy-gen, and nitrogen atoms in the compound)(Abraham and McGowan,
1987). Note: this equation applies only for molecules with volume
exceeding 110.9 cm3mol−1. . . 82 4.4 Signal decay after 20 s of in situ generation of isoprene oxidation
products: (A) C5H8O2 and (B) C5H9O4N at RH = 5%, 50% and >
90% (with aqueous film). Because of the signal decay caused by the
“memory effect” arising from the sampling tube and instrument inlet
4.5 Empirical relationship between compound molecular diffusivity Deff
(m2s−1) and relative inner layer mass transport rate constant k2(s−1).
k2 is derived by fitting the analytical solution in Section 4.5.5 to
the experimental data, whereas data points from the literature (Bates
et al., 2014; C. L. Loza et al., 2014; Christine L. Loza et al.,
2010; Praske et al., 2015; R. H. Schwantes et al., 2017b, 2015;
Manabu Shiraiwa et al., 2013; St. Clair et al., 2016) are calculated
by the asymptotic relationship between kw (reported data) and k2.
Diffusivity is predicted by the equation in Fig. 4.3. . . 86
4.6 Timescale for gas-phase concentration to reach 95% of the
4.7 Panel (A) Activity coefficients γ∞ in FEP film calculated from the
literature (Krechmer et al., 2016; Matsunaga and Ziemann, 2010; Yeh and Ziemann, 2014, 2015) as a function of vapor saturation
con-centration (c∗) estimated by EVAPORATION (Compernolle et al.,
2011; Tropo, 2014). Raw data used to calculate γ∞ are provided
in Table 4.2. n-alkanes and 1-alkenes (green) are from Matsunaga
and Ziemann (2010). 2-ketones, 2-alcohols, monoacids, and
1,2-diols (magenta) are from Yeh and Ziemann (2015). Alkylnitrates
(cyan) are from Yeh and Ziemann (2014). I–-CIMS (red) and NO3–
-CIMS (blue) are from Krechmer et al. (2016). SIMPOL.1 (J. F.
Pankow and Asher, 2008) predicts vapor pressure by summation of group contributions, and EVAPORATION considers group position
effect for multifunctional isomers. The difference in vapor pressure
estimated by these two methods is within a factor of 2 ∼ 3. For multifunctional isomers, all HNs (Krechmer et al., 2016)
(hydrox-ynitrates) are 1-OH-5-alkylnitrates, DHNs (dihydrox(hydrox-ynitrates) are
1,5-OH-2-alkylnitrates, THNs (trihydroxynitrates) are
1,2,5-OH-6-alkylnitrates, and DHCNs (dihydroxycarbonylnitrates) are
1,2-OH-5-carbonyl-6-alkylnitrates. Measurements by I–-CIMS (Krechmer
et al., 2016) are thought to be biased by “memory” effects arising from sampling tube and instrument inlet; thus, they are excluded in
the fitting. Panel (B) Fraction Fg at vapor-wall equilibrium
remain-ing in the gas phase (Krechmer et al., 2016) as a function of γ∞c∗.
Fg = 1
1+Cw/(γ∞c∗), where Cw = 32.2 mg m
−3 corresponding to
4.8 Accommodation coefficient of vapor molecules on the Teflon wallαw
versus saturation concentrationc∗. Data are from the Ziemann group (Matsunaga and Ziemann, 2010; Yeh and Ziemann, 2014, 2015). An
empirical relationship is fitted to the data points. The critical αw
point (McMurry and Grosjean, 1985) (5.12×10⁻⁶, corresponding to ke = 0.03 s−1, marked by an arrow) is that at which the rate of mass transport to the wall shifts from the gas-phase boundary
layer diffusion regime (green area) to the interfacial accommodation
regime (blue area). The fitted line indicates that the compounds
studied by Krechmer et al. (2016) (c∗ in the range of 10−2−104 µg m−3) lie in the gas-phase boundary layer diffusion regime. . . 96 4.9 Ratio of inferred diffusivity in fresh to aged Teflon film as well as that
at 45◦C to 20◦C as a function of saturation concentrationc∗. Since
the wall accommodation coefficient,αw, at 45◦C is assumed the same
as that at 20◦C, the smaller inferred diffusivity at 45◦C could also be
caused by lowerαw at higher temperature. . . 104
4.10 Inferred Diffusivity Deff (m2 s−1) in FEP Teflon film as a
func-tion of saturafunc-tion concentrafunc-tion c∗ (µg m−3) at different relative
humidities for alcohols (C6-C12 1-alcohols), alkanes (C12-C14
n-alkanes and n-octylcyclohexane), aromatics (toluene, m-, o-xylene, and 1,3,5-trimethylbenzene), and biogenic compounds (isoprene,
MACR, MVK, and α-pinene). . . 105
5.1 Schematic of FIDI-MS for oxidation studies, as viewed from the
side. a: A droplet hanging between two parallel plate electrodes.
b: A snapshot of the elongated droplet when the pulsed voltage is
employed to the plate electrodes. . . 112
5.2 Multiphase transport and reaction model for OH reaction with sodium
dodecyl sulfate (SDS) and pinonic acid (PA) at the air-water
5.3 Pinonic acid (PA) oxidation at the air-water interface by gas-phase
OH detected by FIDI-MS OH exposure. a. 0 s; b. 10 s; c. 20 s; d. 30 s. m/zof identified products are as follows: I = 197, II = 199, III = 213, IV = 215, V = 229, and VI = 231. Mass spectra are reported
as averages of replicate samples (N = 5). The peak intensities in b,
c, and d have been normalized with respect to the peak intensity of
[PA – H]– in a. . . 118
5.4 Mechanism of OH-initiated oxidation of PA under NO-dominant
conditions. . . 121
5.5 Experimental and fitted results of the OH oxidation of the SDS
droplet. a. Temporal profiles of SDS coverage (blue dots, measured values averaged by 5 repeats; blue line, fitting result) and the
model-ing gas-phase OH concentration above the surface (orange line). b.
Temporal profiles of 8 generations of SDS + OH products (lines are
fitting results and dots are experimental results). c. Temporal
pro-files of predicted OH uptake coefficient (blue line) and the average
number of oxygen atoms incorporated into SDS via OH oxidation
(orange dots, measured values averaged by 5 repeats; orange line,
fitting result). d. Calculated OH uptake coefficient and the gas-phase
OH concentration above the surface as a function of the optimally fitted surface reaction rate constant for SDS + OH system. Yellow
dot represents the value adopted in this study and cyan background
marks the gas-phase diffusion limit regime for the determination of
kOH+SDS
surf . . . 122
5.6 Experimental and simulation results of the OH oxidation of the
mix-ture of PA and SDS droplet. a. Mass spectra of the sampling under
different OH exposure (left is the PA regime and right is the SDS
regime). b. Temporal profiles of the surface coverage of PA and
SDS. Dots represent experimental measurements (averaged by 5 re-peats) and lines represent simulated results. c. Predicted temporal
profiles of the OH uptake coefficient and the gas-phase OH
concen-tration. d. Simulated bulk aqueous-phase OH distribution at different
5.7 Simulated multi-phase OH oxidation of PA in droplets of 5 µm (a)
and 100 µm (b), with an overall PA concentration of 0.5 nmol m−3 under typical ambient conditions (gas-phase OH concentration∼106 molec cm−3). a and b: Fraction of the overall quantities of PA and PA
products that resides on the surface, in the bulk aqueous phase, and
in the gas phase. c: Predicted bulk aqueous-phase distribution of OH
at different OH exposure times by M1 (solid lines: 5 µm droplets,
dashed lines: 100 µm droplets). d: Temporal profiles of overall PA
as exposed to OH. . . 128
5.8 Equilibrium surface coverage (θe) and surface-to-volume quantity
ratio (S/V) of PA as a function of the droplet radius in a droplet system of an average concentration of 50 µM. . . 136
5.9 Correlation of COSMOtherm predicted log10Ksgwith experimental
(Hartkopf and Karger, 1973; Roth et al., 2002) log10Ksg at 15 °C.
van ’t Hoff equation is applied to estimate Ksgat 25 °C by assuming
a constant ∆H between 15 and 25 °C, under which assumption the
derived relationship remains the same. . . 138
5.10 Experimental results of the signal of surface PA on the hanging
droplet at different exposure time. . . 139
5.11 Simulation of PA evaporation when a droplet (radius = 1 mm) PA solution (150 µM) is exposed to ambient with zero gas-phase PA. a)
Surface coverage of PA as a function of time at different bulk aqueous
diffusivity. b) Bulk PA distribution along the radius at different
exposure time when Db,PA = 10−9 m2 s−1. c) Bulk PA distribution
along the radius at different exposure time when Db,PA = 10−10 m2
s−1. d) Bulk PA distribution along the radius at different exposure
time when Db,PA= 10−11m2s−1. . . 140
5.12 Experimental results of the CID (collision induced dissociation)
sig-nal of the 6 major PA products with proposed structures. . . 141 5.13 Temporal profiles of the relative peak area intensities of PA and its
products . . . 141
5.14 Mass spectra of SDS + OH oxidation at exposure time (0 s, 10 s,
20 s, and 30 s), reported as averages of replicate samples (N = 5).
The peak intensities have been normalized with respect to the highest
5.15 a) Inverse relationship between optimally fitted surface reaction rate
constant for SDS + OHksurfOH+SDSand the OH surface coverageθOH. b)
Simulated bulk aqueous-phase OH distribution at different exposure
times. . . 142
5.16 a) Experimental and fitting results of the average number of oxygen
atoms incorporated into SDS products on the suspended droplet as a
function of the exposure time. b) Simulated bulk aqueous-phase PA
distribution at different exposure times. . . 143
5.17 a) Ratios of the fractions of PA in the gas phase and in the bulk aqueous
phase to that on the surface, as well as the number concentration of the
droplet as functions of the droplet diameter. b) Simulated temporal profiles of OH uptake coefficients on the surface of droplets of 5 µm
LIST OF TABLES
Number Page
2.1 Simulated OH exposure under full light emission . . . 39
2.2 Photolysis reactions in OH generation . . . 44
2.3 Reactions in OH generation and SO2oxidation . . . 44
4.1 Parameters Representing Vapor-Wall Deposition in Chambers . . . . 75 4.2 Literature data used to calculated activity coefficientγ∞and
accom-modation coefficientαw . . . 97
5.1 Parameters and Reaction Rate Constants Used in This Work . . . 117
C h a p t e r 1
INTRODUCTION
1.1 Background and Motivation
Particulate matter (PM) suspended in the atmosphere can scatter/absorb solar
radi-ation, act as cloud condensation nuclei, impacting the climate directly or indirectly
(IPCC, 2013). PM2.5refers to particles with a diameter smaller than 2.5µm, which
can profoundly damage human health since they can penetrate into deep stages of
the lung (EPA, 2016). During PM lifetime in the atmosphere, particles interact with
each other as well as the gas molecules/radicals surrounding them. Thus the
prop-erties (e.g., chemical composition, size, and phase state etc.) of these suspended
particles are always changing.
The term aerosol is used to describe a relatively stable system of solid or liquid
fine particles surrounded by gas molecules. Secondary organic aerosols (SOA)
refer to those sub-micrometer particles containing a large mass fraction of organic
compounds (Jimenez et al., 2009) that are formed through gas-particle partitioning
or modified by multi-phase oxidation, compared with those from direct emission
(primary organic aerosols, POA). The physicochemical properties of SOA in the
atmosphere are complex, constantly changing, and have profound effects on climate
and human health (Pope III et al., 2002). The formation and evolution of SOAs
depend on gas-phase oxidants and volatile organic compounds (VOCs), and the particle-phase compositions and viscosities (George and Abbatt, 2010). We are
interested in learning how these properties evolve so we can predict and evaluate
their effect on air pollution and regional/global climate by models. Aside from
direct field observations of SOAs, extensive laboratory studies have focused on the
formation of SOA and parameterizing the key processes that can be used in chemical
transport models.
The laboratory studies of SOA formation are usually carried out in atmospheric
reactors, which, depending on the research purpose can be divided into batch mode and continuous mode. The batch-mode atmospheric reactor is best known as the
environmental smog chamber, which is usually made of chemically inert materials
(e.g., Teflon film), but without rigid boundaries so the pressures inside and outside
have rigid boundaries, so as the sampling goes on, some gas flux has to be added to
keep the pressure inside the reactor constant. Based on the fluid dynamics, ideally, the continuous-mode reactor can be divided into continuously stirred tank reactor
(CSTR) and plug flow reactor (PFR). For a batch-mode reactor, the reactants and
products evolve with time, which is most similar to the real atmosphere where the
components of an air parcel change over time; while a continuous-mode reactor
usually runs at a steady state so one can examine closely the mechanisms under
a specific condition. The other important aspect for these two modes is the effect
of walls. The walls of a reactor can bias the quantitative results from a
batch-mode reactor if one does not account for them since the boundaries keep interacting
with both vapors and particles inside the reactor. In contrast, for continuous-mode reactors, wall effects are less critical since the system is at a steady state. However,
there are also some special reactors that do not belong to either type. For example,
the Cosmics Leaving Outdoor Droplets reactor (CLOUD, 2019) has rigid boundaries
(stainless steel) and is running at a continuous mode but since the residence time is
long relative to the reaction time, the system can be treated as a batch-mode reactor.
The Caltech Atmospheric Chemistry Laboratory has a dual environmental smog
chamber (batch mode), which has made great contributions to the community by
providing one of the important parameters for SOA formation to regional and global transport models, i.e., the yields of various precursor VOCs. To get a reliable value
of VOC yield, one has to account for wall effects carefully. In this thesis, efforts
have been taken to parameterize the wall effect on gas-phase vapors in a batch-mode
Teflon-walled reactor. In addition, this thesis considers the continuous flow reactor,
which is a complementary reactor to the chamber reactor. Besides characterizing
the reactors by experiments, this thesis emphasizes developing models so one can
either make predictions to compare with the data or retrieve key parameters from
1.2 Organization of Thesis
In Chapter 2, we present the design and characterization of the Caltech
PhotoOxida-tion flow Tube reactor (CPOT). We show how computaPhotoOxida-tional fluid dynamics (CFD)
simulation can help design the inlet of a flow reactor. By comparing the residence
time distributions (RTD) determined by the CFD simulation with those measured
by experiments, we learn that temperature inhomogeneity can cause recirculation inside the flow reactor. We propose an axial-dispersed plug flow reactor (AD-PFR)
to simplify the 3D flow reactor into a 1D model framework by parameterizing the
inevitable turbulence as an eddy diffusivity. We also measure the particle
trans-mission efficiency as a function of particle size under dry conditions. The CPOT
is designed to run experiments at steady state under specific conditions that can
perform a much higher exposure (reagent concentration × residence time) than a chamber reactor. We further propose a correction factor to calculate the exposure
under the AD-PFR framework.
In Chapter 3, based on the studies in Chapter 2, we propose a new method to retrieve
the eddy diffusivity inside a flow reactor. Instead of measuring the RTDs by pulse
injection of species, one can take advantage of the data during the transition time,
i.e., the data from the beginning of the experiment before the system reach steady
state. We derive an analytical expression for this accumulative RTD and verified that
the eddy diffusivity derived from this method is∼50% higher than that derived from pulse RTDs. We suggest using accumulative RTD to determine the eddy diffusivity,
since it can better reflect the working condition of the flow reactor.
In Chapter 4, we present a study quantifying chamber wall effect on vapors.
Com-pared with the real atmosphere, all the experiments in the lab must address such wall
interactions because the air parcel is not as free as those ambient ones. The
interac-tion between vapor molecules and the Teflon-walled environmental chamber can be
described as a multi-step dissolving process. In this chapter, we propose a unified
model to describe two significantly different dissolving timescales. In this model,
the vapor-wall interaction is described as kinetically dissolving in a thin surface
layer and then diffusing into the deep layer. Over 100 compounds have been used
to develop and test this model. By parameterizing the vapor-wall accommodation coefficient and the activity coefficient, this model can be easily incorporated into
the chamber models.
In Chapter 5, a multi-phase transport and reaction model is developed to derive
air-water interface. In this chapter, we build a model that can be used to simulate
multi-phase (gas-interface-aqueous phases) mass transport and reaction with the experimental technique called field induced droplet ionization mass spectrometry
(FIDI-MS) that focuses on in-situ air-water interfacial reaction and detection. The
model framework follows the PRA definition (Pöschl et al., 2007). By introducing
the interfacial reaction into the traditional gas-aqueous phase reaction model, we
demonstrate that the air-water interfacial multi-phase reactions could be an important
sink for surface-active and OH-reactive organic species in the atmosphere through
C h a p t e r 2
THE CALTECH PHOTOOXIDATION FLOW TUBE REACTOR
-DESIGN, FLUID DYNAMICS AND CHARACTERIZATION
Huang, Yuanlong, Matthew M. Coggon, Ran Zhao, Hanna Lignell, Michael U. Bauer, Richard C. Flagan, and John H. Seinfeld (2017). “The Caltech Photooxi-dation Flow Tube reactor: design, fluid dynamics and characterization”. In:Atmos. Meas. Tech.10.3, pp. 839–867. doi:10.5194/amt-10-839-2017.
Abstract
Flow tube reactors are widely employed to study gas-phase atmospheric chemistry and secondary organic aerosol formation. The development of a new laminar-flow
tube reactor, the Caltech PhotoOxidation flow Tube (CPOT), intended for the study of
gas-phase atmospheric chemistry and secondary organic aerosol (SOA) formation,
is reported here. The present work addresses the reactor design based on fluid
dynamical characterization and the fundamental behavior of vapor molecules and
particles in the reactor. The design of the inlet to the reactor, based on computational
fluid dynamics (CFD) simulations, comprises a static mixer and a conical diffuser to
facilitate development of a characteristic laminar flow profile. To assess the extent to
which the actual performance adheres to the theoretical CFD model, residence time distribution (RTD) experiments are reported with vapor molecules (O3) and
sub-micrometer ammonium sulfate particles. As confirmed by the CFD prediction, the
presence of a slight deviation from strictly isothermal conditions leads to secondary
flows in the reactor that produce deviations from the ideal parabolic laminar flow.
The characterization experiments, in conjunction with theory, provide a basis for
interpretation of atmospheric chemistry and secondary organic aerosol studies to
follow. A 1D photochemical model within an axially dispersed plug flow reactor
(AD-PFR) framework is formulated to evaluate the oxidation level in the reactor.
The simulation indicates that the OH concentration is uniform along the reactor, and an OH exposure (OHexp) ranging from ∼ 109 to ∼ 1012 molecules cm−3 s can be
achieved from photolysis of H2O2. A method to calculate OHexpwith a consideration
2.1 Introduction
Experimental evaluation of atmospheric chemistry and aerosol formation is typically
carried out in laboratory reactors. Such reactors comprise both chambers and flow
reactors. The flow tube reactor has emerged as a widely-used platform (Bruns et al.,
2015; Chen et al., 2013; Ezell et al., 2010; Kang et al., 2007, 2011; Karjalainen
et al., 2016; Keller and Burtscher, 2012; Khalizov et al., 2006; Lambe et al., 2011a, 2015, 2011b, 2012; R. Li et al., 2015; Ortega et al., 2013, 2016; Palm et al., 2016;
Peng et al., 2016, 2015; Simonen et al., 2017; Tkacik et al., 2014).
The flow tube reactor is generally operated under steady-state conditions. An
at-tribute of the flow tube reactor is that, by control of the inlet concentration and
oxidation conditions, it is possible to simulate atmospheric oxidation under
condi-tions equivalent to multiple days of atmospheric exposure with a reactor residence
time over a range of minutes. It should be noted that the chemistry occurring in
such a highly oxidizing environment may differ from that in the atmosphere and batch chamber, even though no discrepancy between the components of the SOA
generated in the flow tube reactor and the batch chamber has yet to be reported
(Lambe et al., 2015). Moreover, under the steady state operating conditions, it is
possible to accumulate sufficient products for detailed analytical evaluation. Key
factors relevant to atmospheric processes, such as gas-phase kinetics (Donahue et
al., 1996; Howard, 1979; Thornton and Abbatt, 2005), nucleation rates (Mikheev
et al., 2000), uptake coefficients of vapors on particles (Matthews et al., 2014), and
heterogeneous reactions on particle surfaces (George et al., 2007), can be evaluated
via flow tube studies.
Since the concept of Potential Aerosol Mass (PAM) was proposed, the PAM reactor,
operated as a flow tube reactor, has been widely used in laboratory and field studies
of SOA formation (Chen et al., 2013; Kang et al., 2007, 2011; Keller and Burtscher,
2012; Kroll et al., 2009; Lambe et al., 2011a, 2015, 2012; Ortega et al., 2013, 2016;
Palm et al., 2016; Slowik et al., 2012; Smith et al., 2009). A powerful attribute of the
PAM and subsequent flow reactors is the capability to generate hydroxyl radical (OH)
levels that lead to integrated OH exposure ranging as high as∼1012molecules cm−3 s, at which it is possible to simulate atmospheric oxidation conditions comparable to those occurring over∼1 week. Chemical kinetic modeling studies have investigated the free radical chemistry in the oxidation flow reactor (OFR) (e.g., R. Li et al., 2015;
Peng et al., 2016, 2015).
gener-ating the oxidizing environment. Each specific design aspect of a flow reactor can
significantly affect both the fluid dynamics and the chemistry within the reactor. For example, the design of the inlet to the reactor determines the extent of initial mixing
of the reactants as well as the development of concentration profiles in the reactor.
The classical flow tube for gas-phase kinetic measurements employs a movable inlet
in the axial position surrounded by a carrier gas to achieve the flexibility in varying
reaction time (Howard, 1979). The wavelength-dependent radiation source
deter-mines the choice of oxidants that initiate free radical chemistry. In the atmosphere,
the ubiquitous oxidant OH is generated largely by the reaction of H2O with O(1D),
which is produced by the photolysis of O3 at wavelengths < 320 nm. In the flow
reactor, a variety of OH generation strategies exist. One option is to use black-lights that center around 350 nm to gently photolyze OH precursors such as H2O2,
HONO, and CH3ONO. The material of the flow tube determines the placement of
radiation sources. For example, the PAM reactor described by Kang et al. (2007)
is constructed of Teflon, which is transparent to UV radiation; consequently, the
UV lamps that drive the photochemistry can be positioned outside the reactor itself.
By contrast, another class of flow reactors is constructed of aluminum, for which
the UV lamps must be positioned inside the reactor itself (Ezell et al., 2010; R. Li
et al., 2015). Characterization of the behavior of the flow tube reactor requires,
ide-ally, a combination of flow and residence time modeling and experiment, chemical kinetic modeling and experiment, and modeling and experimental measurement of
interactions of vapor molecules and particles with reactor walls.
We present here the development and characterization of the Caltech Photooxidation
flow Tube reactor (CPOT). The CPOT has been constructed as a complement to the
Caltech 24 m3 batch chambers (Bates et al., 2014, 2016; Hodas et al., 2015; C. L.
Loza et al., 2013, 2014; R. C. McVay et al., 2014; Renee C. McVay et al., 2016;
Nguyen et al., 2015, 2014; Schilling Fahnestock et al., 2015; Rebecca H. Schwantes
et al., 2015; Yee et al., 2013; Xuan Zhang et al., 2014, 2015) in carrying out studies of SOA formation resulting from the oxidation of volatile organic compounds (VOCs)
by oxidants OH, O3, and NO3 over timescales not accessible in a batch chamber.
Due to its steady-state operation, the CPOT also affords the capability to collect
sufficient quantities of SOA generated in the reactor for comprehensive composition
determination by off-line mass spectrometry.
While the reactor itself is not unlike a number of those already developed and cited
characterization of the reactor. Using computational fluid dynamics (CFD)
sim-ulations, we describe the design and characterization of the CPOT. We highlight fundamental consideration of the design of a laminar flow tube reactor, including
methods of injection of gases and particles, the behavior of vapor molecules and
particles in the reactor, and effects of non-isothermal conditions on the flow in the
reactor. We evaluate the extent to which the fluid dynamics modeling agrees with
experimental residence time distribution (RTD) measurements.
Experimental measurements of SOA formation in laboratory Teflon chambers are
influenced by deposition of both particles and vapors to the chamber walls, and evaluation of the SOA yield from VOC oxidation must take careful accounting for
such wall losses (e.g., Nah et al., 2017, 2016; Xuan Zhang et al., 2014). We seek
to assess the extent to which both vapor and particle deposition onto the entrance
region and quartz wall of the flow tube is influential in flow tube reactor studies.
While experimental measurements of these processes will be presented in future
studies, the transport modeling presented here provides a basis for evaluating the
effect of reactor surfaces on experimental measurements of atmospheric chemistry
and SOA formation.
A photochemical kinetic model is formulated to simulate OH production in the
reactor. Typically, at steady state, the flow tube reactor gives only one data point
under a specific condition. Such a model is essential in evaluating oxidation data
in the reactor since the model predicts how the reactants evolve along the reactor.
Generally, the ideal plug flow reactor (PFR) framework is used in the modeling
of a flow tube system (R. Li et al., 2015; Peng et al., 2016, 2015). For a
non-ideal flow reactor, the axially-dispersed plug flow reactor (AD-PFR) framework
couples the RTD with the chemical reaction system. The axial dispersion plays the
role of backward and forward mixing of the reactants, smoothing the concentration gradients. By the comparison between AD-PFR and PFR models, we will show
how the non-ideal flow reactor impacts the data interpretation and suggest a method
for correction.
2.2 Design and Experimental Setup
2.2.1 CPOT Reactor
The CPOT comprises three sections: the inlet section, the main reaction section, and the outlet section (Fig. 2.1A). The inlet consists of two components: the static
Reactor 1 (1.2 m) Reactor 2 (1.2 m) Diffuser Inlet (53.3 cm) Mixing Tube Exit Cone (53.5 cm)
SP 1 SP 2 SP 3 SP 4
SP 5
MFC
To House Vacuum
CP, out T/RH CP, in T/RH
15º 150 mmI.D.
CP, in CP, out
CP: Coolant Port SP: Sample Port MFC: Mass Flow Controller T/RH: Temperature/
Relative Humidity HE: Heat Exchanger
B.Diffuser Inlet Design
Legend
170 mm I.D. 16 mm
I.D.
D.UV Light Housing
51 cm
51 cm 1.5 m
1.5 m
A.System Overview
C.Injection Scheme
MFC Needle
Valve
O3Generator
HE HE Atomizer Drier Neutralizer To Instruments Teflon Bag H2O2
MFC
[image:37.612.114.500.83.370.2]SO2
Figure 2.1: Overall schematic of the Caltech PhotoOxidation flow Tube (CPOT). (A) The inlet design. (B) The injection scheme. (C) Schematic for the housing chamber. (D) UV lamps.
mix reactant streams, whereas the diffuser serves to expand the mixed flow to the
diameter of the reaction section while maintaining an idealized laminar flow profile.
The static mixer is constructed of stainless steel and consists of 12 helical elements
(StaticMixCo, NY). The Pyrex glass diffuser section expands from an inner diameter
of 1.6 cm to 15 cm at an angle of 15°. The diffuser angle was chosen based on CFD simulations in order to minimize flow separation and recirculation. Detailed design
of the inlet section is discussed in Section 2.3.
The CPOT reaction section consists of two 1.2 m × 17 cm ID cylindrical quartz tubes surrounded by an external water jacket (1 cm thickness) and flanged together
with clamps and chemically resistant o-rings. Four ports along the reactor axis allow
sampling of the reactor contents at different residence times. A transition cone at
the end of the reactor concentrates the reactants into a common sampling line that
can be split among multiple instruments; thus, samples extracted at the end of the reactor represent the so-called cup-mixed average of the entire reactor cross section.
1.2x10¹⁵
1.0
0.8
0.6
0.4
0.2
0.0
Photon flux (cm
-2 s -1 nm -1 )
400 350
300 250
200
Wavelength (nm)
100
80
60
40
20
0
Transmittance (%)
[image:38.612.116.502.71.295.2]Flux: Hg vapor UVB UVA Transmittance: Water Fused quartz
Figure 2.2: Photon fluxes inside the reactor, as well as the transmittance of water and fused quartz (Beder et al., 1971).
2010). The Pyrex glass exit cone gradually reduces the diameter of the reactor from
15 cm to 0.72 cm at an angle of 15°. Similar to the inlet diffuser, the exit cone is
temperature-controlled (Section 2.2.3).
The CPOT is designed to operate under laminar flow. The essential dimensionless
group that differentiates laminar vs. turbulent flow is the Reynolds number, Re = ρUDµ , where ρis the fluid density, U is a characteristic velocity of the fluid, µ is the fluid viscosity, and D is the tube diameter. For cylindrical tubes, the flow
is considered laminar when Re < 2100. Under the typical CPOT flow rate (2 L min−1), the Reynolds numbers at the inlet cone, in the cylindrical section, and at the
exit cone are 150, 20, and 450, respectively, well below the transition to turbulent
flow.
2.2.2 Photolytic Environment
The reactor is housed within a 51 × 51 × 300 cm chamber containing 16 wall-mounted UV lamps. The arrangement of the lamps is outlined in Fig. 2.1D. Light
intensity is adjustable (0, 25%, 50%, 75%, and 100%), and the UV spectrum can
be set to a specific wavelength range with the installation of various T12 UV lamps,
including Hg vapor lamps (emit narrow bands at 254 nm and 185 nm), UVB lamps
(polychromatic irradiation centered at 305 nm) and UVA lamps (polychromatic