Published Online July 2013 in SciRes (http://www.scirp.org/journal/ce) http://dx.doi.org/10.4236/ce.2013.47A2010
The Perception of Web 2.0 Technologies on Teaching and
Learning in Higher Education: A Case Study
Stacia Ann Zelick
School of Business and Technology, Capella University, Minneapolis, USA Email: [email protected]
Received June 7th, 2013; revised July 7th, 2013; accepted July 14th, 2013
Copyright © 2013 Stacia Ann Zelick. This is an open access article distributed under the Creative Commons At-tribution License, which permits unrestricted use, disAt-tribution, and reproduction in any medium, provided the original work is properly cited.
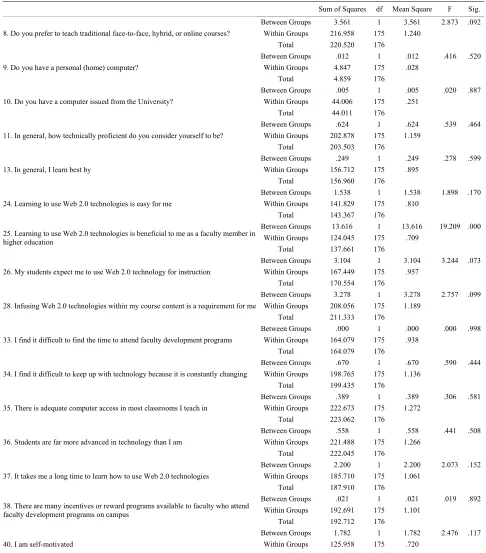
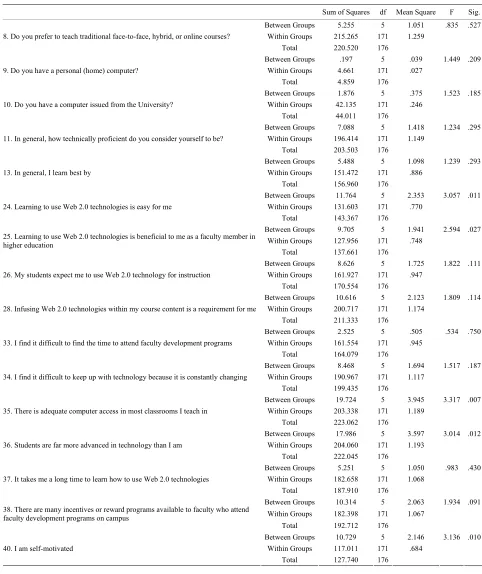
The purpose of this study was to examine faculty members’ perception of Web 2.0 technologies on teaching and learning in higher education compared to traditional classroom teaching methods in pro- grams at a higher education institutions to establish if relationships prevailed in their delivery of courses through the use of Web 2.0 technologies compared with traditional classroom delivery of courses; their overall satisfaction; the level of faculty development programs available; and their perceived effective- ness and impact of faculty development and issues and barriers affecting technology integration. This study also examined the influence of gender, age, and employment status on faculty members’ percep- tions of Web 2.0 technologies on teaching and learning in higher education compared to traditional class- room teaching methods. This study used a nonexperimental, quantitative descriptive research design to investigate faculty members’ perception of Web 2.0 technologies on teaching and learning in higher edu- cation compared to traditional classroom teaching methods. Participants for this study included full-time and part-time faculty members teaching at a public university in the United States. The results indicated that there is a relationship between faculty members’ perception of teaching college courses utilizing Web 2.0 technologies versus traditional classroom method; there is a relationship between faculty members’ gender and perception regarding their use of Web 2.0 technologies in their courses; and there was a rela- tionship between faculty members’ age and perception regarding their use of Web 2.0 technologies in their courses.
Keywords: Web 2.0 Technologies; Higher Education; Blogs; Facebook; Podcast; Second Life; Skype; Twitter; Wiki; YouTube
Introduction
There are a number of institutions that influence information technology innovation, including government authorities, inter- national agencies, professional and trade and industry associa- tions, research-oriented higher education institutions, trend- setting corporations, multinational corporations, financial insti- tutions, labor organizations, and religious institutions (King et al., 1994). Institutions of higher education, being one of the institutions that have influenced information technology inno- vation, have gone through a dramatic change over the past sev- eral years (Sibbet, 1997).
In today’s economy, organizations must constantly produce at the highest human and technological levels in order to remain competitive (Fillion, Limayem, Laferrière, & Mantha, 2006). Schools, colleges, and universities are increasingly turning their traditional classrooms into digitized technology rooms (Weyant & Gardner, 2010) and it is becoming a “a transition from aca- demic broadcasting to collaborative facilitation, from linear to student-directed teaching delivery” (Barnatt, 2008: p. 47). From blogs to virtual worlds, and wikis to interactive technology, students are now learning through a number of new channels, and it is up to the faculty members to infuse this technology into their curriculums (Chuang, 2004). With technology dou-
bling every 18 months (Sibbet, 1997), just keeping up with it can be a daunting task in itself, let alone trying to figure out how best to leverage information technology into an organiza- tion. Robey and Boudreau (1999) state that “each new genera- tion of technology and each major technological advance has been accompanied by energetic claims that organizations as we know them will be radically and fundamentally altered” (p. 167).
impacts of faculty development will recognize areas of success and failure and will contribute to improving the content of fac- ulty development (Al-Washahi, 2007). The results are expected to empower the faculty members to actively infuse technology into their curriculum and classroom, thus providing a state of the art experience for the student community at institutions of higher education.
Institutions of higher education are now playing to catch up because the students already have more knowledge about con- tent sharing and Web 2.0 technologies than their professors do (Barnatt, 2008). The traditional college students, aged 18 - 25 years old, grew up in the digital world of computers are used to this technology (Weyant & Gardner, 2010). In order to get the faculty members up to speed on these technologies so they are not only knowledgeable of the technology, but able to infuse the technology into their curriculums, and faculty development programs are critical. Rich (2008) proposes the following five competencies that faculty members (as well as students) must acquire in order to take full advantage of the various Web 2.0 technologies. These competencies include accurate searching skills through a variety of search tools, judging authoritative- ness to be able to acknowledge bias and appropriate use of citing materials, use of a range of channels to harmonize infor-mation, structural understanding of how Web 2.0 content is formed, and positive engagement (Rich, 2008).
Background of the Study
For the past thirty years, information technologies have revo- lutionized the way faculty members teach and students learn (Weyant & Gardner, 2010). In today’s economy institutions of higher education must constantly produce at the human and technological levels in order to remain competitive (Fillion et al., 2006). With mainframe computers introduced in 1967, hand-held digital calculators in 1970, personal computers in 1977, the Internet and Microsoft in 1995, and the extranet in 1998 (Sibbet, 1997) technology has been on the rise for over 42 years and there does not appear to be a hiccup or stop in sight. “In some schools, the Internet and other technologies are being integrated at the institutional level” (Gottwald, 2005: p. 2).
What used to be one-way communication and learning has quickly become an interactive platform for communication and learning. “Since the earliest use of the World Wide Web for teaching and learning, one of the most powerful elements has been the ability to engage learners in an interactive format” (Hazari, North, & Moreland, 2009: p. 187). The United States Department of Education established a project in 1998 to ad- vocate the effective infusion of technology into teacher educa- tion (Thompson, 2005). This project was established 21 years after the personal computer was introduced, and a mere three years after the Internet was introduced (Sibbet, 1997).
This is not surprising as the Internet has become the world’s most widespread unrestricted communication system (Laudon & Laudon, 2009: p. 200). “Increased attention to student en- gagement and active learning strategies have become particu- larly relevant in today’s classroom environments” (Williams & Chinn, 2009: p. 165). In 2000, the use of technology in instruc- tion was ranked as the second most significant issue confront- ing public education; by 2020 is it expected to be the most sig- nificant issue to confront public education (Hikmet, Taylor, & Davis, 2008). This development is an innovation in higher education. How faculty members are integrating Web 2.0 tech-
nologies into their curriculums and what specific Web 2.0 technologies are actually being integrated can lay the founda- tion to what tomorrow will bring for education, the faculty and the students. Thompson (2005) states that “teacher education must be a strong force to promote appropriate use of technology to support educational renewal and to prepare a skilled work force for our Information Society” (p. 331).
With technology continuing to expand at a rapid rate and be- ing ever changing (Rockart, Earl, & Ross, 1996), trying to con- stantly be on the cutting edge of technology in higher education is an interesting paradigm. “In some schools, the Internet and other technologies are being integrated at the institutional level; with a student’s complete academic experience—from applica- tion through registration and tuition payment, to final examina- tion and course grade-occurring on-line” (Gottwald, 2005: p. 2). The rapidly growing technology infrastructure at institutions of higher education to meet the instructional and research needs of faculty, staff, and students (Alsaady, 2007) is making faculty development with the use of technology a requirement. Be- tween 2002 and 2006, online learning increased by 21.5% while the entire higher education student body only increased by 1.5% (Yates, 2010).
Li and Pitts (2009) indicate that “one key area where Web- based technologies are predicted to have a significant impact is in their ability to transform the way in which professors and students are able to communicate and interact with one an- other” (p. 175). With the significant increase in online learning over the past years (Lee, 2010), this prediction is already a reality at institutions of higher education. Rich (2008) states that “members of the millennial generation are acquiring the sort of adult information navigation skills in an environment where folksonomies are widely used, and this potentially raises challenges for educators in universities as to how to promote information literacy” (p. 73). The reality is that the millennial generation, those born between 1982 and 2000, grew up with this technology so the faculty members are at a clear disadvan- tage (Barnatt, 2088). The role of the professor has gone from that of a broadcaster to a collaborative facilitator, and the learn- ing delivery has gone from linear to student directed (Barnatt, 2008). The needs of the student population in institutions of higher education are rapidly evolving into the most technologi- cal advanced generation and if institutions and faculty members want to remain competitive must infuse technology with cur- riculums and continuously improve the technological offerings.
of onsite versus online teaching (Fillion et al., 2006); percep- tions (Sahin & Thompson, 2006); and constructs that affect online teaching (Velez, 2010).
Statement of the Problem
The problem with advanced technological utilization by fac- ulty in higher education is that higher education institutions are installing state of the art technology into classrooms and faculty members are expected to infuse this technology into their teaching, but only about 20% of faculty members feel that they are prepared to comply (Chuang, 2004). Internet usage among 18 - 29 years old college students is at a staggering 93% and “44% of the nearly 53 million Internet users produce and share digital content online” (Weyant & Gardner, 2010: p. 68). Not only are these college students ahead of the faculty when it comes to technical skills and utilization, but the organizations that are waiting for these students to graduate so they can em- ploy them are expecting familiarity of Web 2.0 technologies (Weyant & Gardner, 2010).
Purpose of the Study
The purpose of this study was to examine faculty members’ perception of Web 2.0 technologies on teaching and learning in higher education compared to traditional classroom teaching methods in programs at a higher education institutions to estab- lish if relationships prevailed in their delivery of courses through the use of Web 2.0 technologies compared with traditional classroom delivery of courses: their overall satisfaction, the level of faculty development programs available, and their per- ceived effectiveness and impact of faculty development and issues and barriers affecting technology integration. This study also examined the influence of gender, age, and employment status on faculty members’ perceptions of Web 2.0 technolo- gies on teaching and learning in higher education compared to traditional classroom teaching methods.
Research Questions
The primary research question for this study was:
To what extent do faculty members teaching college courses utilizing Web 2.0 technologies perceive that this method is a practical alternative to the traditional classroom method?
The following secondary questions were asked to support the primary research question stated above:
Question 2: To what extent do faculty members perceive that there is an adequate level of development programs available to create their course content utilizing Web 2.0 technologies?
Question 3: To what extent do faculty members perceive that the faculty development programs affecting technology integra- tion are effective?
Question 4: To what extent do faculty members perceive that the impact of the barriers affecting technology integration is hindering their ability to utilize Web 2.0 technologies?
Question 5: Is there a difference in male and female faculty members’ perceptions regarding their use of Web 2.0 technolo- gies in their courses?
Question 6: Is there a difference in faculty members’ percep- tions regarding their use of Web 2.0 technologies in their courses respective to their age?
Question 7: Is there a difference in faculty members’ percep-
tions regarding their use of Web 2.0 technologies in their courses respective to their employment status?
Significance of the Study
With technology continuing to expand at a rapid rate and be- ing ever changing (Rockart et al., 1996), just keeping up with it can be a daunting task in itself. “In some schools, the Internet and other technologies are being integrated at the institutional level; with a student’s complete academic experience—from application through registration and tuition payment, to final examination and course grade-occurring on-line” (Gottwald, 2005: p. 2). The rapidly growing technology infrastructure at institutions of higher education to meet the instructional and research needs of faculty, staff, and students (Alsaady, 2007) is making faculty development with the use of technology a re- quirement. Between 2002 and 2006, online learning increased by 21.5% while the entire higher education student body only increased by 1.5% (Yates, 2010). These are pretty alarming statistics and with Web 3.0 moving fast upon us, institutions of higher education need to put improving teaching and learning through the use of Web 2.0 technologies as a priority in their strategic plans so faculty members can learn not only how to use Web 2.0 technologies, but how to successfully infuse Web 2.0 technologies into their curriculums to improve learning.
In order for faculty members’ to remain competitive and sustainable in this digital age, professional development on the use of technology and how to infuse technology into course curricula is a requirement. Identifying the aspects of effective- ness and potential impacts of faculty development will recog- nize areas of success and failure and will contribute to improv- ing the content of faculty development (Al-Washahi, 2007). The results are expected to empower the faculty members to actively infuse technology into their curriculum and classroom, thus providing a state of the art experience for the student community at institutions of higher education.
Li and Pitts (2009) state that “the use of Web-based learning technologies has increased dramatically over the past decade providing new opportunities and avenues for students to inter- act with their professors virtually using computer-mediated communication technologies” (p. 175). An increasing number of institutions on higher education are relying on Web 2.0 technologies for teaching and learning purposes. Barnett (2008) cautions, however, that “beyond the use of new online tools by individual academics, an adoption of the philosophies, stake- holder expectations and development concepts of Web/HE 2.0 is likely to prove far more difficult for HE institutions at a stra- tegic level” (p. 50).
cation in particular is hence playing catch-up, as those it seeks to educate increasingly arrive with the content sharing and ser- vice skills that those teaching them and managing that teaching have often not yet fully understood” (p. 48).
Definition of Terms
Avatar
An avatar “is a three dimensional cartoon character that in-
teracts with other objects and avatars in Second Life” (Lee, 2010: p. 19). An avatar is a virtual representation of the person creating it.
Blogs
A blog is similar to an online diary. It is a webpage “consist-
ing of brief paragraphs of opinion, information, personal diary entries, or links, called posts, arranged chronologically with the
most recent first, in the style of an online journal” (Anderson, 2007: p. 7).
Facebook, initially created for college student synergy, is an
online network that allows people to have personal page and grants them the ability to stay in touch with other people (Fuller, 2011).The personal page includes personal information, photos, videos, text, and a ‘wall’ for friends to post information on (McCarthy, 2010). As a user, you can add friends, create groups and events (that you can invite friends to), create networks which link the user to professional and higher education face- book sites.
Hybrid Courses
Hybrid is the term used to describe educational courses de- livered through a mixture of traditional face-to-face and online teaching methods.
Online Courses
Online is the term used to describe educational courses de-
livered through the Internet.
Podcast
A Podcast is an audio or video file created for use on mp3
players or on a computer (Baker, Harrison, Thornton, & Yates, 2010).
Second Life
Second Life is a three-dimensional computerized environ-
ment where members can socialize, hold virtual meetings, or conduct transactions online (Wang & Braman, 2009). Second Life is the largest virtual world with 15 million registered ac- counts in 2008 (Harris & Rea, 2009).
Skype
Skype is a synchronous voice and video communication tool
(Newman, 2007).
Traditional Face-to-Face Courses
Traditionalface-to-face is the term used to describe educa-
tional courses delivered face-to-face in the classroom at the educational institution.
Twitter is a free micro-blogging application that allows for
quick exchanges of thoughts, ideas, and information, which are delivered as messages up to 140 characters each (Wankel, 2009).
Virtual Worlds
A virtual world is a “computer simulated environment that
enables users to interact with each other without geographical confines” (Harris & Rea, 2009: p. 138). Real people are char- acterized by avatars (a virtual ‘you’) and meet, interact and exchange ideas with each other at virtual locations.
Web 2.0
Web 2.0 is a service “built using the building blocks of the
technologies and open standards that underpin the Internet and the web” (Anderson, 2007: p. 7). These services include blogs, wikis, browsers with plugins, social networking, multimedia sharing, content syndication, podcasting and content tagging services (think of tagging a person in a photo to identify their name).
Wikis
Wikis are a “type of Web site that makes it easy for users to contribute and edit text content and graphics without any knowl- edge of Web page development or programming techniques” (Laudon & Laudon, 2009: p. 66). Wikipedia is one of the best (and biggest) examples of a Wiki.
YouTube
YouTube “is the most popular and widely accepted video sharing website on the Internet” (Lee, 2010: p. 23).
Web 2.0 Tools
Blogs
The Pew Internet and American Life Project reported in 2009 the usage of blogs in the following way: “32% of all American adults go online to read someone else’s blog; 15% work on someone else’s webpage or blog; and 11% create or work on their own online journal or blog” (Weyant & Gardner, 2010: p. 68). Faculty are infusing blogs into their course curriculums for a variety of purposes, including syllabi distribution, digital port- folios, collaborative writing, and discussion group assignments (Weyant & Gardner, 2010). Alexander (2008) argues that blogs are the “centerpiece” to the organization of Web 2.0 because “the simplicity of creating and updating blogs empowers read- ers to write, evoking the phrase read/writeWeb” (p. 152).
there were 845,000,000 monthly active users at the end of De- cember 2011, 483,000,000 daily active users on average in December 2011, more than 425,000,000 monthly active users who used Facebook mobile products in December 2011, and available in more than 70 languages (Facebook, 2012).
By utilizing Facebook, faculty members can use the same tool that the students are already using to do other collaboration for course collaboration rather than making them log on to a separate course collaboration tool or website (Lee, 2010). Wankel (2009) furthers this discussion by stating that:
The uses of Facebook by management instructors include the ability to provide an attractive interactive venue, such as a Facebook group, for students to post threaded discussions on course-related material and activities, as well as reply to other student posting creating the sort of interactivity expected by accreditation agencies, most particularly online courses (p. 252).
In 2009, a Facebook assessment was done at the University of Adelaide in Australia with a first year design elective course. In this 6-week program, 120 students including 27 international students were enrolled in the course and participated in the assessment that involved a blended environment of both online engagements and face-to-face engagements (McCarthy, 2010). “The 2009 study indicated that the blending of real and virtual environments increased peer interaction and academic engage- ment, two key factors in a positive first year experience” (McCarthy, 2009: p. 738). McCarthy also notes that the in- creased collaboration between resident and international stu- dents was one of the most gratifying features of the online learning environment with Facebook.
Podcast
Podcasting was originally designed for audio files through the use of the Apple iPod but was enhanced to include video files when the video enabled iPods appeared on the market (Baker et al., 2010). Podcasts can be downloaded and viewed through the use of any mp3 device or computer. “The basic elements required to initiate a Podcasting program consist of a personal computer, microphone, audio editing software (avail- able at no charge from Audacity.com), web server and a web- site” (Baker et al., 2010: p. 9).
A study was conducted by Baker et al. (2010) with an avia- tion class at a university in Florida to assess the benefits of using podcasting in a class. The 29 students in the class had access to four different podcasts that were available through the course website. Each podcast was a summary of four subjects that previous students had difficulty in understanding. The 29 students were given a quiz made up of questions from the Fed-eral Aviation Administration (FAA) question bank and the results were compared to the results from the previous year where students did not have access to podcasts. The results proved that there was no difference between the test scores from the students who did have access to the podcasts and from the students who did not have access to the podcasts.
Second Life
Second Life, a desktop virtual reality application, “is a three- dimensional (3D) electronic environment where members can socialize, hold virtual meetings, or conduct economic transac- tions” (Wang & Braman, 2009: p. 235). Second Life is an ap- plication that is downloaded to a person’s computer in order to extract the three dimensional graphics (Lee, 2010). Second Life is composed of islands that can be purchased and owned by
people; on each island, the owners can do anything their crea- tive mind or budget allows (Lee, 2010). Two significant fea- tures of learning in Second Life are that students are “often more motivated and less distracted than when they are placed in a traditional classroom” (Lee, 2010: p. 36) and that “the simu- lations tend to be more relevant to student when learning about real world situations” (p. 36).
Skype
The most influential feature of Skype is the ability to provide synchronous video feed during calls (Newman, 2007). “Using Skype, students can contact an instructor for help anytime the instructor is logged on to his or her computer. With this syn- chronous form of communication in both audio and visual for- mats, instructors have the ability to talk with and see students anytime both parties are connected in the Skype application” (Newman, 2007: pp. 27-28). Based on a survey of 221 students, the addition of Skype did not have a significant effect on stu- dent perceptions of online communications, online learning, or online community (Newman, 2007). Newman (2007: p. 78) points out that “the majority of the students indicated their en- thusiasm and willingness to use a synchronous communication tool, yet they optioned not to use it or did so very little”). This could have been due to the fact that students had to have mi- crophones and speakers or headsets, so if they did not own these they considered it hassle to go check the equipment out and install it on the computer they were using (Newman, 2007).
Twitter is being utilized by colleges and universities as a chat service with current and potential students and also to improve awareness of campus events (Fuller, 2011). It can also be util- ized to allow of network of users to add to an unstructured col- laboration of ideas, links and resources (Wankel, 2009). “In a large class section of perhaps hundreds of learners, tweeting enables an immense amount of interactivity, ideally enriching the session in which it occurs” (Wankel, 2009: p. 254). Profes- sors at Marquette University in Wisconsin utilize Twitter to promote the development of listening and classroom commu- nity environment, information gathering, multi-tasking, writing skills, and attention skills and have reported an increase in communication with students with the use Twitter (Wenkel, 2009).
Wiki
Faculty are infusing wikis into their course curriculums for a variety of purposes, including collaborative writing, posting of class notes, project brainstorming, and as a course management system (Weyant & Gardner, 2010). “Wikis support the con- structivist, collaborative learning models by engaging students in the learning process” (Weyant & Gardner, 2010: p. 70). The largest and most well-known wiki is Wikipedia (Nicolaou, 2009). Nicolaou (2009) posits that:
Wikipedia holds millions of articles in approximately 250 languages with more than two million pages in English. There are currently more than 75,000 active contributors to Wikipe- dia articles, while tens of thousands of edits are made daily to enhance the knowledge help by this online encyclopedia (p. 26).
YouTube
nism for sharing recruiting videos” (Fuller, 2011: p. 50). You- Tube is the standard for video streaming on the Internet (Lee, 2010) and instructors can use this as a tool for students to up- load the videos as homework assignments. Video streaming is also available via Facebook, and both can easily be done with today’s smart phones.
Research Design
This study used a nonexperimental, quantitative descriptive research design to investigate faculty members’ perception of Web 2.0 technologies on teaching and learning in higher educa- tion compared to traditional classroom teaching methods. Quan- titative techniques, as stated by Swanson and Holton (2005), “are particularly strong at studying large groups of people and making generalizations from the sample being studied to broader groups beyond that sample” (p. 30). This design was suitable for this research because the researcher had no control or influ- ence over the variables. Cooper and Schindler (2008) posit that with nonexperimental researcher, “the researcher is limited to holding factors constant by judicious selection of subjects ac- cording to strict sampling procedures and by statistical ma- nipulation of findings” (p. 143).
Sample
Participants for this study included full-time and part-time faculty members teaching at a public university in the United States, with the following selected attributes:
Industry = Education; Job Function = Educator;
Education Level = Graduate Degree;
Employment = Employed Part Time, Employed Full Time; Age = 20 - 100+;
Country = USA.
Of the 1207 respondents who were willing to participate in the survey, 988 or 81.9% of them were disqualified because they were not a part time or full time faculty member teaching in a public university in the United States and 18.1% or 219 of the respondents were eligible to participate in the survey based on the selected criteria noted above. Of the 219 surveys re- ceived, 41 surveys were deleted because of missing data. A total of 178 or 81.3% of the surveys were considered usable because the respondents participated in and actually completed the survey.
Setting
Zoomerang, an online survey service affiliated with the online survey tool SurveyMonkey, was the setting this study. Zoom- erang allows researchers to select an online panel of partici- pants based on particular attributes set by the researcher.
Instrumentation
The instrument that was utilized for this research was an online survey that was designed and created by the researcher. Advantages of an online survey include the unit cost of data collection is low, the possibility for high speed of returns, all of the benefits of a self-administered instrument can be realized, all of the benefits of a computer-assisted instrument can be realized, and they provide time for thoughtful answers (Fowler, 2009). The online survey was created through SurveyMonkey.
SurveyMonkey, an online survey tool that has been available since 1999, was appropriate for this type of research as it al- lowed the researcher to create her own online survey using custom templates, the researcher obtained descriptive statistics on the results, and the results were downloaded into a database for additional data analysis (Creswell, 2009).
The survey was created following the five guiding principles of self-administered surveys: surveys should be self-explana- tory, restricted to closed answers, the question forms should be few in number, laid out in a manner that is clear, and provide redundant information to make everything simple (Fowler, 2009). The survey was divided into three sections. The first section collected data on demographic information from the faculty members including age, gender, employment status, number of years working in higher education, how their courses are taught (face-to-face, hybrid, or online), and information on their work and personally owned computers. The second section of the survey listed current Web 2.0 technologies (Blogs, Facebook, Podcast, Second Life, Skype, Twitter, Wiki, YouTube) and the participant was asked to rate their proficiency level towards each technology on a 5-point Likert scale (1 = expert, 5 = pro- ficient). The third section was a sequence of optimistic state- ments regarding faculty members’ perceptions on whether or not teaching college courses utilizing Web 2.0 technologies was a practical alternative to the traditional classroom method. The participants were asked to match their level of agreement on a 5-point Likert scale (1 = strongly disagree and 5 = strongly agree).
Data Collection
The data was collected via an online survey, created through SurveyMonkey. Once approval was received from the Survey- Monkey Project Management team, the survey launched and data collection automatically began. In order for respondents to be eligible to begin the survey, they must have the following attributes:
Industry = Education; Job Function = Educator;
Education Level = Graduate Degree;
Employment = Employed Part Time, Employed Full Time; Age = 20 - 100+;
Country = USA.
When respondents began the survey, the first page included the wording from the initial email to potential participants which explained the purpose of the research study, that they have been selected to participate in the research study, the procedures, and that their professional experience at their University will be invaluable to this particular research study. As the level of granularity on the available attribute selections within Survey- Monkey did not allow for ensuring that the participants were part time or full time faculty members employed at a public university in the United States, a screening question was in- cluded at the bottom of this page with skip logic that would automatically disqualify a respondent when their answer to the answer was no.
derstood the consent form and agreed to voluntarily participate as a subject in the research, they were able to access the survey by simply clicking the button labeled next. Once each survey was submitted by the participant, it was automatically saved in the SurveyMonkey database. SurveyMonkey notified the re- searcher once the project received the number of expected re- sponses and the project was labeled as complete by Survey- Monkey. No further action needed to be taken by the partici- pants.
Results
Description of Participants
The description of participants was defined through Section 1 of the online survey which included 13 questions that became the independent scale variables and one qualifying question to determine the eligibility of the respondent which was also an independent scale variable. Of the 1207 respondents who were willing to participate in the survey, 988 or 81.9% of them were disqualified because they were not a part time or full time fac- ulty member teaching in a public university in the United States and 18.1% or 219 of the respondents were eligible to participate in the survey based on the selected criteria noted above. Of the 219 surveys received, 42 surveys were deleted because of missing data. A total of 177 or 80.8% of the surveys were con- sidered usable because the respondents participated in and ac- tually completed the survey. These statistics are defined in Ta- ble 1.
Survey Question 1 asked the participants to select their gen- der. Table 2 displays the results.
Of the 177 valid responses, more than half of the participants were male with 96 or 54.2% being male and 81 or 45.8% being female. Survey Question 2 asked the participant to select the category that includes their age. The results are displayed in
Table 3.
The majority of the faculty members who participated in this research study were in the age range of 50 - 59 years old (25.4%) and 30 - 39 years old (25.4%); the minority of the fac- ulty members who participated were in the age range of 70 years and older (5.1%) and between 20 - 29 years old (9.0%).
Table 1.
Frequency table—qualifying question to determine if participants are part time or full time faculty members teaching at a public university in the United States.
Frequency Percent Valid Percent Cumulative Percent
Yes 219 18.1 18.1 18.1
No 988 81.9 81.9 100.0
Valid
Total 1207 100.0 100.0
Table 2.
Frequency table—gender.
Frequency Percent Valid Percent Cumulative Percent
Male 96 8.0 54.2 54.2
Female 81 6.7 45.8 100.0
Valid
Total 177 14.7 100.0 Missing System 1030 85.3
Total 1207 100.0
Table 3.
Frequency table—age.
Frequency Percent Percent Valid Cumulative Percent
20 - 29 16 1.3 9.0 9.0
30 - 39 45 3.7 25.4 34.5
40 - 49 28 2.3 15.8 50.3
50 - 59 45 3.7 25.4 75.7
60 - 69 34 2.8 19.2 94.9
70+ 9 .7 5.1 100.0
Valid
Total 177 14.7 100.0 Missing System 1030 85.3
Total 1207 100.0
Survey Question 3 asked the participants to select the number of years they have been teaching in higher education. The re- sults can be found in Table 4.
The number of years that the faculty members have been teaching in higher education appeared on both ends of the spec- trum with the majority of responses falling between 1 - 5 years (26.0%) or 21+ years (24.9%). The minority of responses fell between 16 - 20 years (12.4%). Survey Question 4 asked the participants to select the number of years they have been teaching at their University. The results can be seen in Table 5.
When the faculty members were asked how many years they had been teaching at their university, the majority of them (68 or 38.4%) had been teaching at their university for 1 - 5 years while 10 or 5.6% of the faculty members had been teaching at their university for 16 - 20 years. Survey Question 5 asked the participants to select their current employment status within the University. These results are indicated by Table 6.
Of the 177 faculty members who participated in the research study, almost half (86 or 48.6%) were adjuncts, while 37 or 20.9% were professors, 25 or 14.1% were assistant professors, and 24 or 13.6% were associate professors. The minority of the participants selected chairperson (3 or 1.7%), assistant dean (1 or .6%) or associate dean (1 or .6%).
Survey Question 6 asked the participants to select the level of courses they taught (undergraduate, graduate or both). The re- sults can be found in Table 7.
The majority of the faculty members taught undergraduate courses (113 or 63.8%); 15 or 8.5% taught graduate courses; and 49 or 27.7% taught both undergraduate and graduate courses. Survey Question 7 asked the participants to select the method of teaching they utilize (traditional face-to-face, online, hybrid, or all of the above). The results are displayed in Table 8.
The majority of the participants (111 or 62.7%) taught tradi- tional face-to-face courses, 16 or 9.0% taught online courses, 5 or 2.8% taught hybrid courses, and a quarter of the participants (45 or 25.4%) taught traditional face-to-face, online and hybrid courses. Survey Question 8 asked the participants to select their preferred method of teaching. The results can be found in Ta- ble 9.
The majority of the participants (114 or 64.4%) preferred to teach traditional face-to-face courses, 22 or 12.4% preferred to teach hybrid courses, 15 or 8.5% preferred to teach online, and 26 or 14.7% did not have a preference. Survey Question 9 asked the participants if they had a personal computer. Table 10 displays the results.
Table 4.
Frequency table—number of years teaching in higher education.
Frequency Percent Percent Valid Cumulative Percent
1-5 46 3.8 26.0 26.0
6-10 38 3.1 21.5 47.5
11-15 27 2.2 15.3 62.7
16-20 22 1.8 12.4 75.1
21+ 44 3.6 24.9 100.0
Valid
Total 177 14.7 100.0 Missing System 1030 85.3
Total 1207 100.0
Table 5.
Frequency table—number of years teaching at the university.
Frequency Percent Percent Valid Cumulative Percent
1-5 68 5.6 38.4 38.4
6-10 40 3.3 22.6 61.0
11-15 30 2.5 16.9 78.0
16-20 10 .8 5.6 83.6
21+ 29 2.4 16.4 100.0
Valid
Total 177 14.7 100.0
Missing System 1030 85.3
Total 1207 100.0
Table 6.
Frequency table—current employment status within the university.
Frequency Percent Valid Percent
Cumulative Percent
Adjunct 86 7.1 48.6 48.6
Assistant Professor 25 2.1 14.1 62.7
Associate Professor 24 2.0 13.6 76.3
Professor 37 3.1 20.9 97.2
Chairperson 3 .2 1.7 98.9
Assistant Dean 1 .1 .6 99.4
Associate Dean 1 .1 .6 100.0 Valid
Total 177 14.7 100.0
Missing System 1030 85.3
Total 1207 100.0
Table 7.
Frequency table—level of courses taught.
Frequency Percent Percent Valid Cumulative Percent
Under graduate 113 9.4 63.8 63.8
Graduate 15 1.2 8.5 72.3
Both 49 4.1 27.7 100.0
Valid
Total 177 14.7 100.0
Missing System 1030 85.3
Total 1207 100.0
Table 8.
Frequency table—method of teaching courses.
Frequency Percent Valid Percent
Cumulative Percent Traditional
face-to-face 111 9.2 62.7 62.7
Online 16 1.3 9.0 71.8
Hybrid 5 .4 2.8 74.6
All of the above 45 3.7 25.4 100.0 Valid
Total 177 14.7 100.0 Missing System 1030 85.3
Total 1207 100.0
Table 9.
Frequency table—teaching method preference.
Frequency Percent Valid Percent
Cumulative Percent Traditional
face-to-face 114 9.4 64.4 64.4
Hybrid 22 1.8 12.4 76.8
Online 15 1.2 8.5 85.3
No preference 26 2.2 14.7 100.0 Valid
Total 177 14.7 100.0 Missing System 1030 85.3
Total 1207 100.0
Table 10.
Frequency table—personal home computer.
Frequency Percent Percent Valid Cumulative Percent
Yes 172 14.3 97.2 97.2
No 5 .4 2.8 100.0
Valid
Total 177 14.7 100.0 Missing System 1030 85.3
Total 1207 100.0
not have a personal computer. Survey Question 10 asked the participants if they had a computer issued from the University. The results of this question are displayed in Table 11.
Based on the results from Table 11, over half of the faculty
participants (95 or 53.7%) had a computer issued from the uni- versity, and 82 or 46.3% of the faculty members did not have a computer issued by the University. Survey Question 11 asked the participants how technically proficient they considered themselves to be. Table 12 shows the results.
Based on the results from Table 12, 66 (37.3%) of the fac-
ulty members indicated that they were moderately proficient, 39 or 22% of the faculty members indicated that they were proficient and somewhat proficient, 29 or 16.4% indicated they were expert, and 4 or 2.3% indicated that they were not profi- cient. Survey Question 12 asked the participants to select how technically proficient they considered themselves to be when specifically talking about Web 2.0 technologies that their uni- versity offers. The results are reflected in Table 13.
Table 11.
Frequency table—university issued computer.
Frequency Percent Valid Percent
Cumulative Percent
Yes 95 7.9 53.7 53.7
No 82 6.8 46.3 100.0
Valid
Total 177 14.7 100.0 Missing System 1030 85.3
Total 1207 100.0
Table 12.
Frequency table—technical proficiency level.
Frequency Percent Percent Valid Cumulative Percent
Not Proficient 4 .3 2.3 2.3 Somewhat
Proficient 39 3.2 22.0 24.3 Proficient 39 3.2 22.0 46.3 Moderately
Proficient 66 5.5 37.3 83.6
Expert 29 2.4 16.4 100.0
Valid
Total 177 14.7 100.0 Missing System 1030 85.3
Total 1207 100.0
Table 13.
Frequency table—technology proficiency level based on Web 2.0 tech- nologies offered by the university.
Frequency Percent Valid Percent
Cumulative Percent Not Proficient 26 2.2 14.7 14.7
Somewhat
Proficient 55 4.6 31.1 45.8 Proficient 45 3.7 25.4 71.2 Moderately
Proficient 38 3.1 21.5 92.7
Expert 13 1.1 7.3 100.0
Valid
Total 177 14.7 100.0 Missing System 1030 85.3
Total 1207 100.0
faculty members rated themselves as an expert. Survey Ques- tion 13 asked the participants to select their best method of learning. The results can be found in Table 14.
The majority of the faculty members, 103 or 58.2%, indi- cated that they learned best by doing, while 63 or 35.6% learned best by reading or watching. Only 11 or 6.2% of the faculty learned best by listening.
Description of Ordinal Variables
Sections 2 and 3 of the survey contain the dependent ordinal variables. Section 2 asked the faculty member to identify their current level of Web 2.0 technology use, from never to very often, at their university for instructional purposes. Survey Question 14 asked the participants to select their current level of utilizing Blogs for instructional purposes. The results are indicated in Table 15.
The majority of the faculty members have never utilized Blogs (75 or 42.4%), 40 or 22.5% sometimes utilized Blogs, 36 or 20.3% rarely utilized Blogs, 23 or 13.0% often utilized Blogs, and 3 or 1.7% very often utilized Blogs. Survey Question 15 asked the participants to select their current level of utilizing
Facebook for instructional purposes. The results are indicated by Table 16.
Half of the faculty members (90 or 50.8%) never utilized Facebook for instructional purposes, while 28 of the faculty members have rarely utilized Facebook and 27 or 15.3% some- times utilized Facebook. The minority of the faculty members have either often utilized Facebook (22 or 12.4%) or very often utilized Facebook (10 or 5.6%). Survey Question 16 asked the participants to select their utilization of Podcast for instruc- tional purposes. The results of this question can be found in
Table 17.
Table 14.
Frequency table—best method of learning.
Frequency Percent Valid Percent
Cumulative Percent Reading or
watching 63 5.2 35.6 35.6
Listening 11 .9 6.2 41.8
Doing 103 8.5 58.2 100.0
Valid
Total 177 14.7 100.0 Missing System 1030 85.3
Total 1207 100.0
Table 15.
Frequency table—Blogs utilization for instructional purposes.
Frequency Percent Percent Valid
Cumulative Percent
Never 75 6.2 42.4 42.4
Rarely 36 3.0 20.3 62.7
Sometimes 40 3.3 22.6 85.3
Often 23 1.9 13.0 98.3
Very Often 3 .2 1.7 100.0
Valid
Total 177 14.7 100.0
Missing System 1030 85.3
Total 1207 100.0
Table 16.
Frequency table—Facebook utilization for instructional purposes.
Frequency Percent Percent Valid Cumulative Percent
Never 90 7.5 50.8 50.8
Rarely 28 2.3 15.8 66.7
Sometimes 27 2.2 15.3 81.9
Often 22 1.8 12.4 94.4
Very Often 10 .8 5.6 100.0
Valid
Total 177 14.7 100.0 Missing System 1030 85.3
Total 1207 100.0
Table 17.
Frequency table—Podcast utilization for instructional purposes.
Frequency Percent Valid Percent
Cumulative Percent
Never 86 7.1 48.6 48.6
Rarely 28 2.3 15.8 64.4
Sometimes 43 3.6 24.3 88.7
Often 15 1.2 8.5 97.2
Very Often 5 .4 2.8 100.0
Valid
Total 177 14.7 100.0 Missing System 1030 85.3
The majority of the faculty members (86 or 48.6%) have never utilized Podcast for instructional purposes, while 43 or 24.3% sometimes utilized Podcast, and 28 or 15.8% rarely util- ized Podcast. Of the 177 participants, 15 or 8.5% often utilized Podcast and 5 or 2.8% very often utilized Podcast for instruc- tional purposes. Survey Question 17 asked the participants how often they utilized Second Life for instructional purposes. The results of this question can be found in Table 18.
The majority of the participants (141 or 79.7%), have never utilized Second Life for instructional purposes, 15 or 8.5% of the participants have rarely utilized Second Life, 17 or 9.6% sometimes utilized Second Life and 4 or 2.3% often utilize Second Life. Survey Question 18 asked the participants how often they utilized Skype for instructional purposes. The results are indicated Table 19.
The majority of faculty members (91 or 51.4%) have never utilized Skype for instructional purposes, while 35 or 19.8% have rarely utilized Skype, 33 or 18.6% sometimes utilized Skype, 15 or 8.5% often utilize Skype, and 3 or 1.7% very of- ten utilize Skype. Survey Question 19 asked the participants how often they utilized Twitter for instructional purposes. The results can be found in Table 20.
Table 18.
Frequency table—Second Life utilization for instructional purposes.
Frequency Percent Percent Valid Cumulative Percent
Never 141 11.7 79.7 79.7
Rarely 15 1.2 8.5 88.1
Sometimes 17 1.4 9.6 97.7
Often 4 .3 2.3 100.0
Valid
Total 177 14.7 100.0 Missing System 1030 85.3
Total 1207 100.0
Table 19.
Frequency table—Skype utilization for instructional purposes.
Frequency Percent Percent Valid Cumulative Percent
Never 91 7.5 51.4 51.4
Rarely 35 2.9 19.8 71.2
Sometimes 33 2.7 18.6 89.8
Often 15 1.2 8.5 98.3
Very Often 3 .2 1.7 100.0
Valid
Total 177 14.7 100.0 Missing System 1030 85.3
Total 1207 100.0
Table 20.
Frequency table—Twitter utilization for instructional purposes.
Frequency Percent Percent Valid Cumulative Percent
Never 126 10.4 71.2 71.2
Rarely 21 1.7 11.9 83.1
Sometimes 18 1.5 10.2 93.2
Often 10 .8 5.6 98.9
Very Often 2 .2 1.1 100.0
Valid
Total 177 14.7 100.0 Missing System 1030 85.3
Total 1207 100.0
The majority of the participants (126 or 71.2%) have never utilized Twitter for instructional purposes, while 21 or 11.9% rarely utilized Twitter, and 18 or 10.2% of the faculty members sometimes utilized Twitter. The minority of the participants (2 or 1.1%) very often utilizes Twitter, and 10 or 5.6% often util- ize Twitter for instructional purposes. Survey Question 20 asked the participants how often they utilized Wikis for instruc- tional purposes. The results can be found in Table 21.
Over half of the participants (92 or 52%) have never utilized Wikis for instructional purposes, while 34 or 19.2% rarely util- ize Wikis and 35 or 19.8% sometimes utilize Wikis. Of the 177 tot participants, 12 or 6.8% indicated that they often utilize Wikis and 4 or 2.3% indicated that they very often utilize Wikis for instructional purposes. Survey Question 21 asked the par- ticipants how often they utilized YouTube for instructional purposes. The results can be found in Table 22.
The majority of the participants (71 or 40.1%) indicated that they sometimes utilize YouTube for instructional purposes, while 44 or 24.9% have rarely utilized YouTube and 27 or 15.3% have never utilized YouTube for instructional purposes. The minority of the participants (9 or 5.1%) indicated that they very often utilized YouTube and 25 or 14.7% indicated that they often utilize YouTube for instructional purposes. Descrip- tive statistics for the Web 2.0 technologies analyzed (Blogs, Facebook, Podcast, Second Life, Skype, Twitter, Wiki, and YouTube) can be found in Table 23.
In summary, Table 23 shows that the Web 2.0 technologies
that are utilized the least out of all of the participants were Second Life with a mean of 1.3446 and Twitter with a mean of 1.5367. The Web 2.0 technologies utilized the most out of all of the participants was YouTube with a mean of 2.6949 and Blogs with a mean of 2.1130.
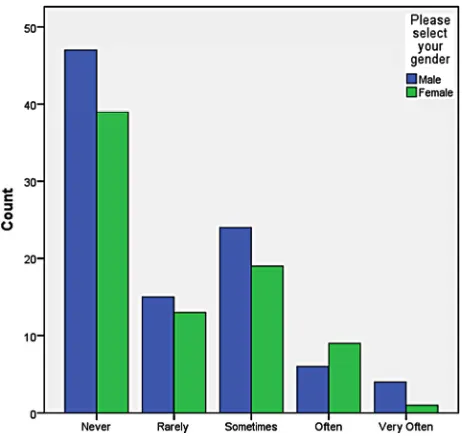
Crosstablulation analyses were conducted to understand the impact of gender on the level of Web 2.0 technology utilization at the faculty members’ university. Figure 1 shows the impact
of gender on the level of Blog utilization at their respective university.
Table 21.
Frequency table—Wiki utilization for instructional purposes.
Frequency Percent PercentValid Cumulative Percent
Never 92 7.6 52.0 52.0
Rarely 34 2.8 19.2 71.2
Sometimes 35 2.9 19.8 91.0
Often 12 1.0 6.8 97.7
Very Often 4 .3 2.3 100.0
Valid
Total 177 14.7 100.0 Missing System 1030 85.3
Total 1207 100.0
Table 22.
Frequency table—YouTube utilization for instructional purposes.
Frequency Percent Valid Percent
Cumulative Percent
Never 27 2.2 15.3 15.3
Rarely 44 3.6 24.9 40.1
Sometimes 71 5.9 40.1 80.2
Often 26 2.2 14.7 94.9
Very Often 9 .7 5.1 100.0
Valid
Total 177 14.7 100.0 Missing System 1030 85.3
Table 23.
Descriptive statistics of Web 2.0 technologies.
N Minimum Maximum Mean Std. Deviation Blogs 177 1.00 5.00 2.1130 1.14748 Facebook 177 1.00 5.00 2.0621 1.29316 Podcast 177 1.00 5.00 2.0113 1.15300 Second Life 177 1.00 4.00 1.3446 .74612 Skype 177 1.00 5.00 1.8927 1.08962 Twitter 177 1.00 5.00 1.5367 .96534 Wiki 177 1.00 5.00 1.8814 1.08844 YouTube 177 1.00 5.00 2.6949 1.05939 Valid N (listwise) 177
Figure 1.
Crosstabulation—Blog utilization for instructional purposes by gender.
Reviewing the results with highest count indicates that male faculty members had a higher count on the never utilizing Blog, rarely utilizing Blogs, sometimes utilizing Blogs, and often utilizing Blogs. Female faculty members had a higher count on very often utilizing Blogs for instructional purposes. Figure 2
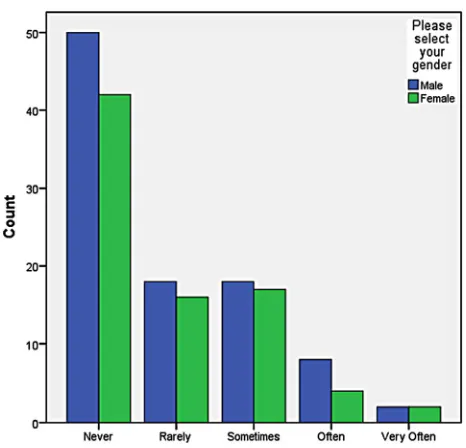
shows the impact of gender on the level of Facebook utilization at their respective university.
Reviewing the results with highest count indicates that male faculty members had a higher count on never utilizing Face- book, rarely utilizing Facebook, and often utilizing Facebook for instructional purposes. Female faculty members had a higher count on sometimes utilizing Facebook, and very often utilizing Facebook for instructional purposes. Figure 3 shows the impact
of gender on the level of Podcast utilization at their respective university.
Reviewing the results with highest count indicates that male faculty members had a higher count on never utilizing Podcast, rarely utilizing Podcast, sometimes utilizing Podcast, and very often utilizing Podcast for instructional purposes. Female fac- ulty members had a higher count on often utilizing Podcast for instructional purposes. Figure 4 shows the impact of gender on
[image:11.595.308.539.339.559.2]the level of Second Life utilization at their respective univer- sity.
Figure 2.
Crosstabulation—Facebook utilization for instructional purposes by gender.
Figure 3.
Crosstabulation—Podcast utilization for instructional purposes by gender.
Reviewing the results with highest count indicates that male faculty members had a higher count on never utilizing Second Life, rarely utilizing Second Life, sometimes utilizing Second Life, and often utilizing Second Life for instructional purposes. Neither male nor female faculty members measured on the chart as very often utilizing Second Life for instructional pur- poses. Figure 5 shows the impact of gender on the level of
Skype utilization at their respective university.
Figure 4.
Crosstabulation—Second Life utilization forinstructional purposes by gender.
Figure 5.
Crosstabulation—Skype utilization for instructional purposes by gender.
structional purposes. Figure 6 shows the impact of gender on the level of Twitter utilization at their respective university.
Reviewing the results with highest count indicates that male faculty members had a higher count on never utilizing Twitter, sometimes utilizing Twitter, and often utilizing Twitter for in- structional purposes. Female faculty members had a higher count on rarely utilizing Twitter, and very often utilizing Twitter for instructional purposes. Figure 7 shows the impact of gender on
the level of Wiki utilization at their respective university. Reviewing the results with highest count indicates that male faculty members had a higher count on never utilizing Wikis, rarely utilizing Wikis, sometimes utilizing Wikis, and often utilizing Wikis for instructional purposes. Female faculty mem-
bers were tied with male faculty members on the count for very often utilizing Wikis for instructional purposes. Figure 8 shows
the impact of gender on the level of YouTube utilization at their respective university.
Reviewing the results with highest count indicates that male faculty members had a higher count on never utilizing You- Tube, rarely utilizing YouTube, and often utilizing YouTube for instructional purposes. Female faculty members had a higher count on sometimes utilizing YouTube and very often utilizing YouTube for instructional purposes.
[image:12.595.307.540.488.712.2]Crosstablulation analyses were conducted to understand the impact of age on the level of Web 2.0 technology utilization at the faculty members’ perspective university. Figure 9 shows
Figure 6.
Crosstabulation—Twitter utilization for instructional purposes by gen- der.
Figure 7.
Figure 8.
Crosstabulation—YouTube utilization for instructional purposes by gender.
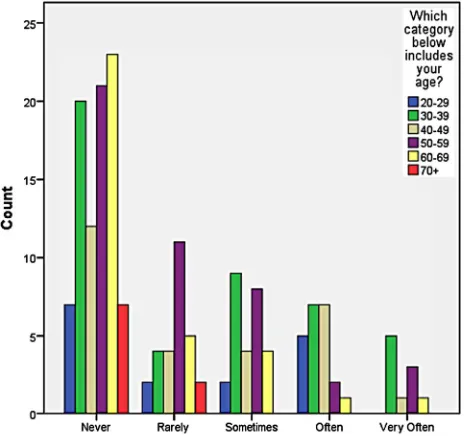
Figure 9.
Crosstabulation—Blog utilization for instructional purposes by age.
the impact of age on the level of Blog utilization at faculty members’ respective university.
Reviewing the results with highest count indicates overall, participants in the age range of 60 - 69 have never utilized Blogs; participants in the age range of 50 - 59 have rarely util- ized Blogs and sometimes utilized Blogs; participants in the age range of 30 - 39 often utilize Blogs and very often utilized Blogs for instructional purposes. Figure 10 shows the impact
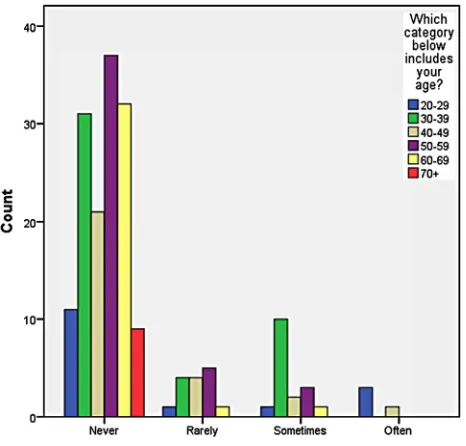
of age on the level of Facebook utilization at the faculty mem- bers’ respective university.
Reviewing the results with highest count indicates overall, participants in the age range of 60 - 69 have never utilized Facebook; participants in the age range of 50 - 59 have rarely
utilized Facebook; participants in the age range of 30 - 39 sometimes utilized Facebook and very often utilized Facebook for instructional purposes. Participants in the age range of 30 - 39 tied with participants in the age range of 40 - 49 who often utilize Facebook for instructional purposes. Figure 11 shows
the impact of age on the level of Podcast utilization at the fac- ulty members’ respective university.
[image:13.595.56.289.344.572.2]Reviewing the results with highest count indicates overall, participants in the age range of 50 - 59 have never utilized Podcasts and have very often utilized Podcast; participants in the age range of 30 - 39 sometimes utilized Podcasts; partici- pants in the age range of 30 - 39 and 40 - 49 tied with the count of those who rarely utilized Podcast and often utilized Podcast for
Figure 10.
Crosstabulation—Facebook utilization for instructional purposes by age.
Figure 11.
[image:13.595.307.541.489.714.2]instructional purposes. Figure 12 shows the impact of age on
the level of Second Life utilization at the faculty members’ respective universities.
Reviewing the results with highest count indicates overall, participants in the age range of 50 - 59 have never utilized Second Life, and have rarely utilized Second Life; participants in the age range of 30 - 39 sometimes utilized Second Life; and participants in the age range of 20 - 29 have often utilized Sec- ond Life for instructional purposes. Figure 13 shows the im-
pact of age on the level of Skype utilization at the faculty mem- bers’ respective university.
[image:14.595.57.290.230.453.2]Reviewing the results with highest count indicates overall, participants in the age range of 50 - 59 have never utilized
Figure 12.
Crosstabulation—Second Life utilization for instructional purposes by age.
Figure 13.
Crosstabulation—Skype utilization for instructional purposes by age.
[image:14.595.307.541.238.463.2]Skype, and have rarely utilized Second Life; participants in the age range of 30 - 39 sometimes utilized Skype, often utilized Skype and very often utilized Skype for instructional purposes.
Figure 14 shows the impact of age on the level of Twitter uti- lization at the faculty members’ respective university.
Reviewing the results with highest count indicates overall, participants in the age range of 50 - 59 have never utilized Twitter; participants in the age range of 30 - 39 rarely utilized Twitter, sometimes utilized Twitter, and often utilized Twitter; participants in the age range of 40 - 49 and 50 - 59 tied with the count of those who very often utilized Twitter for instructional purposes. Figure 15 shows the impact of age on the level of Wiki utilization at the faculty members’ respective university.
[image:14.595.308.541.490.715.2]Reviewing the results with highest count indicates overall,
Figure 14.
Crosstabulation—Twitter utilization for instructional purposes by age.
Figure 15.
participants in the age range of 60 - 69 have never utilized Wikis; participants in the age range of 30 - 39 rarely utilized Wikis and sometimes utilized Wikis; participants in the age range of 50 - 59 often utilized Wikis; and participants in the age range of 40 - 49 very often utilized Wikis for instructional pur- poses. Figure 16 shows the impact of age on the level of You-
Tube utilization at the faculty members’ respective university. Reviewing the results with highest count indicates overall, participants in the age range of 50 - 59 have never utilized YouTube, and have rarely utilized YouTube; participants in the age range of 30 - 39 sometimes utilized YouTube, often utilized YouTube and very often utilized YouTube for instructional purposes.
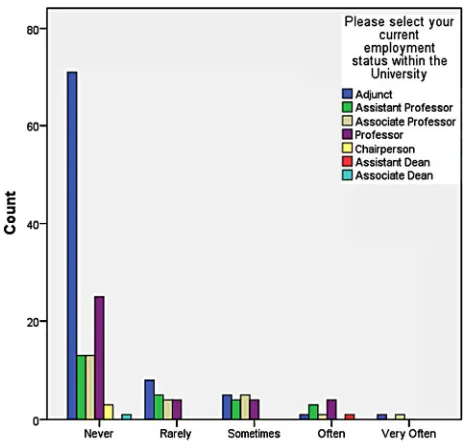
Crosstablulation analyses were conducted to understand the impact of employment status on the level of Web 2.0 technol- ogy use at the faculty members’ university. Figure 17 shows
the impact of employment status on the level of Blog utilization at faculty members’ respective university.
Reviewing the results with highest count indicates overall, participants whose employment status was adjunct have never utilized Blogs, have rarely utilized Blogs, have sometimes util- ized Blogs, and have very often utilized Blogs; participants whose employment status was professor often utilized Blogs for instructional purposes. Figure 18 shows the impact of em-
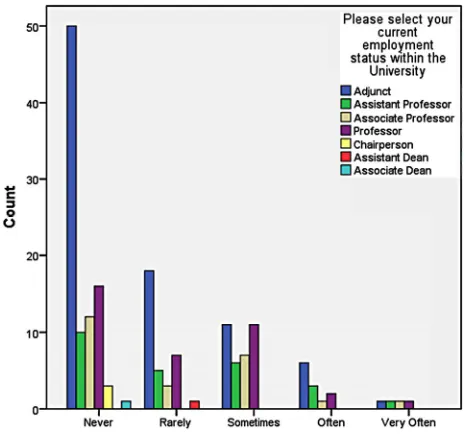
ployment status on the level of Facebook utilization at faculty members’ respective university.
Reviewing the results with highest count indicates overall, participants whose employment status was adjunct have never utilized Facebook, have rarely utilized Facebook, have some-times utilized Facebook, have often utilized Facebook, and have very often utilized Facebook for instructional purposes. Figure 19 shows the impact of employment status on the level of Pod-
cast utilization at faculty members’ respective university. Reviewing the results with highest count indicates overall, participants whose employment status was adjunct have never utilized Podcasts, have rarely utilized Podcasts, and have some- times utilized Podcast for instructional purposes. Participants
Figure 16.
Crosstabulation—YouTube utilization for instructional purposes by age.
Figure 17.
Crosstabulation—Blog utilization for instructional purposes by em- ployment status.
Figure 18.
Crosstabulation—Facebook utilization for instructional purposes by employment status.
whose employment status was assistant professor, associate professor and professor tied in the count for those who often utilized Podcasts; and participants whose employment status was assistant professor and professor tied in the count for those who very often utilized Podcasts for instructional purposes.
Figure 20 shows the impact of employment status on the level
of Second Life utilization at faculty members’ respective uni- versity.
Figure 19.
Crosstabulation—Podcast utilization for instructional purposes by em- ployment status.
Figure 20.
Crosstabulation—Second Life utilization for instructional purposes by employment status.
was professor often utilized Second Life; participants whose employment status was assistant professor and associate pro- fessor tied in the count for those who rarely utilized Second Life; and participants whose employment status was adjunct and associate professor tied in the count for those who some- times utilized Second Life for instructional purposes. Figure 21
shows the impact of employment status on the level of Skype utilization at faculty members’ respective university.
Reviewing the results with highest count indicates overall, participants whose employment status was adjunct have never utilized Skype, have rarely utilized Skype, have sometimes util- ized Skype, and have very often utilized Skype for instructional
purposes. Participants whose employment status was professor often utilized Skype for instructional purposes. Figure 22 shows
the impact of employment status on the level of Twitter utiliza- tion at faculty members’ respective university.
[image:16.595.56.289.345.571.2]Reviewing the results with highest count indicates overall, participants whose employment status was adjunct have never utilized Twitter, and have rarely utilized Twitter for instruc- tional purposes. Participants whose employment status was pro- fessor have often utilized Twitter. Participants whose employ- ment status was adjunct and associate professor tied for the count of those who sometimes utilized Twitter and very often utilized Twitter for instructional purposes. Figure 23 shows the
Figure 21.
Crosstabulation—Skype utilization for instructional purposes by em- ployment status.
Figure 22.
[image:16.595.307.540.481.705.2]impact of employment status on the level of Wiki utilization at faculty members’ respective university.
Reviewing the results with highest count indicates overall, participants whose employment status was adjunct have never utilized Wikis, have rarely utilized Wikis, and have often util- ized Wikis for instructional purposes. Participants whose em- ployment status was adjunct and tied for the count of those who sometimes utilized Wikis; and participants whose employment status was adjunct, assistant professor, associate professor, and professor tied for the count of those who very often utilized Wikis for instructional purposes. Figure 24 shows the impact
[image:17.595.56.290.230.450.2]of employment status on the level of YouTube utilization at faculty members’ respective university.
Figure 23.
Crosstabulation—Wiki utilization for instructional purposes by em- ployment status.
Figure 24.
Crosstabulation—YouTube utilization for instructional purposes by employment status.
Reviewing the results with highest count indicates overall, participants whose employment status was adjunct have never utilized YouTube, have rarely utilized YouTube, have some- times utilized YouTube, and have very often utilized YouTube for instructional purposes. Participants whose employment status was assistant professor often utilized YouTube for instructional purposes.
Section 3 of the survey included 19 questions that asked the faculty members, by using a scale of strongly disagree to strongly agree, to identify which statements most closely matches their agreement with each statement. Survey Question 22 asked the participants if using Web 2.0 technologies improve the quality of teaching. Table 24 shows the results.
The majority of the faculty members (82 or 46.3%) felt neu- tral about the utilization of Web 2.0 technologies improving the quality of teaching, while 65 or 36.7% of the faculty members agreed that using Web 2.0 technologies improves the quality of teaching. Of the 177 participants, 12 or 6.8% of the faculty members strongly agreed that using Web 2.0 technologies im- proves the quality of teaching. Survey Question 23 asked the participants if using Web 2.0 technologies enhances student’s experience. The results of this question are in Table 25.
The majority of the faculty members (81 or 45.8%) agreed that using Web 2.0 technologies enhances student’s experiences, while 65 or 36.7% of the faculty members remained neutral. Of the 177 participants, 15 or 8.5% of the faculty members strongly agreed that using Web 2.0 technologies enhances student’s experience, and 11 or 6.2% disagreed with the statement. Sur- vey Question 24 asked the participants if learning to use Web 2.0 technologies was easy for them. The results of this question can be found in Table 26.
Table 24.
Frequency table—using Web 2.0 technologies improves the quality of teaching.
Frequency Percent Percent Valid Cumulative Percent Strongly
Disagree 7 .6 4.0 Valid
Disagree 11 .9 6.2
Neutral 82 6.8 46.3
Agree 65 5.4 36.7
Strongly
Agree 12 1.0 6.8
Valid
Total 177 14.7 100.0
Missing System 1030 85.3 Missing
Total 1207 100.0
Table 25.
Frequency table—using Web 2.0 technologies enhances student’s ex- periences in the classroom.
Frequency Percent Valid Percent
Cumulative Percent Strongly
Disagree 5 .4 2.8 2.8
Disagree 11 .9 6.2 9.0
Neutral 65 5.4 36.7 45.8
Agree 81 6.7 45.8 91.5
Strongly
Agree 15 1.2 8.5 100.0
Valid
Total 177 14.7 100.0
Missing System 1030 85.3
[image:17.595.57.291.486.705.2]