Munich Personal RePEc Archive
An analysis of Turkish hydropower policy
Erdogdu, Erkan
Energy Market Regulatory Authority, Republic of Turkey, Judge
Business School, University of Cambridge, UK
January 2011
Online at
https://mpra.ub.uni-muenchen.de/26791/
An analysis of Turkish hydropower policy
Erkan Erdogdua,b,c,*
a
Energy Market Regulatory Authority
Muhsin Yazicioglu Caddesi No:51/C 06530 Yuzuncuyil/Ankara Turkey
b
Judge Business School, University of Cambridge
Trumpington Street CB2 1AG Cambridge, UK
Abstract
Over the last decade, Turkish electricity demand has increased more than 8% per annum as a
result of economic development. Being one of the renewable energy sources par excellence,
non-exhaustible, non-polluting and economically more attractive than other renewable
sources, hydropower has turned out to be an important contributor to the future energy mix of
the country. This paper deals with hydropower policies to meet increasing electricity demand
for sustainable energy development in Turkey. Turkey has a total gross hydropower potential
*
Corresponding author. Tel.: +90-506-3237325
of 433 TWh/year and 140 TWh/year of this capacity can be used economically, corresponding
to the second largest economic potential in Europe. Currently only 35% of economic hydro
potential of the country is utilized. After completion of hydropower plants under construction,
this figure will increase to 49%. It is obvious that even after the construction of all projects
there will still be a huge hydro potential in Turkey. Besides, Turkey is a poor country in terms
of fossil fuels (oil, natural gas, coal and so on) and has no nuclear power plant in operation,
which strengthens the role of hydro energy among other alternatives.
Keywords: Hydro energy; energy policy; Turkey
1. Introduction
Approximately 70% of the Earth's surface is covered with water, a resource that has been
exploited for many centuries. Actually, water manipulation dates from the dawn of
civilization. Mesopotamians built dams and irrigation canals at least 8000 years ago and town
water supply systems operated from 3000 BC in Jordan. Ancient water systems and dams
have been found in Asia and South America. Humans began to capture energy from flowing
water using wheels with buckets to lift water in ancient Egypt and Sumeria. In 1832, Benoit
Fourneyron had developed a water turbine to capture the potential energy of falling water, far
more useful than flow-dependent waterwheels. Then, modern dams began to spread to the
developing world [1].
Hydro energy is obtained by allowing water to fall on a turbine to turn a shaft. Electricity is
produced from the kinetic energy of falling water. The water in rivers and streams can be
inexpensive, and like many other renewable energy sources (RES), it does not produce air
pollution.
Hydropower is also certainly the largest and most mature application of renewable
technologies. In 2007, it was worldwide responsible for 3,078 terawatt-hours (TWh) of
electricity output, which means about 15.5% of the world's entire electricity demand came
from hydropower installations. Hydropower is critically important for many countries; it
produces more than 50% of electricity for more than 60 countries. In 2007, the largest
hydropower generating countries were China (485 TWh), Brazil (374 TWh) and Canada (368
TWh). Other big hydropower producers are United States, Russia and Norway. Table 1
[image:4.595.154.441.435.767.2]provides worldwide hydropower output in 2007 by countries [2].
Table 1. Hydropower output in 2007 (GWh)
Country Hydropower Production (GWh) %
China 485,264 15.8
Brazil 374,015 12.1
Canada 368,407 12.0
United States 249,619 8.1
Russia 177,048 5.8
Norway 133,934 4.4
Paraguay 53,725 1.7
Colombia 44,445 1.4
Austria 35,993 1.2
Turkey 35,851 1.2
Switzerland 35,250 1.1
Italy 32,816 1.1
Argentina 30,514 1.0
Vietnam 29,883 1.0
Pakistan 28,707 0.9
Other Countries 557,724 18.1
World Total 3,078,422 100
Turkey has a gross annual hydro potential of 433 TWh, corresponding to 13.7% of the total
hydropower capacity in Europe (see Table 2). Almost half of the gross potential is technically
exploitable and 32.3% (140 TWh/year) is economically usable. Currently, 25.6% (35.8 TWh)
of this economically-feasible hydropower energy potential is being generated annually by 172
hydroelectric power plants with a total installed capacity of 13,700 MW. Current hydropower
[image:5.595.97.500.631.742.2]generation capacity accounts for 32.8% of the nation's total installed capacity [3].
Table 2. Hydropower potential (GWh/year)
Gross Potential Technical Potential Economic Potential
World 40,150,000 14,060,000 8,905,000
Europe 3,150,000 1,225,000 1,000,000
The focus of this article will be on the analysis of Turkish hydropower utilization and policy.
The paper is organized as follows. The next section provides an overview of current energy
profile of Turkey. Section three focuses on hydropower utilization in Turkey. A brief account
of economics of hydropower is presented in section four, followed by a section on advantages
and disadvantages of hydropower development. Section six evaluates Turkish hydropower
policy so far. The last section concludes with some policy suggestions.
2. Current energy profile of Turkey
Similar to balance sheet of a company, every country has an energy balance table that reflects
its current energy profile. Turkey’s energy balance table for 2007 is provided in Table 3 [4].
As can be seen in the table, Turkey's main energy sources are coal, oil, natural gas,
hydropower, geothermal, solar, wind and waste. In 2007, primary energy production and final
consumption has reached 100 million tonnes (Mt) of oil equivalent (Mtoe) and 76.5 Mtoe
respectively. Fossil fuels provided about 90.5% of the total primary energy production, with
oil (30.7%) in first place, followed by coal (29.4%) and natural gas (30.4%). The Turkish coal
sector, which includes hard coal as well as lignite, accounts for more than half (54.2%) of the
country's total primary energy production, with lignite being the main domestic energy
source. The renewables collectively provided 9.6% of the primary energy, mostly in the form
of waste (5.1%), hydropower (about 3.1%), geothermal (1.0%), and much less by other
Table 3. Energy balance table of Turkey in 2007 (ktoe)
Coal Crude Oil Petroleum Natural gas Hydro Geothermal
Solar & Wind
& Other
Waste Electricity Heat Total
Production 14,793.7 2,108.6 0.0 735.0 3,083.2 1,047.6 450.4 5,054.8 0.0 0.0 27,273.3
Imports 14,639.8 23,279.1 14,342.5 29,784.2 0.0 0.0 0.0 0.0 74.3 0.0 82,119.9
Exports 0.0 0.0 -6,093.9 -25.5 0.0 0.0 0.0 0.0 -208.3 0.0 -6,327.7
International bunkers 0.0 0.0 -1,984.1 0.0 0.0 0.0 0.0 0.0 0.0 0.0 -1,984.1
Stock changes -48.5 89.8 -1,039.1 -78.6 0.0 0.0 0.0 0.0 0.0 0.0 -1,076.3
Total primary energy supply 29,385.1 25,477.6 5,225.4 30,415.1 3,083.2 1,047.6 450.4 5,054.8 -134.0 0.0 100,005.0
Statistical differences 6.9 115.5 -14.2 0.0 0.0 0.0 0.0 0.0 0.0 0.0 108.1
Electricity plants -12,338.8 0.0 -987.4 -13,073.2 -3,004.6 -133.9 -30.4 -7.9 14,937.0 0.0 -14,639.2
Autoproducer electricity plants -780.3 0.0 -164.3 -857.5 -78.6 0.0 -0.2 -42.9 778.5 0.0 -1,145.2
CHP plants 0.0 0.0 -1.1 -931.3 0.0 0.0 0.0 0.0 219.0 570.9 -142.4
Autoproducer CHP plants -182.6 0.0 -262.7 -944.2 0.0 0.0 0.0 -7.2 539.5 461.0 -396.3
Petroleum refineries 0.0 -25,650.9 25,704.2 0.0 0.0 0.0 0.0 0.0 0.0 0.0 53.3
Coal transformation -1,787.7 0.0 0.0 0.0 0.0 0.0 0.0 0.0 0.0 0.0 -1,787.7
Non-specified (transformation) 0.0 57.9 -59.9 0.0 0.0 0.0 0.0 0.0 0.0 0.0 -2.0
Own use -303.1 0.0 -1,492.0 -534.8 0.0 0.0 0.0 0.0 -908.3 0.0 -3,238.3
Total final consumption 13,978.8 0.0 27,948.0 14,053.3 0.0 913.6 419.8 4,996.8 13,140.0 1,031.9 76,482.2
Industry sector 11,228.9 0.0 1,418.7 3,716.5 0.0 0.0 125.9 0.0 6,144.7 1,031.9 23,666.7
Transport sector 0.0 0.0 15,692.2 167.0 0.0 0.0 0.0 12.4 80.4 0.0 15,952.0
Residential 2,749.8 0.0 1,745.1 6,901.0 0.0 913.6 293.9 4,984.4 3,137.0 0.0 20,724.9
Commerce and public services 0.0 0.0 0.0 3,066.1 0.0 0.0 0.0 0.0 3,349.5 0.0 6,415.6
Agriculture/forestry/fishing 0.0 0.0 3,457.4 0.0 0.0 0.0 0.0 0.0 428.4 0.0 3,885.8
Non-energy use 0.0 0.0 5,634.5 202.7 0.0 0.0 0.0 0.0 0.0 0.0 5,837.2
Turkey has not utilized nuclear energy yet. Tenders to build nuclear power plants were
cancelled several times because of resistance by environmentalists and potentially high
operating costs. The current government plans to have a nuclear power plant with a capacity
of 1,800 MW at the Black Sea port of Sinop. The plant is scheduled to become operational in
2014, but the project is highly controversial. The government's initial plan was to construct
three plants with a total capacity of 5,000 MW but this had to be scaled back.
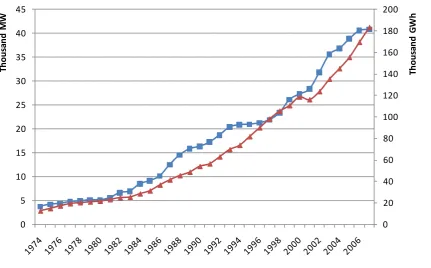
In 2007, Turkey had 40,835 MW of electricity generating capacity. An historical summary of
installed capacity and electricity generation in Turkey is shown in Figure 1. As can be seen in
the graph, electricity generation in Turkey has more than quadrupled over the last two
decades. In 2007, total net electricity production of Turkey has reached about 183.3
terawatt-hours (TWh), 81% of this is produced from thermal power plants, 18.7% from hydro power
plants and the remainder 0.3% from other renewable sources. Turkish electricity generation is
mainly derived from natural gas, hydro and coal sources (see Figure 2 and 3). Electricity
demand in Turkey is growing rapidly, with the rate of increase of 7.8% on average for the last
three decades [2]. According to official electricity demand projections given in Figure 4,
Figure 1. Installed capacity and electricity output since 1974 0 20 40 60 80 100 120 140 160 180 200 0 5 10 15 20 25 30 35 40 45 T h o u s a n d G W h T h o u s a n d MW
[image:10.595.95.456.465.714.2]Installed Capacity (MW) Net Electricity Production (GWh)
Figure 2. Installed capacity in 2007 (by fuel)
Figure 3. Electricity output in 2007 (by fuel)
Hydro 18,7%
Natural Gas 49,6% Coal
27,9%
Other Combustible Fuels 3,5%
Renewables 0,3%
Figure 4. Development of electricity demand in Turkey
0 50 100 150 200 250 300 350 400
2009 2010 2011 2012 2013 2014 2015 2016 2017 2018
[image:11.595.127.469.421.602.2]3. Hydropower in Turkey
The gross and technical hydropower potential of Turkey are estimated at 433 and 216
TWh/year respectively. The economic potentials for installed hydropower capacity and
electricity output have been anticipated roughly as 45,000 MW and 140 TWh/year
respectively (Table 2 and Table 4). The gross hydroelectric potential of Turkey is about 1% of
the world total and about 14% of the European total [3].
In Turkey, hydro projects were initiated by the Ministry of Public Works in the early 1930s.
The Electrical Power Resources Planning and Survey Administration (EIE) was established in
1935 to project Turkey's energy demand, carrying out surveys and studies to develop
hydropower potential of the country and other energy resources. However, construction of the
dams in real sense started after the end of the World War II except for a few small dams that
had been built for irrigation purposes. Since then, the construction of dams and hydropower
plants has increased to meet the demand for irrigation and electricity generation. Within 20
years after the establishment of State Hydrologic Works (“DSI” in Turkish initials) in 1954,
hydropower production increased to 3,255 GWh, corresponding to 25.3 of total production.
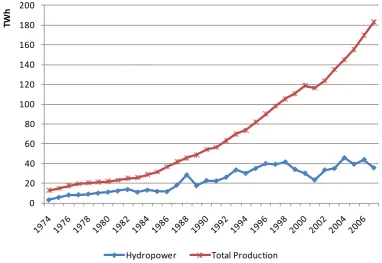
Until the early 1990s, hydropower increased its share in total production. However, in the last
two decades, the share of hydro plants has decreased as a result of the rapid increase in natural
gas plants (from 62% in 1988 to 19% in 2007). Figure 5 presents the development of
Figure 5. Hydropower utilization in Turkey since 1974
0 20 40 60 80 100 120 140 160 180 200
TW
h
Hydropower Total Production
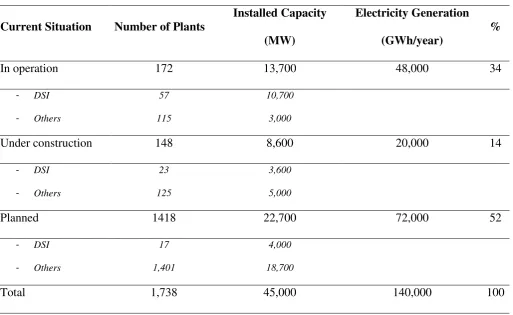
As of 2009, 172 hydropower plants have been put into operation, 148 are under construction
and a further 1,418 are at various planning stages, see Table 4. Hydropower plants in
operation have an installed capacity of 13,700 MW with an annual average generation of
48,000 GWh. Only 34% of the economically utilizable hydro potential has been developed in
Turkey. Besides, 78% of the total hydro capacity in operation has been developed by DSI,
corresponding to 10,700 MW (57 hydro plants) of installed capacity. Table 5 lists hydropower
plants in operation with a capacity of more than 100 MW in Turkey. As can be seen in Table
5, the most important rivers for hydropower development are Euphrates and Tigris, both of
which are trans-boundary rivers originating in Turkey and discharging into the Persian Gulf.
Euphrates and Tigris represent over 28% of the country's water supply by rivers and the
economically irrigable areas in the region make up 20% of the total in Turkey. In 1977, these
two basin projects were given a single title, namely the Southeastern Anatolia Project (GAP
Euphrates and Tigris for irrigation and power generation. Seven of these projects are in the
basin of the Euphrates and six in that of the Tigris. These projects envisage the construction
of 22 dams and 19 power plants, generation of 27 TWh of electricity per year over an
installed capacity of 7,485 megawatts (MW), and irrigation that will cover 1.7 million
[image:14.595.44.558.259.574.2]hectares of land [6].
Table 4. Hydropower plants in Turkey
Current Situation Number of Plants
Installed Capacity
(MW)
Electricity Generation
(GWh/year)
%
In operation 172 13,700 48,000 34
- DSI
- Others
57
115
10,700
3,000
Under construction 148 8,600 20,000 14
- DSI
- Others
23
125
3,600
5,000
Planned 1418 22,700 72,000 52
- DSI
- Others
17
1,401
4,000
18,700
Total 1,738 45,000 140,000 100
Table 5. Current hydropower plants above 100 MW capacity in Turkey
No
Name of the Construction Construction
River City
[image:14.595.38.556.628.768.2]4 Altinkaya 1980 1988 Kizilirmak Samsun 700 1,632
5 Birecik (2) 1993 2000 Euphrates Sanliurfa 672 2,518
6 Oymapinar 1977 1984 Manavgat Antalya 540 1,620
7 Berke (2) 1991 2001 Ceyhan K.Maras 510 1,672
8 Hasan Ugurlu 1971 1981 Yesilirmak Samsun 500 1,217
24 Borcka 1999 2007 Coruh Artvin 300 1,039
9 Sir (2) 1987 1991 Ceyhan K.Maras 284 725
10 Gokcekaya 1967 1972 Sakarya Eskisehir 278 562
11 Batman 1986 2004 Batman Batman 198 483
12 Karkamis 1996 1999 Euphrates Maras 180 652
13 Ozluce 1985 1998 Peri Bingol 170 413
14 Catalan 1982 1996 Seyhan Adana 169 596
15 Sariyar (2) 1950 1956 Sakarya Ankara 160 400
16 Gezende 1979 1990 Ermenek Icel 159 528
17 Aslantas 1975 1984 Ceyhan Adana 138 569
18 Hirfanli 1953 1959 Kizilirmak Kirsehir 128 400
19 Menzelet 1980 1989 Ceyhan K.Maras 124 515
20 Kilickaya 1980 1989 Kelkit Sivas 124 332
21 Muratli 1999 2005 Coruh Artvin 115 444
21 Dicle 1986 1997 Tigris Diyarbakir 110 298
4. Economics of hydropower
While renewable energy sources require no fuel and their operation and maintenance costs
(O&M) are generally low, the initial capital costs of renewables are relatively high for per
unit of capacity installed. High capital cost is considered to be one of the major barriers to
greater use of renewable technologies. Higher generation costs of renewable energy might be
attributed to two main aspects. First, renewable energy has higher capital costs than
fossil-fuelled systems. Second, external environmental and social costs of fossil fuels have been
ignored by markets. These costs include pollution, greenhouse gas emissions, and even
military expenditures to defend overseas oil supplies.
Another vital factor in the development and use of hydropower is financing. Much of the cost
of generating electricity with oil, coal and gas is the cost of fuel and therefore a thermal
investment is made and recouped in relatively short period of time. With renewable
technologies, however, the initial capital outlay is large and must be recovered slowly over a
period of many years, making it difficult to attract capital. Thus, investment in hydropower is
discouraged at the outset.
Like other renewable energy sources, hydropower plants in Turkey are capital intensive but
have lower operational costs than thermal options. The high initial cost is a serious barrier for
its growth. Table 6 presents a comparison of costs of power plants in Turkey [7]. As seen in
is zero in hydro plants. Besides, investment and operating cost in Turkey are very low in
comparison with many developed countries due to low construction and labor cost.
When considering hydropower development within a country, it is also important to look at
its effects in overall economics of the country. It should be noted that hydropower
development means that a substantially larger percentage of the capital investment stays
within the country as much of the developmental work can be done by local engineers and
contractors. The more sophisticated thermal power plants are designed and built by
specialized contractors, and this often means that large amounts of capital leave the domestic
economy. In many instances, the same is true for the amount of capital necessary for fuel used
by thermal power plants. In addition, hydro-power facilities require minimal maintenance and
do not have the same requirements for skilled personnel as do the more sophisticated thermal
Table 6. Main characteristics of typical power plants in the Turkish power system in 2006
Capacity of plant
in general (MW)
Economic life
(years)
Capacity
utilization rate (%)
Efficiency (%)
Share in total
generation (%)
Fuel heat
content
(kcal/kg)
Fuel cost
(€/tonne)
Total capital
cost (€/kW)
Total transmission
capital costs (€/kW)
Natural Gas (CCGT) 600 20 65.0 60.4 40.9 8,100 260 720 570
Imported Coal 500 20 76.3 41.4 5.5 6,000 55 1,150 570
Hard Coal 300 20 75.3 44.9 1.5 3,500 40 1,450 570
Lignite 160 20 45.1 34.1 18.1 2,470 17 1,450 570
Fuel Oil (CCGT) 160 20 15.2 48.2 1.4 9,860 270 960 570
Hydropower (Dam) 500 20 38.9 - 24.0 - 0 1,420 570
Hydropower (River) 10 20 34.1 - 1.1 - 0 1,520 0
Bio-CHP 2 20 34.2 - 0.1 - 10 1,200 0
Geothermal 15 20 61.6 - 0.1 - 0 1,700 0
5. Advantages and disadvantages of hydropower development
As discussed in previous section, the main drawback of hydropower is its initial capital cost.
Additionally, dams constructed for hydropower plants raise some social and environmental
concerns. The environmental implications are different from fossil fuel cycles. The main
implications to be considered with hydroelectricity are the land and water ecosystem impacts
associated with construction and operating hydro dams. These concerns include effects of
changing river flows on ecosystem regimes, flooding of extensive land areas resulting in
relocation of residents and loss of agricultural land, silt deposition and impact on certain
sensitive species. Mini hydro and small-scale hydro dams could avert some of social and
environmental problems. They could also reduce power shortage vulnerability during drought
seasons experienced in large hydro plants. Furthermore, hydropower's fuel sources is
renewable, it is available on site (no mining, transporting etc. required), and no combustion is
involved. Hydropower releases no CO2 directly. It however also has the significant
disadvantage that generation depends on rainfall, which varies from year to year.
Unlike fossil fuels, hydro resources are widely spread around the world. Potential exists in
about 150 countries, and about 65% of the economically feasible potential remains to be
developed (see Table 1 and 2). Compared to fossil fuels, Turkey is very rich in terms of hydro
potential. Besides, hydropower is a proven and well advanced technology with modern power
plants providing the most efficient energy conversion process (>90%), which is also an
important environmental benefit. Thanks to its fast response time, hydropower plants can be
used as peak load. Moreover, it has the lowest operating costs and longest plant life compared
with other large scale generating options. Typically a hydro plant may operate up to 40-50
(i.e. water) is renewable, and is not subject to fluctuations in market. Hydro also represents
energy independence for many countries.
With growing concern over greenhouse gas emissions and increased demand for electricity,
hydropower becomes a key component in energy policies of countries with abundant water
sources. Hydropower facilities offer a range of additional benefits. Many dams are used to
control flooding, regulate water supply, irrigate land and prevent erosion, and reservoirs
provide lakes for recreational purposes.
Actually, in practice, no form of energy production is completely free of effects on the
environment. Renewable energy sources have also negative environmental effects even if they
are called as green energy. However, these negative effects cannot be compared to those of
fossil energy sources. Hydropower plays a major role in reducing greenhouse gas emissions in
terms of avoided generation by fossil fuels. Hydro has a relatively small source of
atmospheric emissions compared with fossil-fired generating options. Hydropower also
avoids the substantial impact of particulate emissions (e.g. ash). Similarly, hydropower
production does not create hazardous or radioactive wastes that require safe long-term storage
facilities. Many other environmental impacts associated with the overall fuel cycles of other
energy sources are minor or nonexistent for hydroelectric power. These include impacts
associated with resource extraction (e.g., coal mining, oil drilling), fuel preparation (e.g.,
power facilities require, significantly alter the aquatic habitat and the species present. For
instance, a dam may typically hinder migrating fish species in their spawning activities and
cause water quality problems.
6. Evaluation of Turkish hydropower policy
Approved by parliament in February 2001, the Electricity Market Law brought Turkish
legislation in line with that of the EU. As foreseen in the law, an energy watchdog, the Energy
Market Regulatory Authority (EMRA), took over responsibility for the electricity market in
late 2002. Eventually it is expected to supervise a free market in which private generation
companies produce electricity and sell it to private trading companies, large users and
distributors under bilateral contracts freely negotiated by the parties. The government
meanwhile is supposed to privatize generation assets (including hydro sources) - which
account for some 57.3% of total generating capacity (currently owned by public generation
company, EUAS) - and make the transmission network available to all comers (see Table 7)
[8]. Distribution is also to be privatized. Households and small commercial users currently
purchase their electricity from public distribution company TEDAS (except in three regions
where distribution is in the hands of private distribution monopolies). Distribution activities in
all regions are envisaged to be operated by private distributors in the future. In preparation for
the envisaged open market, the public generation and transmission company, TEAS, has been
divided into three companies: EUAS, to manage the generation capacity that remains in
public domain; TEIAS, to handle transmission; and TETAS, to carry out electricity wholesale
Table 7. The distribution of installed capacity (MW) in Turkey (2008)
EUAS
Affiliated
Partnerships of
EUAS
Mobile
Power
Plants
Production
Companies &
Autoproducers &
TOOR
Turkey
Total
Thermal 8,690.9 3,834.0 262.7 14807.4 27,595.0
Hydro 11,455.9 0 0 2372.8 13,828.7
Geothermal 0 0 0 363.7 363.7
Wind 0 0 0 29.8 29.8
Total 20,146.8 3,834.0 262.7 17,573.7 41,817.2
Turkey is one of European Union (EU) candidate countries, thus, it is expected that the laws
in Turkey have to be compatible to EU regulations and policy. In the context of energy
production, EU promotes electricity generation from renewable energy sources. The main
instruments for promoting renewables are feed-in tariffs, quota obligations, tenders and
(energy) tax exemptions. However, existing Turkish law and regulation with relevance to the
use of renewable energy sources is limited to only two pieces of legislation. One piece of
legislation is the Electricity Market Licensing Regulation, and the second is the Law on
Utilization of Renewable Energy Resources for the Purpose of Generating Electrical Energy
(Law Number 5346, dated May 10, 2005). In the regulations, only small hydropower plants
reservoir area of 5.9 km2 and 79 MW of installed capacity currently lies within the framework
of Law No. 5346 [9]. Different definitions create a conflict between Turkey and EU. In
European Union, many member states limit the installed capacity of SHPs. Table 8 lists
[image:23.595.122.474.237.704.2]government support for electricity generation for SHPs in some European countries [10].
Table 8. Government support for electricity generation for SHPs in some European countries
Country Feed-in Tariff (€ cent/kWh)
Belgium 12.5
Germany 7.67 (<500kW)
6.65 (500kW-5MW)
Greece 6.29
Spain 6.49
France 11.57 (<500kW)
10.48 (500kW-12MW)
Ireland 6.41
Italy 14.6
Austria 3.15-6.25
Portugal 7.2
Finland 3.02 + subsidy of 30% of investment cost (< 1 MW)
Sweden 4.9
UK 2.38 (<20MW)
Turkey 5.5 (no limitation on installed capacity)
In Turkey, market based policies for renewables started in 1984 with third-party financing,
government's approach to the deployment of renewables reveals its priorities to develop
indigenous and renewable resources in conjunction with the expansion of privately owned and
operated power generation from renewable sources. The build-own-transfer (BOT) and the
build-own-operate (BOO) schemes were put in place in 1984 and financed major power
projects (not limited to renewables) with the main objective of attracting private investors.
BOT projects were granted a treasury guarantee. Although BOT and BOO approaches
attracted significant investment, they also created large public obligations with the
government covering the market risk through take-or-pay contracts. The BOT and BOO
financing schemes ended in 2000 and were replaced in 2001 by financial incentives within the
framework of the Electricity Market Law (Law Number 4628)1.
According to the Electricity Market Licensing Regulation, promotion of renewable energy
sources in the electricity market has been assigned to the Energy Market Regulatory
Authority (EMRA). Specifically, the Regulation states that the issues assigned to the Energy
Market Regulatory Authority are “With regard to the environmental effects of the electricity
generation operations, to take necessary measures for encouraging the utilization of
renewable and domestic energy resources and to initiate actions with relevant agencies for
provision and implementation of incentives in this field”. In this context, there are some
incentives and regulations related to renewable energy sources. The incentives brought into
existence based on the Electricity Market Licensing Regulation are given below:
• The generation facilities based on renewable energy resources shall not pay annual
license fees for the first 8 years following the facility completion date indicated on
their respective licenses.
• Turkish Electricity Transmission Company (TEIAS) and/or distribution companies
shall assign priority for system connection of generation facilities based on domestic
natural resources and renewable resources.
The aim of the Law on Utilization of Renewable Energy Resources for the Purpose of
Generating Electrical Energy is to increase the use of renewable energy sources for generating
electricity, as well as to diversify energy resources, reduce greenhouse gas emissions, assess
waste products, protect the environment, and develop the necessary manufacturing sector for
realizing these objectives. Specific incentives introduced in the law that are applicable to the
use of hydropower include [12]:
• Obligation to purchase electricity from renewable energy sources: Each legal entity
possessing a retail sale license shall be required to purchase renewable energy
source-certified (RES-source-certified) electricity in an amount declared by EMRA.
• Purchasing of electricity from renewable energy sources with a higher price: Until the
end of 2011, the applicable price for the electricity to be purchased in pursuance with
the law within each calendar year shall be the Turkish average wholesale electricity
price in the previous year determined by EMRA. However, this price shall be between
5 and 5.5 Eurocent/kWh. The Council of Ministers is entitled to raise this price up to
20% at the beginning of each year.
• Acquisition of land: In the case of utilization of property which is under the possession
of Forestry or Treasury or under the sovereignty of the State for the purpose of
territories are permitted on the basis of its sale price, rented, given right of access, or
usage permission by the Ministry of Environment and Forestry or the Ministry of
Finance. A fifty percent deduction shall be implemented for permission, rent, right of
access, and usage permission in the investment period.
Although Law No. 5346 has some conflictions with EU policy, the effect of the law has been
immediately seen after its publication on SHP development resulting in a total of 1,024
project applications with an installed capacity of 6,500 MW by private sector in Turkey.
Furthermore, the publication of this law can be considered as an important step in
harmonizing Turkish legislation with that of EU. In addition, Law No. 5784 published in July
2008 allowed legal entities to be exempted from obtaining license to generate electricity from
renewable energy up to a capacity of 500 kW. By this law, government also guarantees to buy
the excess electricity. It can be expected that this law also will give rise to an increase in
installation of mini and micro-hydropower plants in coming years [9].
In order to closely monitor the impact of hydropower plants on natural environment, the
owners of hydro plants are required to comply with the requirements of Water Usage Rights
Act signed between the company and DSI. According to this act, the facility should maintain
a minimum flow (also defined as environmental flow) determined by DSI in the river that is
adequate for the existing fish population, wildlife and water quality taking seasonal
fluctuations in flow levels into account. However, there is not a standard for the determination
obligation for SHP projects in Turkey. This may cause loss of fish and/or fish habitat in the
project area.
To sum up, currently there is no incentive mechanism in Turkey to support the development
of hydropower plants, apart from those having a reservoir area less than 15 km2. This policy
of no-action prevents the development of 50% of Turkey’s economically feasible hydro
sources and has resulted in a sharp decline in hydropower’s contribution to country’s overall
electricity production from 40% in 1997 to 19% in 2007.
7. Policy suggestions and conclusion
As discussed in previous sections, Turkey has significant hydro power potential making it the
second richest country after Norway in Europe. However, currently only 35% of the estimated
economical potential is utilized. Hence, there is much to be done for the utilization of
remaining hydropower potential. There are still many opportunities in Turkey to develop
hydropower plants without any promotion or support. The policy should concentrate on
creating confidence among private investors and removing bureaucratic obstacles in front of
hydropower investments. Another policy development for Turkey can be the manufacturing
of equipment used for hydropower development in domestic market as in the example of
China. Government may put into practice some policies to support private sector to produce
domestic equipment so that the cost and the time for supplying equipment are reduced.
It seems that the laws on renewable energy utilization for electricity generation in Turkey
have brought some improvements to the market. However, they must be revised or redesigned
Energy Law (No. 5346) has connections with EU policy in terms of hydropower
development. The most important conflict, however, is mostly resulted from the definition of
hydropower as a renewable energy source. The law is applicable to hydropower plants having
a reservoir area less than 15 km2, which may include large dams as a renewable energy source
since there is no limitation for installed capacity. This may result in a shift of interest from
river-type hydropower plants to large hydropower plants. However, in most European
countries, installed capacities of hydropower plants are taken into account for government
support. So, current law should be revised and a limitation in terms of installed capacity
should be included in the definition of a renewable energy source.
As fossil fuel energy becomes scarcer, Turkey will face energy shortages, significantly
increasing energy prices, and energy insecurity within the next few decades. Besides,
Turkey's continued reliance on fossil fuel consumption will contribute to accelerating rates of
domestic environmental deterioration and global warming. For these reasons, the
development and use of hydro sources and technologies are increasingly becoming vital for
sustainable economic development of Turkey.
Turkey is an energy-importing country and meets 82% of its energy needs from foreign
sources (see Table 3). In order to be less dependent on other countries, Turkey needs to use its
hydro sources. From this point of view, hydropower is an attractive choice, since it is
economical, sustainable, environmental friendly and a domestic energy source in Turkey.
sector, which has the capacity to mobilize needed funds, must be motivated to participate in
hydropower development. The process of liberalization, restructuring, and privatization in the
Turkish energy sector2 is also vital; which will assist in creating a favorable environment for
investment in hydro energy. Hydro sources in Turkey represent a secure domestic source of
energy that is not subject to price fluctuations and supply uncertainties of imported petroleum
and natural gas. Future supply of hydropower energy depends on energy prices and technical
progress, both of which are driven by energy policy priorities.
Another important barrier preventing widespread use of hydropower in Turkey is the lack of a
coherent national energy plan in which the role of hydro sources is explained. Therefore, first
of all, Turkey must develop and publicize a rational and coherent energy policy and an action
plan; stating short, middle and long term aims, actions and reasons that justify them. Then, the
specific place of hydro sources in the overall energy politics of Turkey should be defined.
What's more, a kind of effective “High Energy Council” must be set up to provide a higher
level of coordination and cooperation within and between institutions, agencies, institutes, and
other stakeholders.
On 5 February 2009, Turkish Parliament ratified an agreement to sign the Kyoto Protocol.
Actually, signing the Kyoto Protocol does not put an additional burden on Turkey until 2012.
Turkey was not a party to the convention adopted in 1992 when the Kyoto Protocol was
negotiated, and it is not currently included in the agreement's Annex-B, which includes 39
countries that are obliged to reduce their greenhouse emissions to 1990 levels between 2008
and 2012. However Turkey will face with an extremely disadvantageous position after 2012
2
unless it starts to take some measures to reduce its GHG emissions by increasing hydropower
utilization
Finally, although the immediate priority of Turkey should be to speed up the transition
process from non-renewable, imported fossil fuels to renewable, domestic energy sources;
policy makers should be aware of the fact that even if major efforts were made to develop all
domestic sources (especially coal and hydro), they still will not be able to meet the rapidly
increasing electricity demand in Turkey in the coming decades. Therefore, policy makers
should seriously consider some other alternative energy sources, including nuclear power3.
References
[1] Sleigh AC, Jackson S. Hydropower Resettlement Projects, Socioeconomic Impacts of. In:
Cutler JC, editor. Encyclopedia of Energy. New York: Elsevier; 2004. p. 315-23.
[2] IEA. Electricity Information: 2009 Edition. Paris/France: International Energy Agency;
2009.
[3] DSI. Hydropower. State Hydrologic Works, Republic of Turkey; 2009.
[4] IEA. Energy balances of OECD countries: 2009 Edition. Paris/France: International
Energy Agency; 2009.
[5] TEIAS. Capacity projection of Turkey for the next decade. Turkish Electricity
Transmission Company; 2009.
[7] Lise W. Towards a higher share of distributed generation in Turkey. Energy Policy.
2009;37:4320-8.
[8] TEIAS. Turkish Electricity Statistics. Turkish Electricity Transmission Company; 2009.
[9] Kucukali S, Baris K. Assessment of small hydropower (SHP) development in Turkey:
Laws, regulations and EU policy perspective. Energy Policy. 2009;37:3872-9.
[10] ESHA. Current situation of small hydro power in the EU-15 according to ESHA’s
members. European Small Hydropower Association; 2004.
[11] Erdogdu E. Regulatory reform in Turkish energy industry: An analysis. Energy Policy.
2007;35:984-93.
[12] Erdogdu E. A snapshot of geothermal energy potential and utilization in Turkey.
Renewable and Sustainable Energy Reviews. 2009;13:2535-43.
[13] Erdogdu E. Nuclear power in open energy markets: A case study of Turkey. Energy