Munich Personal RePEc Archive
Panel Unit Root Test with Nonlinear
Mean Reversion and Smooth Breaks
Lau, Chi Keung Marco and Chau, Frankie and Deesomsak,
Rataporn
Northumbria University, Durham University, Durham University
23 March 2011
Online at
https://mpra.ub.uni-muenchen.de/53602/
A Panel Unit Root Test with Nonlinear Mean Reversion and Smooth Breaks
Marco C.K. Lau1*, Frankie Chau2, and Rataporn Deesomsak2
1
Newcastle Business School, Northumbria University, Newcastle Upon Tyne, NE1 8ST, United Kingdom
2
Durham Business School, Durham University, Green Lane, Durham DH1 3LA, United Kingdom
Abstract. This paper extends the unit root test of Christopoulos and Leòn-Ledesma (2010) to accommodate not only structural breaks and non-linear mean reversion, but also the contemporaneous cross-sectional dependence commonly found in panel dataset. The proposed test presents good finite sample properties and its applications on four major ASEAN countries’ real exchange rates show that the unit root hypothesis could be rejected, supporting their long-run Purchasing Power Parity (PPP) against the Chinese Yuan.
Keywords: ASEAN countries, PPP, Panel ESTAR, Nonlinear adjustment, Contemporaneous dependence
1. Introduction
Over the last few decades, there has been a vast amount of academic research on the Purchasing Power Parity (PPP) hypothesis. Using the standard Augmented Dicker-Fuller (ADF) tests, most early work failed to reject the unit root hypothesis for U.S. dollar real exchange rate (RER), implying the absence of PPP (Rogoff, 1996). However, given its low statistical power, recent research casts doubts about the validity of these conventional ADF tests and starts to employ more powerful tests to provide further evidence on the unit root in RERs (Kanas and Genius, 2005; Sollis, 2009). For instance, motivated by the findings that RER movement exhibits significant non-linearity (Taylor et al., 2001), structural breaks (Bai and Perron, 2003), and contemporaneous correlations (Breuer et al., 2001), several authors attempt to develop new (unit root) testing techniques that can incorporate the potential impact of these common characteristics when testing for the stationarity of RER series (Zivot and Andrews, 1992; Kapetanios et al., 2003; Ucar and Omay, 2009).
However, much of this research addresses the issues separately, and overlooks the potential ‘composite’
effect of these phenomena. A notable exception is the recent work of Christopoulos and Leòn-Ledesma
(2010; hereafter CLL) which develops a relatively more flexible unit root test that accounts jointly for the
non-linear adjustments and structural breaks. Nonetheless, their paper suffers a major shortcoming that the test itself is still relying on the strong assumption of cross-sectional independence and, thus, may lead to a
misleading conclusion regarding the stationarity of RERs under examination.1
It is, therefore, necessary and important to design a unit root test which is able to simultaneously capture
(i) non-linear mean reversion, (ii) contemporaneous correlations, and (iii) the existence of temporary smooth structural breaks in the RERs. Accurately modelling and testing the dynamics of RERs always have important implications for exchange rate risk management and regulations. However, to our knowledge, to
date there exists no research aiming at addressing the above issues concurrently when testing for unit root.
Against this backdrop, this paper complements the work of CLL by developing a unit root test that can simultaneously account for phenomena (i)-(iii). The finite sample performance of our new panel data unit root test is confirmed by the Monte Carlo simulation results. Empirical applications of the test on four major ASEAN countries’ RERs successfully reject the null hypothesis of a unit root, giving support to the relative PPP (against the Chinese Yuan) hypothesis for China's four important trading partners in the ASEAN.
* Correspondence author: Marco Lau Chi Keung Email: [email protected] 1
2. Unit Root Tests
2.1. Nonlinear Unit Root Test with Smooth Breaks
CLL (2010) proposes a new unit root test with smooth breaks to allow the possibility that mean of RER
may change in a smoother manner and that the mean change may take longer time to reach a new level.2
They consider the following model for a stochastic variable
y
t:1
where
t~
N
(0, )
and
( )
t
is a time-varying deterministic component. As in Enders and Lee (2004), theunknown number of smooth breaks of unknown form
( )
t
is approximated by a Fourier series expansion as:sin 2 cos 2 2
where t is a time trend, k is the number of frequencies of the Fourier function, T is the sample size, and =
3.1416. If the null hypothesis of no structural break, i.e.,
k
0
fork
1, 2...,
G
, is rejected, theny
tcontainsat least one break and Eq. (1) should be modeled as a non-linear function. CLL (2010) employs a single frequency to approximate the Fourier expansion and rewrites Eq. (2) as:
sin 2 cos 2 3 Substituting Eq. (3) into Eq. (1) gives:
sin 2 cos 2 4
Thus, a formal test for unit root with the unknown number of smooth breaks in the data generation process
(DGP) of
y
tcan be carried out by testing (a) the null hypothesis of unit root:H
0:
t
t where
t
t1
h
t,against its alternative
H
1:
t
t where
t is an stationary AR(1) process
t
t1
h
t, with
0
; or (b)null hypothesis of no unknown break:
H
0:
1
2
0
against its alternativeH
1:
1
2
0
. The estimatedF-statistic,F k( ) , can then be compared to the critical values of Becker et al. (2006) to test this null.
The test proposed by CLL (2010) is restricted to the cases where there is no cross-sectional dependence. In this paper we modify their test so that it can be implemented in a panel setting and allows for the possibility of contemporaneous cross-sectional dependence. As in CLL (2010), we follow a three step procedure to calculate the test statistic:
Step 1: To identify the optimal frequency k*. The optimal frequency k* was selected by OLS estimation
of the non-linear deterministic component in Eq. (4). For values of k between 1 and 6 we select the one
that minimizes the residual sum of squares (RSS), such that RSS* = ∑ , where is the OLS
residual obtained from equation (4) using the optimal frequency k*.
sin 2 ∗ cos 2 ∗
Step 2: To test for a unit root on the OLS residuals, v , obtained from step 1. The model we are proposing
can control for not only non-linearity and smooth breaks as in CLL (2010), but also contemporaneous cross-sectional dependence in panel data:
∆ , , ∆ , , ,⋯ ; , ,⋯ 5
where υ is the de-meaned series of v, ; v is the sample mean of v, ; μ, is a white noise error. α, , λ, ,
, and c are estimated coefficients. N denotes the number of panel members, and T is the sample period.
Step 3: If the null of unit root is rejected in step 2, we proceed to test the null hypothesis of no unknown
breaks
H
0:
1
2
0
against its alternativeH
1:
1
2
0
using a F-statistic, F k( ) . If the nullhypothesis is rejected, it can be concluded that the series,
y
t, is stationary with unknown smooth breaks.
2
It is assumed that the adjustment in variable,
y
t , follow a non-linear Exponential Smooth TransitionAutoregressive (ESTAR) process to allow for the effects of transaction cost in the arbitrage activities.3
2.2. Nonlinear Panel Unit Root Test with Smooth Breaks
Cerrato et al. (2009) and Ucar and Omay (2009) develops a non-linear panel ADF test based on the ESTAR specification in Eq. (5). To test the null unit root hypothesis we follow their approach and use the following t-statistic:
, , .
where
. is the t-statistic for the null hypothesis of a unit root
H
0:
i
0
againstH
1:
i
0
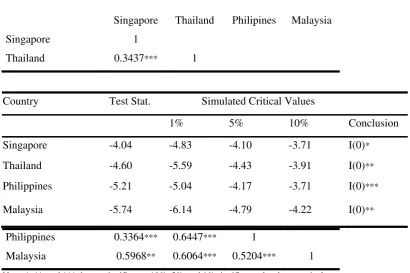
.Breuer et al. (2001) uses seemingly unrelated regressions (SUR) estimation method to allow for the contemporaneous cross-sectional correlations. Lau (2009) provides an alternative test which is arguably more powerful. Following Breuer et al. (2001) and Lau (2009), we propose a unit root test that controls for the potential contemporaneous cross-sectional correlations across panel members. In our empirical application we use the monthly (end-of-period) data on one-month inter-bank interest rates, nominal bilateral exchange rates and consumer price indices from February 1997 to August 2009 for Singapore, Thailand, Philippines, and Malaysia with Chinese Yuan (RMB) as the numeraire. The data are obtained from the China Information Bank and IMF’s International Financial Statistics (IFS) database. The correlation coefficients reported in Table 1 indicate a strong correlation among the ASEAN members’ currencies, supporting the use of SUR estimation method in this paper.
<<Insert Table 1 about here>>
The main variable of interest is the relative PPP differential for country i at time t: ∗ 6
where
y
tis the logarithm of the RER against the Chinese Yuan,e
tis the logarithm of the nominal exchangerate against the Chinese Yuan, and
p
tandp
t* are, respectively, logarithms of consumer price indices inChina and country i. The critical values come from 5000 stochastic simulations constructed at 1%, 5%, and 10% significance levels, which are simulated using the error covariance matrix, with the coefficients of the
lagged difference estimated based on a (1) environment (the unit root null hypothesis under the ESTAR
model in Eq. (5)) assuming no drift unit root process. That is,
Δ , Δ , , ,⋯ ; , ,⋯ 7
SUR method is used to estimate Eq. (7) and the estimated vector of null parameters (
ˆ
H hist0,i
; 0,,
ˆ
H hist i t
)are gathered. The variance-covariance matrix,
ˆ
H hist0,i
of 0,,
ˆ
i tH hist
was constructed. A vector of uncorrelatedartificial error terms with dimension N x T, 0,
,
ˆ
i tH ran
are drawn randomly such that 0,,
ˆ
i tH ran
~ N(0,1). TheCholesky decomposition of
ˆ
H hist0,i
produces the lower-triangular (square root) matrixL
soLL
'
ˆ
H hist0,i
.Hence, the simulated cross-correlated artificial vector of residuals can be generated as: 0,
,
ˆ
i tH sim
= 0,,
ˆ
i tH ranL
.We also obtain estimates from a system of Fourier equation by SUR such that the simulated series,
y
i t*, , are:, 0.06 1.44 sin 2 ∗
151 0.48 cos 2 ∗
151 ̂ , ,
, 0.38 1.48 sin 2 ∗
151 3.3 cos 2 ∗
151 ̂ , ,
, 0.36 2.7 sin 2 ∗
151 4.5 cos 2 ∗
151 ̂ , ,
3
, 1.34 3.18 sin 2 ∗
151 1.34 cos 2 ∗
151 ̂ , , 8
The critical values can be obtained by carrying out steps 1 to 2 as suggested in the previous section. With
5000 bootstrap artificial series, we can obtain the bootstrap t-statistic on
i t, after estimating the auxiliaryregression of the following form:
Δ , , ∆ , , ,⋯ , ,⋯ 9
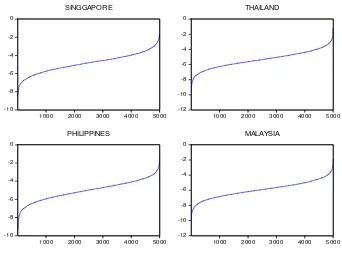
Finally, we are able to tabulate critical values at 1%, 5%, and 10% significance levels for the above series-specific nonlinear panel unit root test with smooth breaks via bootstrapping simulations under the null of a random walk for the optimal frequency obtained in step 1 for each ASEAN country. The critical values obtained from 5000 replications are reported in Table 2, and the t-statistic estimated under the null hypothesis of a unit root is plotted in Figure 1. As shown in Table 2, the results indicate that relative PPP holds with regard to China.
<<Insert Table 2 about here>> <<Insert Figure 1 about here>>
2.3. Size and Power Properties
In this section the size and power properties of the proposed test are assessed by a simulation
experiment. First, we obtain the estimated vector of true parameters
ˆ
ihist,ˆ
hist,i t
v
, and the truevariance-covariance matrix,
ˆ
histof
ˆ
i thist, after estimating the following system equation with SUR:, , , sin 2 ∗
, cos 2 ∗
, , ,⋯ , ,⋯ 10
A vector of uncorrelated artificial error terms with dimension N x T,
ˆ
i tran, , are drawn randomly such that,
ˆ
ran i t
~ N(0,1). The Cholesky decomposition of the true variance-covariance
ˆ
histmatrix produces thelower-triangular (square root) matrix L so
LL
'
ˆ
hist. Hence, the simulated cross-correlated artificial vector ofresiduals can be generated as:
ˆ
i thist sim, , =L
ˆ
i tran, . Where
ˆ
i thist sim, , is a random sequence of correlated standard normal errors based on the error term structure obtained from the SUR estimation on system Eq. (10). The empirical size and power experiment are based on the following ESTAR specification in a panel setting:∆ , ∗ , 1 , 1 , , , ,⋯ , ,⋯ 11
Following Taylor et al. (2001),
1
and the location parameter is set to 0. The empirical size iscarried out with a nominal size of 5% by setting
i
0
. The power property of the test is investigated bysetting
i
0.05
. Next, the artificial series can be generated as:, 0.06 1.44 sin 2 ∗
151 0.48 cos 2 ∗
151 ,
, 0.38 1.48 sin 2 ∗
151 3.3 cos 2 ∗
151 ,
, 0.36 2.7 sin 2 ∗
151 4.5 cos 2 ∗
151 ,
, 1.34 3.18 sin 2 ∗
151 1.34 cos 2 ∗
151 , 12
and 5% reference level. The simulation results indicate that the empirical size is very close to the nominal level of 5% using the 5% critical value of Table 2. We can conclude that the proposed test present very good size properties that ensure the model is not over-fitting and leading to over-rejections of the unit root null. Further, the power of the proposed model exceeds 75% indicating that the test can detect near unit root series over 75% accuracy rate. The t-statistic estimated under near unit root environment is plotted in Figure 2.
<<Insert Table 3 about here>> <<Insert Figure 2 about here>>
3. Conclusion
The recent literature relating to PPP highlights the lack of power of standard unit root tests which leading to misleading findings with regards to the mean reversion of RERs. In this paper we propose a unit root test for panel data accommodating the potential effects of (i) non-linear mean reversion, (ii) contemporaneous correlations, and (iii) the existence of temporary smooth structural breaks. The test allows for non-linear mean reversion and the presence of multiple smooth breaks via a nonlinear specification of ESTAR and a Fourier function, respectively. More importantly, it controls for the occurrence of common factors across countries (due to financial crises and/or oil shocks) and non-zero off-diagonal elements of the variance-covariance matrix. The contemporaneous correlations are modelled by a system of equations in SUR.
We applied our new test to China’s four major ASEAN trading partners for the period of February 1997 to August 2009 and able to reject the null of a unit root for all countries. The finite sample performance of our test is found to be satisfactory through the Monte Carlo simulation. Thus, it can be concluded that breaks, contemporaneous correlations, and non-linear adjustment are important features in driving the behaviour of these series toward their long-run equilibrium.
References
Bai, J., and Perron, P., 2003, Computation and analysis of multiple structural change models, Journal of Applied Econometrics 18, 1-22.
Becker, R., W. Enders and Lee, J,. 2006, A stationarity test in the presence of unknown number of smooth breaks, Journal of Time Series Analysis 27, 381-409.
Breuer, J.B., McNown, R. and Wallance, M., 2001, Misleading inferences from panel unit-tests with an illustration from purchasing power parity, Review of International Economics, 9 (3), 482-493.
Cerrato, M., 2001, Econometric Approaches to Testing PPP, Mimeo, Department of Economics, London Guildhall University.
Cerrato. M, Peretti. C, Sarantis N., 2009, A Non-linear Panel Unit Root Test under Cross Section Dependence, Working paper, Department of Economics, University of Glasgow.
Cheung Yin Wong, and Kon Lai., 2000, On the Purchasing Power Parity Puzzle. Journal of International Economics, 52(2), 321-330.
Christopoulos, Dimitris K. and León-Ledesma, Miguel A., 2010, Smooth breaks and non-linear mean reversion: Post-Bretton Woods real exchange rates, Journal of International Money and Finance, 29(6), 1076-1093.
Enders, W. and Lee, J., 2004, Testing for a unit root with a nonlinear Fourier function, mimeo, University of Alabama.
Kanas, A., Genius, M., 2005, Regime (non)stationarity in the US/UK real exchange rate, Economic Letters, 87, 407-413.
Kapetanios, G., Shin, Y. & Snell, A. 2003, Testing for a unit root in the nonlinear STAR framework, Journal of Econometrics, 112, 359-379.
Kolb, R.W., 2011, Financial contagion: The virtual threat to the wealth of nations, John Wiley & Sons Inc. Lau, C.K. 2009, A More Powerful Panel Unit Root Test with an Application to PPP, Applied Economics
Letters, 16 (1), 75-80.
Michael, P., Nobay, A.R. and Peel, D.A., 1997, Transaction Costs and Non-linear Adjustment in Real Exchange Rates: An Empirical Investigation, Journal of Political Economy, 105(4), 862-879.
Perron, P. 1989, The Great Crash, Oil Price Shock, and unit root hypothesis, Econometrica, 57, 1361-1401. Rogoff Kenneth 1996, The Purchasing Power Parity Puzzle, Journal of Economic Literature, 34, 647-668. Sollis R. 2009, A simple unit root test against asymmetric STAR nonlinearity with an application to real
Sarno Lucio, Taylor, Mark P. and Chowdhury, Ibrahim, 2004, Nonlinear dynamics in deviations from the law of one price: a broad-based empirical study, Journal of International Money and Finance, 23(1), 1-25. Taylor, M.P., Peel, D.A. and Sarno, L., 2001, Nonlinear mean-Reversion in real exchange rates: Toward a
solution to the Purchasing Power Parity puzzles, International Economics Review , 42(4), 1015 -1042. Ucar, Nuri and Omay, Tolga, 2009, Testing for unit root in nonlinear heterogeneous panels, Economics
Letters, 104(1), 5-8.
Zivot, E. and Andrews, D.W.K. 1992, Further Evidence on the Great Crash, the Oil Price Shock, and the
[image:7.595.54.465.191.464.2]Unit Root Hypothesis, Journal of Business and Economic Statistics, 10(3), 251-270.
Table 1: Correlation coefficient for PPP differential
Singapore
Singapore
1
Thailand Philipines Malaysia
Thailand 0.3437*** 1
Philippines 0.3364*** 0.6447*** 1
Malaysia 0.5968** 0.6064*** 0.5204*** 1
Note: *, **, and *** denote significance 10%, 5%, and 1% significance level, respectively.
Table 2: Null critical values for non-linear panel unit root test with smooth breaks
Note: *, **, and *** denote significance 10%, 5%, and 1% significance level, respectively.
Table 3: Sizes and Powers of non-linear panel unit root test with smooth breaks
Country Size Power
Country Test Stat. Simulated Critical Values
1% 5% 10% Conclusion
Singapore -4.04 -4.83 -4.10 -3.71 I(0)*
Thailand -4.60 -5.59 -4.43 -3.91 I(0)**
Philippines -5.21 -5.04 -4.17 -3.71 I(0)***
Singapore 0.044 0.75
Thailand 0.056 0.78
Philippines 0.057 0.75
Malaysia 0.039 0.83
Figure 1: T-statistic under the null of a unit root (5000 replications)
Figure 2: T-statistic under the near a unit root environment (5000 replications) -8 -6 -4 -2 0 2 4
1000 2000 3000 4000 5000
SINGGAPORE -12 -8 -4 0 4
1000 2000 3000 4000 5000
THAILAND -8 -6 -4 -2 0 2 4
1000 2000 3000 4000 5000
PHILIPPINES -12 -8 -4 0 4
1000 2000 3000 4000 5000
MALAYSIA -10 -8 -6 -4 -2 0
1000 2000 3000 4000 5000
SINGGAPORE -12 -10 -8 -6 -4 -2 0
1000 2000 3000 4000 5000
THAILAND -10 -8 -6 -4 -2 0
1000 2000 3000 4000 5000
PHILIPPINES -12 -10 -8 -6 -4 -2 0
1000 2000 3000 4000 5000
[image:9.595.73.415.375.629.2]