Munich Personal RePEc Archive
Data report on work attitudes
-Background paper
Lisi, Gaetano and Ruiu, Gabriele and Lucidi, Federico
21 March 2012
Online at
https://mpra.ub.uni-muenchen.de/62316/
This
reflec
Dat
paper has
cts the auth
Wyattville Road e
ta rep
Eu
not underg
hors’ opinio
d, Loughlinstown mail: postmaster
port o
urofound
gone the sta
ons but not
n, Dublin 18, Irela [email protected]
on wo
d working
andard edito
necessarily
and. - Tel: (+353 ropa.eu - website
rk att
g paper
orial treatm
y those of E
1) 204 31 00 - F e: www.eurofoun
titude
ment by Eur
Eurofound.
Fax: 282 42 09 / nd.europa.eu
es
rofound. It
Contents
1. Introduction ... 4
2. Macroeconomic background ... 5
2.1. GDP per capita ... 6
2.2. Employment ... 8
2.3. Unemployment ... 11
2.4. Shadow economy ... 13
2.5. Labour force per level of education ... 15
2.6. Labour productivity, unit labour cost and labour income share ... 16
2.7. Working Hours ... 20
2.8. Appendix. Recent trend of the main macroeconomic variables ... 21
3. Data sources on work attitudes ... 22
4. Aspects of work attitudes: an overview ... 23
4.1 Work-life preferences ... 23
4.2. Preferences over job characteristics ... 28
4.3. Work ethic ... 31
4.4. Job and Life satisfaction ... 34
4.5. Attitude toward female work ... 36
4.6. Entrepreneurship ... 39
5. Concluding remarks ... 43
Data sources ... 45
Appendix 1. List of work attitudes variables ... 46
Appendix 2. Data summary ... 48
1. Introduction
Attitudesmay be defined as propensities, or tendencies, to respond in a favorable or unfavorable way toward an object. Attitudes reflect a person’s likes and dislikes toward other persons, events, and activities. It is important to study and know about attitudes (for instance attitudes toward supervision, pay, benefits, promotion, or anything that might generate positive or negative reactions) because strong attitudes will very likely affect how an individual will behave (Harrison, Newman and Roth, 2006). As a result, employee satisfaction and attitudes to work represent one of the key areas for measuring organizational effectiveness.
The concepts of “workers’ performance” and “job satisfaction” have been studied by different lines of inquiry and in different disciplines, i.e. economics and psychology (see the integrated survey of Pugno and De Pedri, 2010). The main issues regard the direction of causality of the relationship between job performance and job satisfaction and also its sign. Connected issues regard the effectiveness of the economic incentives for job performance and job satisfaction with respect to individuals’ characteristics and contextual variables. Furthermore, work attitude affects job satisfaction and job performance; but, at the same time, job satisfaction and job performance affect work attitude. In short, it is important to take into account the wide concept of “work attitude” in measuring both job performance and job satisfaction. Hence, it is worth investigating the causality link between job performance, job satisfaction and work attitude.
The conventional view in economics – which argues that economic incentives raise workers’ job performance by increasing both their effort and utility – should be extended on the basis of the psychological concepts of intrinsic motivations, self-esteem, and life satisfaction (Pugno and De Pedri, 2010). Indeed, also motivations, aspirations, and moral considerations drive individual behaviour. It follows that work attitude may be important to understand the two main economic choices of individuals: work vs. leisure and being an entrepreneur vs. being a wage-earner. Attitudes towards leisure and work, for instance, are likely to be affected by a person’s own labour market experience and by the experience of those around her/him.
Another important link is that between “cultural attitude” and “work attitude”. The evolution over time of the employment rates of women and of the young, and of hours worked in OECD countries is crucially affected by cultural attitudes towards work, gender and the young. More specifically, attitudes towards a woman’s role in the family and towards leisure are statistically and economically important determinants of the employment rate of women and of average hours worked (Giavazzi et al., 2009). Furthermore, education matters in determining work aspirations and life satisfaction (Ferrante, 2009).
Finally, Bartel et al. (2004) show the importance of the on-the-job interpersonal environment for work performance. They consider the role of work attitude in the performance of branches of the same firm, rather than individual workers’ performances. They first define attitude as the composite index of employees’ judgments on supervisors, team cooperation, transparency in employees’ evaluations and distributive fairness. They then observe that the heterogeneity of attitudes within branches is smaller than the heterogeneity across them, which demonstrates employees’ conformism, or something called the ‘branch’s attitude’. The economic performance of the various branches in terms of sales, turnovers, and closures proves to be correlated with the ‘branch’s attitude’.
Hence the concept of “work attitude” is fundamental to answer to questions as why people have jobs, what kind of jobs they choose, how much effort they put in work, what they want from jobs, how they experience work, how they are happy about one's job, how motivations are changing and so on. In this work we aim at investigating this concept in a multi-dimensional fashion, collecting available information on a number of qualitative and quantitative dimensions. In particular, this report will investigate in detail the following main aspects of work attitudes:
Work ethics
Attitude toward female work
Individual preferences over job characteristics
Job and Life satisfaction
Attitude toward entrepreneurship.
A total of 32 countries are covered by the study: EU-27 countries (without Luxembourg and Malta, plus Switzerland and Norway) and some Extra-European countries (Canada, China, India, Japan, U.S.A.). Unfortunately, due to data availability, different dimensions of work attitudes could only be analysed by subsets of countries. In order to enhance data comparability, 2007 has been chosen as reference year in most cases, as in that year we observe the maximum data availability.
The nature of this report is descriptive, as it shows available evidence along the different dimensions of work attitudes without seeking relationships among variables nor causal links. In particular, no attempt will be made to link work attitudes indicators to outcome indicators (such as wages, productivity, GDP per capita, and so on), as this exercise would require a complete econometric model, which falls outside the scope of this study. Rather, the information included in the report will provide a detailed cross-country overview of the main dimensions of work attitudes, which could serve as inspiration for future research in the field.
Another important remark concerns the interpretation of results. Dealing with surveys on cultural values, one should carefully look at country rankings, as underlying cultural, social and economic factors might cause selected indicators to point at other issues than the related dimensions of work attitudes. For instance, preferences between family and work in a country could be influenced by macroeconomic conditions (e.g., the incidence of unemployment), by the quality of available services (e.g. childcare and healthcare) and by underlying cultural attitudes which could have little to do with work attitudes. Accordingly we suggest to consider country rankings with caution and taking into account the possible influence of exogenous variables.
This report is structured as follows. Section 2 presents the macroeconomic background of the countries included in the study. Section 3 presents the main data sources on work attitudes that have been used throughout the study. Section 4 shows an overview of the main descriptive results on work attitudes, as concerns the areas of work-life preferences, work ethic, preferences over job characteristics, job and life satisfaction, attitude toward female work and attitude to entrepreneurship. A final sections draws some conclusions.
2. Macroeconomic background
In this section we provide a synthetic overview of the main structural features of the economies that will be analysed throughout the report. The selected data are provided by harmonized sources, such as OECD, World Bank, ILO and the World Penn Table, in order to avoid incomparability problems with extra-EU countries. However, this choice implies that some missing values could emerge for specific variables, mostly in more recent years.
With the aim to describe the structural characteristics of the economies in real terms, we will take into account the following variables:
GDP per capita (constant price, US$ in purchasing power parity)
Employment to population ratio (analysed for total, male and female population)
Employment by sector (agriculture, industry and services)
Unemployment rate (total economy, male and female)
Unemployment rate by level of education (primary, secondary and tertiary education)
Long-term unemployment rate1 (total economy, male and female)
Youth unemployment (% of total labour force ages 15-24)
Labour force by level of education (primary, secondary and tertiary education)
Incidence of the shadow economy
Unit Labour Cost
Labour Income share (defined as the ratio of total labour cost to nominal output)
Labour Productivity levels and growth (in purchasing power parity)
Weekly working hours.
For sake of clarity we divide all countries into 6 macro-areas, which closely resemble the taxonomy of welfare regimes proposed by Esping Andersen (1990):
Northern countries (Finland, Sweden, Norway, Denmark)
Continental countries (Austria, Belgium, France, Germany, Netherlands, Switzerland)
Anglo-Saxon countries (Ireland, United Kingdom)
Eastern countries (Czech Republic, Hungary, Latvia, Poland, Romania, Slovenia)
Southern countries (Greece, Italy, Portugal, Spain)
Non-European countries (Canada, China, India, Japan, USA)
In the following paragraphs we will present, for each variable, a summary figure and a brief comment.
2.1. GDP per capita
Referring to the pre-crisis period (2007), Figure 2.1 shows that – not surprisingly – Northern, Continental, Anglo-Saxon and some Extra-European countries (Canada, Japan and USA) present higher values of GDP per capita than other macro-areas. GDP per capita is expressed in US dollars at 2005 prices, in purchasing power parity (thanks to Penn World Table data). In particular, Norway and the USA present the highest levels of GDP per capita (respectively US$ 57,000 and US$ 46,000), while Sweden, Austria, Netherlands, Switzerland, Ireland and Canada all show a GDP per capita at around US$ 40,000. Among large industrialised economies, lower values can be observed in France and Germany (around US$ 35,000), and Italy (around US$ 32,000). At intermediate levels (with an average of about US$ 29,000) we find Southern countries. Significantly lower (about US$ 19,000) appears the average GDP per capita in Eastern European countries.
1
China and India represent a singular case, with respectively US$ 6,996 and US$ 3,207 levels of GDP per capita. However, at the same time, these countries – as well as Poland – are the only ones showing a positive trend both in 2007-2008 and 2008-2009 period. On the contrary, all other countries show (at least in one of these periods) a negative trend, because of the recent world crisis.
Figure 2.1. GDP per capita in 2007 (US dollars at 2005 prices in PPP)
Source: Penn World Table
0 10000 20000 30000 40000 50000 60000 Denmark Finlan
d No rw a y Sw e d e n Au st ri a B e lg iu m Fr an ce Ge rman y Net h e rl a n d s Swi tzer lan d Ir el a n d UK Cze ch R e pu blic Hun g a ry La tv ia Po la n d Ro m ania Sl o v eni a Gr e e ce It a ly Po rt uga l Sp ai n Cana da Ch ina In di a Jap an USA
Nordic European countries
Continental countries Anglo‐ Saxon countries
Eastern European countries Souther European countries
2.2. Employment
Employment rates (here computed as the ratio of employment to 15+ population) follow a peculiar distribution across macro-areas. Not surprisingly, the highest employment rates in Europe are recorded in Scandinavian countries (with an average of 58.7%), followed by Anglo-Saxon countries (57.4%) and Continental countries (53.3%) which, however, show a large variability (their values range from 46.2% of Belgium to 58.9% of the Netherlands, and 61.4% of Switzerland). This ranking is followed by Eastern European countries, which show an average value of 50.4% (though with peaks at 54% in Czech Republic and Slovenia) and by Southern countries, whose average stands at 49.4% (Italy, in particular, exhibits the lowest value, 43.4%). Among Extra-European countries, the highest employment rate is observed in China (71.5%), followed by Canada and USA (around 60%), Japan and India (around 55%). Nonetheless, the low value recorded in India stems from a strong employment gender gap.
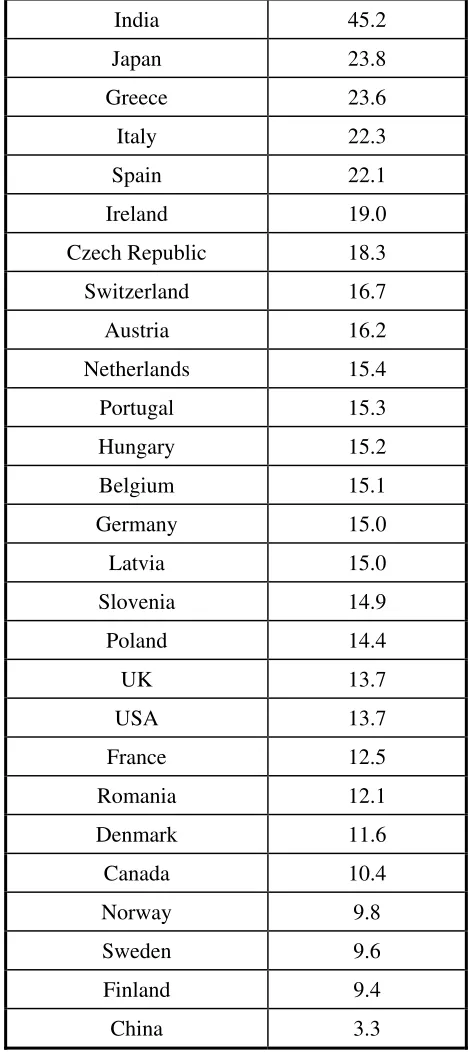
[image:9.612.94.513.407.642.2]In fact, when looking separately at male and female employment rates, India exhibits the highest value of male employment (77.5%) but, at the same time, the lowest employment rate among women (32.5%). The emergence of a gender employment gap is a common feature across all considered countries (see Table 1.1): it is maximum in India (45.2 percentage points), followed by Japan, Greece, Italy and Spain (where it ranges between 22 and 23 percentage points). Accordingly, low average employment rates for females appear a common characteristic of Southern European countries. At the bottom of this ranking, with gender employment gaps lower than 10 percentage points, are placed Northern countries as Norway, Sweden and Finland (around 9 percentage points) and China (whose employment gender gap stands at 3.3 percentage points).
Figure 2.2. Employment rate in 2007 (total economy, male and female)
Source: World Bank
0 10 20 30 40 50 60 70 80 90 Fi nl a n d Swed e n No rw a y De n m a rk Au str ia B e lg iu m Fr an ce Ge rmany Net h erl a nds Switzer lan d Ir elan d UK Czec h Re pu bl ic H ung ar y La tvi a Poland Ro m a ni a Slov en ia Gr e e ce It aly Port ug al Sp ain C anada Chin
a Indi a Ja p a n USA
Nordic Countries Continental Countries Anglo‐ Saxon Countries
Eastern Countries Southern Countries Extra‐European Countries
Employment to population ratio (% of total population)
Table 2.1 – Employment gender gap
This table ranks countries according to the difference between male and female employment rates in 2007
India 45.2 Japan 23.8 Greece 23.6
Italy 22.3 Spain 22.1 Ireland 19.0
Czech Republic 18.3
Switzerland 16.7 Austria 16.2 Netherlands 15.4
Portugal 15.3 Hungary 15.2 Belgium 15.1 Germany 15.0 Latvia 15.0 Slovenia 14.9
Poland 14.4 UK 13.7 USA 13.7 France 12.5 Romania 12.1 Denmark 11.6 Canada 10.4 Norway 9.8 Sweden 9.6 Finland 9.4 China 3.3
Source: World Bank
of employment in services is much higher than in the other sectors (please notice that sectoral data are not available for China and India).
In particular, for Nordic, Anglo-Saxon, Continental and Extra-European countries (Canada, Japan and USA) employment in services stands, on average, at 70% of total employment (peaking at almost 80% in the USA, UK and Canada). This value drops at an average 60% for Southern and Eastern European countries, with the exception of Romania (where it stands at 40%). In these countries manufacturing still employs a large share of workers, reaching 40% in Czech Republic and standing at 30%, on average, in the others. It should be noted that also Germany exhibits a large share of employment in manufacturing (almost 30%).
[image:11.612.97.513.302.537.2]Finally, it appears interesting to observe that in some countries employment in agriculture still surpasses 10% of total employment (thus showing a significant reallocation potential towards more productive sectors). These countries are Latvia, Poland, Romania, Slovenia, Greece and Portugal. In particular, employment in the primary sector is still largely diffused in Romania, where it reaches 29.5%.
Figure 2.3. Employment by sector (agriculture, industry and services) in 2007
Source: World Bank
0 10 20 30 40 50 60 70 80 Fin lan d Sw eden No rw ay Den m a rk Aus tria Be lg iu m Fr an ce Ge rm a n y Net h erl a nds Switz e rl an d Ir e la n d UK Czech R e publ ic H ung ary La tv ia Polan d Ro man ia Slov e n ia Gr e e ce It aly Po rt ug a l Sp ai n C a na da Ja p a n USANordic Countries Continental Countries Anglo‐Saxon Countries
Eastern Countries Southern Countries Extra‐European Countries
2.3. Unemployment
According to the World Bank definition used throughout this paragraph, unemploymentrefers to the share of the labor force that is without work but available for and seeking employment. Looking at Figure 2.4, the situation in terms of total unemployment rate – in 2007, thus before the business crisis – was different even within the same macro-area (data for China and India are not available). In particular, countries showing a low overall unemployment rate were Norway (the only one exhibiting a value below 3%), Netherlands (3.6%), Switzerland (3.6%), Denmark (3.8%) and Japan (3.9%). On the contrary, unemployment rate was more evident in countries such as Poland (9.6%), Germany (8.6%), Greece (8.3%) and Portugal (8.0%).
Different trends can be observed if we focus on unemployment rate by gender. In extra-European (Canada, Japan and USA) and Anglo-Saxon countries, as well as in Latvia and Romania, male unemployment rate is generally larger than female one. Interesting is the case of United Kingdom, where the male unemployment rate is nearly 10 percentage points, the highest value among the selected countries.
An opposite situation is evident in Northern, Continental and Southern countries, where the female unemployment rate generally exceeds the male one. Large unemployment gender gaps were evident in Greece (7.5 percentage points), Spain (4.5 percentage points), Portugal and Italy (3 percentage points).
Analyzing the trend of more recent years (2007-2008), a good performance in terms of unemployment was recorded by some countries, such as Poland (where the total unemployment rate decreased from 9.6% to 7.1%), Germany (from 8.6% to 7.5%) and Netherlands (from 3.6% to 2.8%). On the contrary, the effects of the first phase of the crisis were more evident especially in Spain (where total employment rate increased from 8.3% to 11.3%), Ireland (from 4.6% to 6.0%) and the USA (from 4.6% to 5.8%).
It also seems interesting to observe to what extent unemployment represents a structural problem, namely looking not only at its incidence on the labour force, but also at its duration. To this purpose, we consider the share of long-term unemployment, that is, the number of people with continuous periods of unemployment extending for a year or longer. Figure 2.5 shows that the highest share of long-term unemployed can be observed in Eastern and Southern countries (except Spain), as well as in two continental countries as Belgium and Germany. In all these countries the share of long-term unemployed stands at around 50% of total unemployment. At the opposite of the scale we find countries such as Sweden, Norway, Canada and USA (showing an average long-term unemployment share of 10%), followed by Denmark (18.2%), Finland (23%), UK (24.5%), Austria (26.8%) and Spain (27.6%).
Figure 2.4. Unemployment rate in 2007 (total economy, male and female)
Source: World Bank
Figure 2.5. Long-term unemployment in 2007 (total economy, male and female)
Source: World Bank
0 2 4 6 8 10 12 14 Finl and Sw eden No rw a y D e nm ar k Aus tr ia Bel g iu m Fr a n ce G e rma n y Ne th e rlan d s Sw it ze rl and Ir e lan d UK Cze ch Rep u b lic Hu ng a ry La tv ia Pol a n d R o m a ni a Sl o v en ia Greece Ital
y Po rt u g a l Sp a in Canad a Ja pan USA
Nordic Countries Continental Countries Anglo‐Saxon Countries
Eastern Countries Southern Countries Extra‐European Countries
Total unemployment (% of total labour force) Female unemployment (% of female labour force) Male unemployment (% of male labour force)
0 10 20 30 40 50 60 Fi n land Sw eden No rw ay Denm ar k Aus tr ia B e lg ium Fr a n ce Ge rm any N e th er land s Sw it ze rl and Ir e lan d UK Cze ch R e pu bl ic Hu ng a ry Pol a n d R o m a ni a Sl ov e n ia G reec e It a ly Po rt ug a l Spai n Ca n a d a Ja pan USA
Nordic Countries Continental Countries Anglo‐Saxon Countries
Eastern Countries Southern Countries Extra‐European Countries
[image:13.612.104.506.416.637.2]Finally, we consider the incidence of unemployment among young people. Youth unemployment has become a serious problem in several European countries, pointing at difficult transitions from education to employment and, more in general, at a difficult job insertion for young people. Figure 2.6 shows youth unemployment as a percentage of total labour force aged 15-24, in 2007. This picture does not evidence any common recognizable pattern in our macro-areas, except for a significant incidence of youth unemployment in all Southern European countries (with an average of 19.5%). Going into detail, countries showing the highest levels of youth unemployment are Greece (23.0%), Poland (21.7%), Italy (20.3%) and Romania (20.1%). On the contrary, the lowest rates are recorded in Switzerland (7.1%), the Netherlands (7.3%), Norway (7.5%) and Japan (7.7%).
Figure 2.6. Youth Unemployment rate in 2007 (% of total labor force ages 15-24)
Source: World Bank
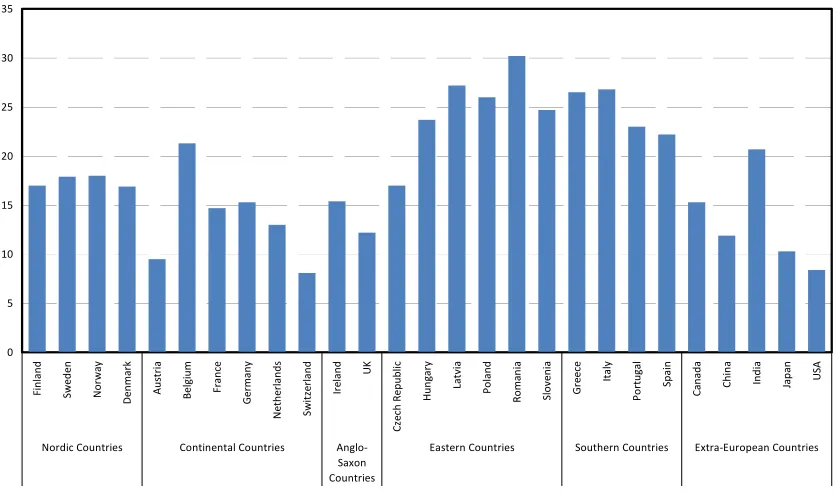
2.4. Shadow economy
Figure 2.7 shows the incidence of the shadow economy on GDP in 2007 according to the estimates of Schneider et al. (2010). These authors use the following definition of shadow economy: “all market-based legal production of goods and services that are deliberately concealed from public authorities for any of the following reasons: (i) to avoid payment of income, value added or other taxes, (ii) to avoid payment of social security contributions, (iii) to avoid having to meet certain legal labour market standards, such as minimum wages, maximum working hours, safety standards, etc., and (iv) to avoid complying with certain administrative procedures, such as completing statistical questionnaires or other administrative forms”. Accordingly, illegal activities are strictly excluded from the estimates.
0 5 10 15 20 25 Fi nl a n d Sw e d e n No rw a y Den m a rk Aus tria B e lg iu m Fr an ce Ge rmany Net h erl a nds Switzer lan d Ir elan d UK Czech Re p u b lic H ung ar y Lat v ia Poland Ro m a ni a Slov en ia Gr e e ce It aly Port ug al Sp ain Can a d a Ja p a n USA
Nordic Countries Continental Countries Anglo‐Saxon Countries
The incidence of the shadow economy is estimated using an econometric methodology named Multiple Indicators Multiple Causes (MIMIC) model, which falls into the category of structural equations models (SEM). Through this model, the shadow economy is treated as an unobserved variable and is analysed with respect to its relationship to observed variables (such as the tax burden, indexes of business and economic freedom, and so on) using their covariance matrix. For more details please refer to Schneider et al. (2010).
According to these estimates (Figure 2.7), the highest incidence of shadow economy on “official” GDP is found in Eastern and Southern European countries, where this share (with the exception of Czech Republic, which shows lower values) ranges from 22.2% of Spain to 30.2% of Romania. Other countries with a high estimated incidence of undeclared economy are Belgium (21.3%) and India (20.7%). On the contrary, the lowest rates are recorded in Switzerland (7.1%), Netherlands (7.3%), Norway (7.5%) and Japan (7.7%).
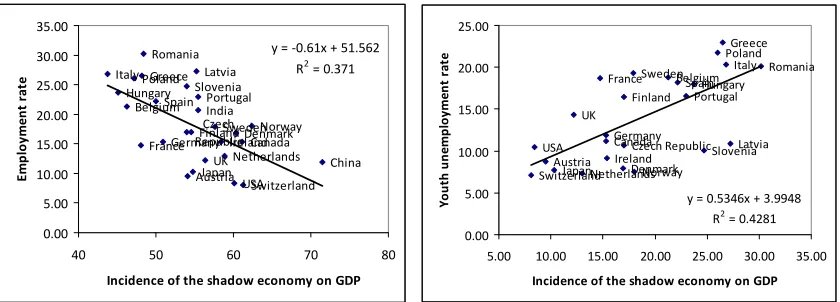
[image:15.612.96.515.356.604.2]Interestingly, the incidence of the shadow economy appears positively correlated with the youth unemployment rate and negatively correlated with the employment rate (Figure 2.8). Undeclared work is surely more diffused where the conditions for regular employment are more difficult. Nonetheless, this evidence also points at a low reliability of official statistics on employment and unemployment (which hardly capture the incidence of undeclared work) in countries with a high share of shadow economy.
Figure 2.7. Size of the Shadow Economy in 2007 (Schneider Estimates)
Source: Schneider et al. 2010
Figure 2.8. Relationship between shadow economy, employment rate and youth
unemployment rate
0 5 10 15 20 25 30 35 Fin la n d Swe d en No rw a y Den m ar k Aus tria Belgiu m Fr anc e Ge rm a n y Ne the rl a nds Sw it ze rl and Ir e la n d UK Cz e ch R e publ ic Hun g ary La tvi a Pola nd Ro man ia Slov en ia Gre e ce Ita ly Portugal Spa
in
Ca
nada Chin
a In d ia Ja p a n US A
Nordic Countries Continental Countries Anglo‐ Saxon Countries
Source: Schneider et al. 2010, World Bank
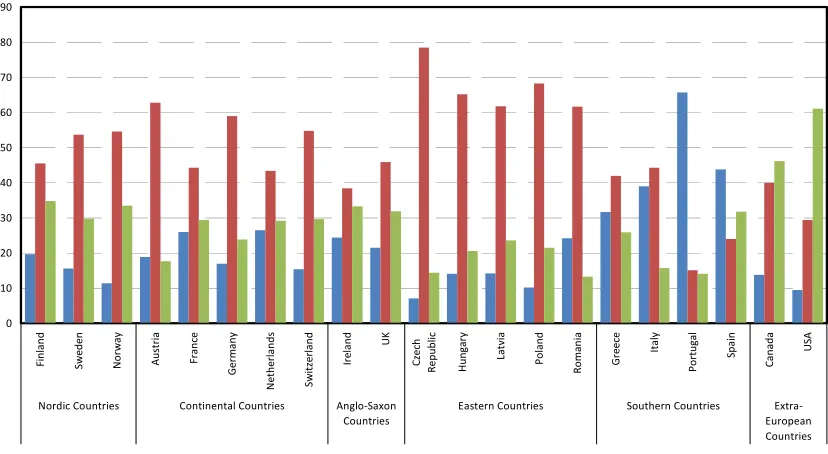
2.5. Labour force per level of education
Among the structural characteristics of the economies which could impact on work attitudes, it seems interesting to look at the educational level of the labour force. Interesting trends could be defined by looking at Figure 2.9. The first trend is related to Southern European countries, where the incidence of primary education over the labour force is still high, compared to other European countries. In particular, in Portugal and Spain this share stands respectively at 65.7% and 43.8%. This feature is mostly due to the low educational level of older people, which still represent a high percentage of the total labour force, while the average educational level of younger workers (as it can be drawn from Eurostat statistics) is generally higher.
The second trend is about the high percentage of labour force with tertiary education in Canada and USA (46.2% and 61.1%), which reflects both the higher wage premium for education envisaged in those countries and the effectiveness of their educational system. A high incidence of university education (over 30%) can be found as well in some European countries such as UK, Ireland, Finland, Sweden, Norway and Spain.
[image:16.612.97.517.72.223.2]Finally, higher levels of secondary education can be found in Eastern European countries, which historically (also in the socialist era) have shown high educational attainment, due to the length of compulsory schooling in the national educational systems.
Figure 2.9. Labour Force per level of education in 2007 (primary, secondary and tertiary
education)
FinlandSwedenDenmarkNorway
Austria Belgium FranceGermany Netherlands Switzerland Ireland UK Czech Republic Hungary Latvia Poland Romania Slovenia Greece Italy Portugal Spain Canada China India Japan USA y = ‐0.61x + 51.562 R2 = 0.371
0.00 5.00 10.00 15.00 20.00 25.00 30.00 35.00
40 50 60 70 80
Incidence of the shadow economy on GDP
E m pl oym e nt ra te Finland Sweden Norway Denmark Austria Belgium France Germany Netherlands Switzerland Ireland UK
Czech Republic Hungary Latvia Poland Romania Slovenia Greece Italy Portugal Spain Canada Japan USA y = 0.5346x + 3.9948 R2 = 0.4281 0.00 5.00 10.00 15.00 20.00 25.00
5.00 10.00 15.00 20.00 25.00 30.00 35.00
Incidence of the shadow economy on GDP
Source: World Bank
Note: Data for the Netherlands refer to 2005.
2.6. Labour productivity, unit labour cost and labour income share
A relevant indicator of technological development is represented by labour productivity. We consider here labour productivity as output per worker, although output per worked hour would be a better measure. Nonetheless, information on working hours is not available for all countries. Data are expressed in purchasing power parity (US dollars at 2005 prices) thanks to the Penn World Table data. It comes out that Norway shows the highest values of output per worker (around US$ 95,000) followed by the USA (US$ 86,000), Belgium (US$ 80,000) and Ireland (US$ 77,000). Most other Nordic and Continental European countries (plus Italy, the UK and Canada) stand in a range between US$ 65,000 and 75,000. Labour productivity in Japan, once measured in purchasing power parity (around US$ 63,000), lags behind other industrialized countries.
[image:17.612.98.512.80.307.2]Lower levels of GDP per worker (less than US$ 40,000) can be found in Eastern European countries and Portugal. China and India close this ranking with GDP per worker at about US$ 11,000 and 8,000.
Figure 2.10. GDP per worker in 2007 (US dollars at 2005 prices in PPP)
010 20 30 40 50 60 70 80 90
Fin
la
n
d
Swe
d
en
No
rw
ay
Aus
tria
Fr
anc
e
Ge
rm
a
n
y
Ne
the
rl
a
nds
Sw
it
ze
rl
and
Ir
e
la
n
d
UK
Czech
R
e
publ
ic
Hunga
ry
La
tvi
a
Pola
nd
Ro
man
ia
Gre
e
ce
It
al
y
Port
ugal Spain
C
a
nada US
A
Nordic Countries Continental Countries Anglo‐Saxon Countries
Eastern Countries Southern Countries Extra‐ European Countries
Source: World Penn Table
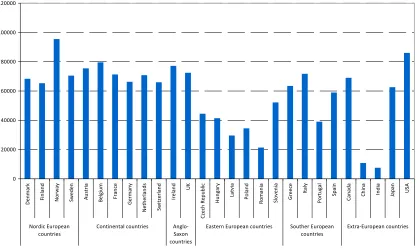
Figure 2.11 shows the average yearly growth rate of labour productivity (output per worker in purchasing power parity) for the period 2002-2007, according to Penn World Tables data. From Figure 2.11 it clearly emerges that catching up countries (Eastern European countries plus China and India) unsurprisingly present quite higher labour productivity growth rates than most other economies. The highest annual growth rates are recorded in China (11.2%) and India (9.8%), followed by Latvia (8.7%) and Romania (8.2%). All other Eastern European countries included in our sample present yearly labour productivity growth rates higher than 4%, with the exception of Hungary.
Among the other countries, those showing the highest productivity growth rates (higher than 2%) over the 2002-2007 period are Finland, Sweden, the UK, Greece, Japan and the USA. On the contrary, the lowest rates (less than 1%) are recorded in Belgium, Germany, Italy and Spain.
Figure 2.11. Yearly growth rate of labour productivity between 2002 and 2007 (US
dollars at 2005 prices in PPP)
0 20000 40000 60000 80000 100000 120000 Den m ar k Fin la n d No rw ay Sw eden Aus tr ia Belgiu m Fr an ce Ge rm a n y Neth e rlan d s Switz e rl a n d Ir e land UK Czec h R e publ ic Hunga ry La tv ia Pola nd Ro man ia Sl ov e n ia Gr eec e It al y Por tug a l Sp a in C a na da Ch in a Indi a Ja p a n USA
Nordic European countries
Continental countries Anglo‐ Saxon countries
Eastern European countries Souther European countries
Source: World Penn Table
[image:19.612.99.518.80.332.2]The ratio of average labour costs per hour to labour productivity (output per hour) offers a measure of unit labour cost, which is an important index of competitiveness. Labour costs per se, in fact, are not a good measure of competitiveness, if they are not linked to a measure of output. Figure 2.11 shows that the unit labour cost index computed by OECD (unfortunately, China, India and Romania are not available in this comparison). The unit labour cost index stands at around 0.70 in most countries (the unweighted average in our sample is 0.67). Nonetheless, some exceptions – in both directions – can be found. Among Eastern European countries, which are usually deemed to present lower labour costs than the rest of Europe, we can find a couple of country exhibiting higher ULC, namely Latvia (0.79) and Slovenia (0.73). On the contrary, Czech Republic and Poland show lower than average ULC values.
Among industrialised countries, it is interesting to observe the relative positioning of Norway (0.60), Germany (0.65), Canada (0.64) and Japan (0.56). They show, in spite of generally higher wage levels, a good competitiveness because of a better performance in terms of labour productivity.
Figure 2.12 is about the incidence of labour income over total income. This variable provides a synthetic representation of the distribution of income between factors of production – capital and labour. The labour income share appears higher in Continental and Southern countries (the average amounts respectively to 0.66 and 0.65), while it is lower, on average, in Eastern countries (0.61). UK and Denmark show the highest values (0.70 and 0.69).
Figure 2.11. Unit Labour Cost in 2007
0.0% 2.0% 4.0% 6.0% 8.0% 10.0% 12.0% Den m ar k Fin la n d No rw ay Sw eden Aus tr ia Belgiu m Fr an ce Ge rm a n y Neth e rlan d s Switz e rl a n d Ir e land UK Czec h R e publ ic Hunga ry La tv ia Pola nd Ro man ia Sl ov e n ia Gr eec e It al y Por tug a l Sp a in C a na da Ch in a Indi a Ja p a n USANordic European countries
Continental countries Anglo‐ Saxon countries
Eastern European countries Souther European countries
Source: OECD
Figure 2.12. Labour income share (Total labour cost / nominal output) in 2007
Source: OECD
0.00 0.10 0.20 0.30 0.40 0.50 0.60 0.70 0.80 0.90 Fi n la n d S w ed en No rw ay Den m a rk Aus tr ia B e lg iu m Fr an ce Ger m a n y Ne th e rl a nd s Ir ela n d UK Cz ec h Repu bl ic Hu ngary La tv ia Po la nd Sl o v e n ia Greece Italy
Po rt uga l Spai n Ca n a da Ja p a n US A
Nordic Countries Continental Countries Anglo‐Saxon Countries
Eastern Countries Southern Countries Extra‐European Countries 0.00 0.10 0.20 0.30 0.40 0.50 0.60 0.70 0.80 Fi n la n d S w ed en No rw ay Den m a rk Au st ri a Belg iu m Fr an ce Ger m a n y Ne th e rl a nd s Sw it ze rl a n d Ir ela n d UK Cz ec h Repu bli c Hu ngary La tv ia Po la nd Sl o v e n ia Gr
eece Ital
y Po rt uga l Spai n Ja p a n US A
Nordic Countries Continental Countries Anglo‐Saxon Countries
2.7. Working Hours
Figure 2.13 shows average weekly working hours according to ILO data (unfortunately, data are not available for Switzerland, India and China). It immediately emerges that Nordic European countries and Continental countries show shorter working hours than other countries, with an average of respectively 37.3 and 37.6 hours per week. Among these countries, Austria shows the highest value (39 hours) and the Netherlands show the lowest (35 hours). Longer working hours emerge in other country groupings, namely Anglo-Saxon countries (42 hours), Eastern European countries (40.7 hours) and Southern European countries (40.5 hours). The most frequent modality is represented by 40 average working hours per week, while higher values can be observed in Ireland (44 hours, the highest value in our sample), Poland and Romania (42 hours) and Greece (43 hours). Among extra-European countries, the highest number of working hours is recorded in Japan (43 hours) followed by the USA (41 hours) and Canada (40 hours).
Figure 2.13. Weekly working hours in 2007
Source: ILO
3032 34 36 38 40 42 44 46
De
nm
a
rk
Fin
lan
d
S
w
ed
en
Nor
w
ay
Aust
ria
Belgiu
m
Fra
n
ce
Ge
rmany
Ne
ther
la
nds
Ir
e
lan
d
UK
Cz
e
ch
R
e
publ
ic
Hu
ngary Latvi
a
Pol
a
nd
Ro
ma
n
ia
Slov
en
ia
Gr
ee
ce
It
aly
Port
ugal Spain
C
a
nada Japa
n
US
A
Nordic European countries Continental countries Anglo‐Saxon countries
Eastern European countries Southern European countries
2.8. Appendix. Recent trend of the main macroeconomic variables
Table 2.2 – Recent trends in macro variables
This table shows recent trends in GDP per capita (US dollars at 2005 prices in PPP), employment and unemployment rates
Countries GDP per capita
Employment rate
Unemployment rate
2007 2008 2009 2007 2008 2007 2008
Nordic Countries
Finland 36713 37650 34768 54.6 54.7 6.8 6.4 Sweden 40195 41310 39298 57.6 57.6 6.1 6.2 Norway 56715 62311 56508 62.4 62.3 2.5 2.6 Denmark 38573 39632 37382 60.3 60.3 3.8 3.3
Continental Countries
Austria 40507 42458 41067 54.1 54.5 4.4 3.8 Belgium 37944 38902 38586 46.2 46.5 7.5 7.0 France 34166 35283 34388 48.1 47.9 7.9 7.4 Germany 35783 37272 36229 50.9 51.7 8.6 7.5 Netherlands 40552 42645 40676 58.9 59.3 3.6 2.8 Switzerland 42418 44360 44380 61.3 61.2 3.6 3.4
Anglo-Saxon Countries
Ireland 40913 39265 35879 58.4 57.8 4.6 6.0
UK 38153 39109 37000 56.4 56.3 5.3 5.6
Eastern European Countries
Czech Rep. 23857 24857 24352 54.0 54.3 5.3 4.4 Hungary 18457 19045 18002 45.1 44.8 7.4 7.8 Latvia 17128 17033 14129 55.2 55.0 6.0 7.5 Poland 16375 17710 18367 47.2 48.2 9.6 7.1 Romania 11117 12493 11706 48.4 48.1 6.4 5.8 Slovenia 28528 30330 28135 54.0 54.1 4.6 4.4
Southern Countries
Greece 29777 30946 30203 48.2 48.4 8.3 7.7 Italy 32098 32272 30898 43.8 43.6 6.1 6.7 Portugal 22161 22686 22340 55.5 55.7 8.0 7.6 Spain 31215 31904 30911 50.0 48.6 8.3 11.3
Table 2.2 (continued) – Recent trends in macro variables
This table shows recent trends in GDP per capita (US dollars at 2005 prices in PPP), employment and unemployment
Countries GDP per capita
Employment rate
Unemployment rate
2007 2008 2009 2007 2008 2007 2008
Extra-European Countries
Canada 40777 42681 40026 61.1 61.2 6.0 6.1
China 6996 8051 8826 71.5 71.0 4.0 4.2
India 3207 3402 3589 55.5 55.6 NA NA
Japan 34367 33975 32852 54.8 54.2 3.9 4.0
USA 46458 47210 45614 60.1 59.2 4.6 5.8
Source: Penn World Tables, OECD
3. Data sources on work attitudes
Three main data sources have been used throughout the study on work attitudes: the World Values Survey (WVS), the European Working Conditions Surveys (EWCS) and the Global Entrepreneurship Monitor (GEM).
The World Values Survey (WVS) is a worldwide investigation of the basic values and beliefs of individuals in a large cross-section of countries. The survey contains information about demographics (sex, age, education, etc.), self-reported economic conditions, political preferences, attitudes, and religion. With some exceptions (for African countries), all samples are probability based and nationally representative of the resident population. In our analysis we will focus on the following 20 countries surveyed in the fifth wave (2005-2008) of the WVS: Bulgaria, Canada, China, Cyprus, Finland, France, Germany, India, Italy, Japan, Netherlands, Norway, Poland, Romania, Slovenia, Spain, Sweden, Switzerland, United Kingdom and U.S.A.
We use the EWCS (fourth wave) to derive an indicator of job satisfaction (only for European countries). The EWCS is conducted every 5 years (since 1990) by Eurofound. The aim is to investigate several aspects of working conditions among European Union countries.Respondents to the survey are selected by multistage random sampling, to be representative of the working age population in the countries covered.
[image:23.612.86.524.120.268.2]In order to ensure cross-country comparability, in most cases categorical or ordinal variables have been treated in order to obtain “scores”, which could be directly used in the analysis. Simple econometric techniques have been applied to this purpose2.
Appendix 1 describes in detail the methodology followed for the transformation of variables, while Appendix 2 presents a comprehensive list of variables.
4. Aspects of work attitudes: an overview
This section presents an overview of the main results about the chosen dimensions of work attitudes, namely work-life preferences, preferences over job characteristics, work ethic, job and life satisfaction, attitude toward female work and entrepreneurship. It seems important to remark that the evidence here presented is purely descriptive, and no attempt has been made to link the indicators of work attitude to performance indicators or other macro-economic variables such as employment, income, education level, and so on. Moreover, as stressed in the introduction, most indicators come from subjective assessments, which are likely to be influenced by social and cultural factors, which have not been controlled for in the study. Accordingly, the idea is to provide a wide description of the main phenomena concerning work attitudes, in order to provide hints and suggestions for future research.
4.1 Work-life preferences
Work-life preference is a broad concept including proper prioritizing between “work” (career and ambition) on one hand and “life” (health, pleasure, leisure, family and spiritual development) on the other. Heller and Ruiz-Quintanilla (1995) find that work centrality in life is higher in countries that have only recently moved away from agriculture and towards industrialization (Japan, China, Slovenia) while more emphasis on hobbies, sport, recreation, and social activity is placed in countries like Britain, Germany, and the Netherlands, which had their industrial revolution some two and a half centuries ago. An intermediate position between these two extremes is that of U.S.A.
Our preliminary findings on work-life preferences are reported in Figure 4.1, which shows the importance respectively attributed to work, family, leisure and friends for all countries in the WVS sample. It should be noted that these variables just measure the “importance” that individuals attribute (in absolute terms) to these aspects in life, without expressing a preference, for instance, between work and leisure or between work and family (this preference will be investigated through supplementary variables). Accordingly, this evidence should be carefully considered. In particular, some countries might show at the same time high (or low) scores on both work and leisure, or both work and family, due to country-specific cultural and socio-economic factors. Table 4.1 shows country profiles according to the importance associated to the life dimensions analysed.
Figure 4.1. Work-life importance
2
Source: own computation on World Value Survey Note: variables are standardized in the (-1, +1) range
Figure 4.1 (continued). Work-life importance
Work importance
‐1.000 ‐0.800 ‐0.600 ‐0.400 ‐0.200 0.000 0.200 0.400 0.600 0.800 1.000 In d ia Fr a n c e It al y Po la n d Sw it ze rl a n d Ro m a n ia No rw a y Sw e d e n C y pr us Sp a in Slo v e n ia Jap a n Ge rm an y Ca n a d a Ch in a B u lg a ria Fin la n d Un it ed Ki n g d o m Net h er la n d s U. S .A
Family importance
[image:25.612.113.502.99.554.2]Source: own computation on World Value Survey Note: variables are standardized in the (-1, +1) range
Friends importance
‐1.000 ‐0.800 ‐0.600 ‐0.400 ‐0.200 0.000 0.200 0.400 0.600 0.800 1.000 Sw e d e n Un it ed Ki n g d o m No rw a y Fin la n d Ca n a d a C y pr us Sw it ze rl a n d U. S .A Net h er la n d s Fr a n c e Ge rm an y Sp a in Slo v e n ia It al y Jap a n B u lg a ria Po la n d In d ia Ch in a Ro m a n ia
Leisure importance
Table 4.1 – A closer look to work-life preferences
Country profiles on the basis of the importance attributed to life dimensions
Country Comment
Bulgaria All the four life dimensions are not considered particularly important. The most
important dimension for this country is family, while the least important is leisure.
Cyprus All the four life dimensions are considered particularly important. The most important
dimension for this country is family, while the least important is social life.
Finland Family and social life are considered particularly important. The most important
dimension is social life while the least important is work.
France Work and social life are considered particularly important. The most important
dimension is work while the least important is family.
Germany Social life is considered particularly important, while the other three dimensions are
not. The least important dimension is family.
Italy Work and Family are particularly important. The least important dimension is social
life.
Netherlands This is the country that places the most importance on leisure time. Family and Work
are not considered particularly important.
Poland Work and Family are particularly important. The least important dimension is social
life.
Romania Work is considered particularly important. This is the country that places the least
importance on social life.
Slovenia Leisure is considered particularly important, while the other three dimensions are not.
The least important dimension is family.
Spain Leisure is considered particularly important, while the other three dimensions not. The
least important dimension is social life.
Sweden All the four life dimensions are considered particularly important. This is the country
that places the highest importance on social life.
UK Family, social life and leisure are considered particularly important. The last important
dimension is work.
Norway All the four life dimensions are considered particularly important. The most important
dimension is leisure.
Switzerland Work, leisure and social life are considered particularly important, while family is the
least important dimension.
Canada Family, leisure and social life are considered particularly important while work is least
important dimension.
China This country places the lowest importance both on leisure time and on family. The
most important dimension is work.
India This is the country that places the highest importance on work. Also family is
particularly important while leisure and social life are not.
Japan Family and leisure are considered particularly important.
USA This is the country that places the most importance on family and the least importance
Table 4.2 – Work vs. family and work vs. leisure trade-off
Country rankings according to the reported desirability of a future emphasis on work rather than on family life and of the agreement with the statement “Work should
always come first, even if it means less spare time”
Rank Country
Desirability to shift emphasis on
work rather than on family life
Country
Work should always come first, even if it
means less spare time
1 Japan 1.000 Romania -1.000
2 Romania 0.560 India -0.846
3 China 0.505 Bulgaria -0.623
4 India 0.354 China -0.437
5 Slovenia 0.312 Germany -0.363
6 Bulgaria 0.275 Poland -0.280
7 Norway 0.217 Cyprus -0.249
8 Germany 0.104 Slovenia 0.005
9 Netherlands 0.002 Italy 0.020
10 Poland -0.061 Spain 0.199
11 U.S.A -0.070 Switzerland 0.252
12 Italy -0.193 Norway 0.306
13 Finland -0.376 Finland 0.733
14 Canada -0.541 Sweden 0.789
15 Spain -0.547 Canada 0.844
16 UK -0.623 U.S.A 0.846
17 Sweden -0.670 Japan 1.000
18 Cyprus -0.720
19 France -1.000
Note: variables are standardized in the (-1, +1) range
More indicative of the preference between work and other dimensions of life are the variables reported in Table 4.2. Table 4.2 inspects at first the desirability of a future reallocation of time on family rather than on work: this represents a more direct measure of the trade-off between work time and family time, because in this case people are asked to confront the time allocated to the two life dimensions. Countries are ranked so that at the top of the ranking the desirability of a greater emphasis on work with respect to family life is highest (Japan), while at the bottom of the ranking it is lowest (France).
closer look to the leisure-work trade-off: in particular, countries are ranked according to the belief that work should come first even if this implies less leisure time (in highly ranked countries this belief is stronger).
A neoclassical microeconomic prediction is that the supply of work increases with income up to a point, and beyond this point a further increase of the income induces people to reduce the amount of working hours that they supply. Not surprisingly, we observe that, on average, countries characterized by lower GDP per capita (with the exception of Germany) are more prone to put work before leisure time. This tendency will be confirmed by the joint analysis with life satisfaction in the following sections.
4.2. Preferences over job characteristics
[image:29.612.89.521.472.602.2]A better understanding of the preferences over job characteristics can help both firms and policy makers to create a working environment that can spur both job satisfaction and job performance. In this section we present some findings on the preferences over job characteristics according to the WVS sample (detailed results on single variables can be found in appendix). Using data from the WVS, we focused on the following job characteristics: income, job security (intended as a low probability of being fired), the quality of social interactions with co-workers – approximated by the importance attributed to the possibility of working with pleasant persons – and the possibility of doing an important job. Table 4.3 summarizes the main findings, while Table 4.4 shows country rankings on the selected variables. In general, it appears that Central-Eastern European countries (Bulgaria, Poland and Romania) and Cyprus tend to consider income and job security as the main determinant of the job choice. Scandinavian countries (plus Netherlands) tend to attribute a great importance to the quality of social interactions with co-workers, while for Mediterranean countries (Italy, Spain and France) plus Germany, Romania, Bulgaria and India job security is very important.
Table 4.3 – Preferences over Job characteristics
Some comments on the preferences over job characteristics
Countries where ‘a good income’ is particularly important for job seekers
Bulgaria, Romania, Cyprus, Poland, India, USA
Countries where ‘working with pleasant people’ is particularly important for job seekers
Sweden, Netherlands, Finland, Japan, Canada
Countries where ‘job security’ is particularly important for job seekers
Bulgaria, Cyprus, France, Germany, Italy, Romania, Slovenia, Spain, India
Countries where ‘having an important job’ is particularly important for job seekers
Table 4.4 – Preferences over job characteristics
Country rankings according to the preference for a good income and working with pleasant people in choosing a job
Rank Country A good
income Country
Working with pleasant
people
1 Romania 1.0000 Sweden 1.0000
2 Bulgaria 0.8503 Japan 0.9081
3 Poland 0.6501 Netherlands 0.6646
4 Cyprus 0.4869 Finland 0.5175
5 U.S.A 0.4820 France 0.3979
6 India 0.3968 Canada 0.3446
7 UK 0.3346 Switzerland 0.2312
8 China 0.3250 Spain 0.2194
9 Spain 0.1478 Norway 0.1052 10 Netherlands 0.0714 Slovenia 0.0923
11 Canada -0.1320 UK 0.0705
12 Italy -0.1925 China -0.0856
13 Germany -0.3088 Cyprus -0.3156
14 France -0.3119 U.S.A -0.3182
15 Slovenia -0.3733 Italy -0.3264
16 Finland -0.5278 Poland -0.4736
17 Japan -0.6928 India -0.5017
18 Norway -0.7682 Germany -0.5704
19 Sweden -0.8787 Bulgaria -0.6589
20 Switzerland -1.0000 Romania -1.0000
Table 4.4 (continued) – Preferences over job characteristics
Country rankings according to the preference for job security and having an important job in choosing a job
Rank Country Job security Country Having an important job
1 Germany 1.0000 Switzerland 1.0000 2 Spain 0.5385 Sweden 0.7905
3 Slovenia 0.4928 Norway 0.7734
4 Cyprus 0.4030 Canada 0.5474
5 India 0.3856 UK 0.2962
6 Italy 0.3750 Netherlands 0.2944
7 France 0.3443 Italy 0.2288
8 Japan 0.2596 U.S.A 0.2220
9 Finland 0.2205 Finland 0.2085
10 Bulgaria 0.1813 Slovenia 0.0593
11 Romania 0.1610 France 0.0220
12 Poland 0.1004 Japan 0.0040
13 China -0.0174 Germany -0.2208
14 Norway -0.1976 Poland -0.2409
15 U.S.A -0.3238 Cyprus -0.3946
16 Canada -0.4811 Spain -0.4557
17 Switzerland -0.5204 China -0.6634 18 UK -0.6571 Bulgaria -0.7668 19 Netherlands -0.7629 Romania -0.8609
20 Sweden -1.0000 India -1.0000
[image:31.612.149.456.115.541.2]4.3. Work ethic
In this section we will use a definition of work ethic derived from Max Weber (1930). Weber explained the origin of the capitalism, among other factors, by the development of a moral system, which he called “the Protestant Ethic”. The notion of the Protestant Ethic is based on two fundamental concepts: the idea of ‘calling’ and the ‘Puritan asceticism’. The notion of calling requires individuals to fulfil their duty in this world and interpret occupational success as a sign of being elected, and the notion of Puritan asceticism adds the positive evaluation of hard work and a negative view of idleness, luxury, and time wasting. The term Protestant ethic is still used to describe a positive attitude to hard work: possibly, unconsciously as a way of indicating an explanation of social approval. People who hold these values believe that economic, social and environmental conditions should not be considered to be causes for social deprivation and poverty. Furnham (1982) has analysed the relationship between the Weberian work ethic and the attitude towards the unemployed finding support to the idea that people who strongly endorse the Protestant work ethic regard unemployed as lazy persons and therefore responsible for their own situation. This belief is reflected in their aversion to the provision of unemployment benefits. We investigate the Weberian work ethic across countries included in the WVS sample using, first of all, an indicator which measures the belief that work is something that people owe society rather than an entitlement (something that the society owes them). Moreover, we use indicators associated to the belief that unemployed persons are lazy, to the belief that it is humiliating to receive money without working, to the belief that hard work in the long run brings success and to the belief that to develop talent one needs a job. Table 4.5 shows country rankings on these variables, while in Table 4.6 we summarize the main results.
Table 4.5 – Work ethics
Country rankings according to the belief that work is a duty toward society, that people who don’t work turn lazy and that it is humiliating to receive money without
having to work for it
Rank Country
Work is a duty toward
society
Country
People who don't work
turn lazy
Country
It is humiliating to receive money without having to work
for it
1 Norway 1.0000 Romania 1.0000 India 1.0000
2 India 0.6554 Slovenia 0.6016 Bulgaria 0.7087
3 Romania 0.6400 India 0.5715 Romania 0.4914
4 Slovenia 0.4476 Poland 0.3554 China 0.3825
5 Cyprus 0.3208 Cyprus 0.3320 Cyprus 0.3490
6 China 0.2918 Bulgaria 0.3249 Italy 0.3196
7 Italy 0.0717 China 0.2917 Poland 0.1909
8 Poland 0.0284 Italy 0.1725 Norway -0.1584
9 Switzerland -0.0927 Japan 0.1542 Japan -0.1604
10 Germany -0.1125 Spain -0.1565 Slovenia -0.2735
11 Spain -0.2831 Finland -0.2594 U.S.A -0.3750
12 Japan -0.3296 U.S.A -0.3208 Switzerland -0.4069
13 Canada -0.5393 Switzerland -0.4554 Canada -0.4268
14 Finland -0.5522 Norway -0.4713 Spain -0.5619
15 Bulgaria -0.6201 Canada -0.5164 Finland -0.5919
16 Sweden -0.9330 Germany -0.5670 Germany -0.5950
17 U.S.A -1.0000 Sweden -1.0000 Sweden -1.0000
Table 4.5 (continued) – Work ethics
Country rankings according to the belief that to fully develop one’s talent one needs to have a job and that hard work brings success.
Rank Country
To fully develop your talents,
you need to have a job
Country Hard work brings success
1 Poland 1.0000 India -1.0000
2 Romania 0.9636 Romania -0.8155
3 Bulgaria 0.8454 China -0.5937
4 Germany 0.4615 Finland -0.5123
5 India 0.4252 U.S.A -0.3967
6 China 0.4037 Canada -0.3085
7 Switzerland 0.3069 Slovenia -0.2357
8 Slovenia 0.1127 Spain -0.1549
9 Cyprus -0.0049 Sweden 0.0504
10 Japan -0.1212 United Kingdom 0.0205
11 Norway -0.1785 Bulgaria 0.1492
12 Italy -0.1976 Germany 0.2238
13 Spain -0.4168 Norway 0.3265
14 Finland -0.5376 Netherlands 0.3502
15 Canada -0.7837 Cyprus 0.3700
16 U.S.A -0.7843 Japan 0.3961
17 Sweden -1.0000 Switzerland 0.5355
18 Italy 0.5635
19 France 0.5740
20 Poland 1.0000
[image:34.612.110.520.117.570.2]Table 4.6 – Work ethics
Summary of the findings on work ethics
Country Comment
Bulgaria Both the belief that hard work brings success and that work is a duty are weak, while the other dimensions are very strong (in a Weberian sense)
Cyprus The belief that hard work brings success is particularly weak. The other dimensions are very strong (in a Weberian sense)
Finland There is a strong belief that hard work brings success while the other dimensions are not particularly strong (in a Weberian sense)
Germany There is a strong belief that to develop talent a job is needed. The other dimensions are not particularly strong (in a Weberian sense)
Italy The belief that hard work brings success is particularly weak. Poland The belief that hard work brings success is the weakest. The other
dimensions are particularly positive (in a Weberian sense) Romania All the five dimensions of work ethic are particularly strong Slovenia All the five dimensions of work ethic are particularly strong
Spain All the five dimensions are not particularly strong
Sweden This is the country with the most benevolent view toward the unemployed persons
Switzerland There is a strong belief that to develop talent a job is needed. The other dimensions are not particularly positive (in a Weberian sense)
Norway There is a strong believe that work is a duty while the other dimensions are not particularly strong (in a Weberian sense)
Canada There is a strong believe that hard work brings success while the other dimensions are not particularly strong (in a Weberian sense)
China All the five dimensions of work ethic are particular strong India All the five dimensions of work ethic are particular strong Japan The belief that hard work brings success is particularly low
USA There is a strong believe that hard work brings success while the other dimensions are not particularly strong (in a Weberian sense)
4.4. Job and Life satisfaction
“very are B Swed The c signif Roma satisfa both h Vario believ an un life sa satisfi to inv and li satisfied” ab Bulgaria, Cyp en, United Ki correlation b ficant (the Pe ania and Bul action, while happiness and
ous explanatio ve that job sat derlying dime atisfaction to j ied in life also vestigate on th
ife satisfaction
bout their wor prus, France, ingdom, Swit etween happ earson’s corr lgaria are th Northern Eu d job satisfact
Figur
ons have been tisfaction and ension of ove job-satisfactio o tend to find he nature of th
n across Euro
rking conditio Finland, Ger tzerland and N piness and jo
relation coeff he countries uropean Coun
tion.
re 4.2. Happ
n suggested fo d life satisfacti erall life satisf on has been p d satisfaction o
his relationshi opean Union c
ons). Due to rmany, Italy, Norway. The ob satisfactio ficient is 0.9 with the low ntries are tho
piness vs. Job
or this relation ion are the sa faction. On th proposed, i.e., on the job. Ho ip, so we limi countries.
data limitatio , Netherlands base year is 2 on is strongly 90, and the l
west level o ose characteri
b satisfactio
nship. On the ame construct he other hand,
, those who h owever, it is n it our analysi
on, the countr s, Poland, Sl
2005. y positive an
evel of signi of both happ zed by the h
on
one hand, so t, with job sat , a causality r have a disposi not the scope
s to give a pic
ries considere lovenia, Spain
nd statisticall ificance 0.01 piness and jo highest level o
ome authors tisfaction bein relation from ition to be
of this work cture of job
4.5. Attitude toward female work
In the economic literature it has been claimed that attitudes towards gender and the young, what is sometimes referred to as a country’s “culture”, are important determinants of the cross-country and time series differences in the employment rates of various demographic groups (see for instance Algan and Cahuc, 2006, Giavazzi et al., 2009, and Fortin, 2005). In this section we will focus on the attitude towards female work.
In Figure 4.3 we plot two indicators of attitude towards female work for all the countries of the WVS sample. The first indicator measures to what extent the population believes that when job are scarce, men have more rights to work than women. The smaller the value assumed by the indicator, the weaker the belief that men have more rights than women. The second indicator measures to what extent the population believes that men are better business executives than women. The higher the value assumed by the indicator, the stronger the belief that men are better business executives than women. Hence countries positioned on the first quadrant of Figure 4.3 are those characterized by a negative attitude towards female work, while countries positioned on the third quadrant of Error! Reference source not found.4.3 are those characterized by a
positive attitude towards female work. Sweden and India are placed at the opposite side, the first being the country with the most positive attitude towards female work while the latter being the country with the most negative attitude toward female works. Among EU countries, Eastern European countries plus Italy and Cyprus are those with the more negative attitude towards female work. China and Japan are positioned in the fourth quadrant. Scandinavian countries are all in the second quadrant as well as Northern America countries. The situation is mixed for countries like Slovenia and United Kingdom, where both the indicators assume intermediate values. In Germany, France, Spain and Switzerland the attitude toward female business executives is particularly positive, while the belief that men have more rights to work than women is intermediate.
Quite interestingly, the correlation between both indicators of attitude toward female employment and the employment gender gap (as defined in Section 2.2) is positive and significant. The Pearson’s correlation coefficient in both cases stands at 0.47, not much in absolute terms, but enough to affirm that labour market inclusiveness for women is lower where the attitude toward female employment is less positive (please note that no causal link can be identified in this simple framework: the direction of causality could run from attitudes to employment rates, but there could also be external factors determining jointly both attitudes and the difference between male and female employment rates).
In this context, it would be also interesting to study the relationship between attitude towards female work and the gender pay gap, which represents another important indicator of discrimination against women in the labour market. Here a relevant data availability problem emerges, as standardised and comparable data on wages available for both EU and extra-EU countries are rather hard to find. While Eurostat and OECD provide reliable statistics respectively for EU-27 and the OECD countries, still the comparison cannot be extended to China and India. Apart from subjective surveys (e.g. the Executive Opinion Survey used by the World Economic Forum for its Global Gender Gap report), the only source available for all the countries included in our study is the United Nations Development Programme (UNDP), which estimates a global indicator of the ratio between female and male earned income. This indicator originates from an estimation of the female share of the wage bill, which is then applied to GDP and then divided by respectively the male and female population3. Accordingly, it is not a measure of the simple
3
Please refer to: http://hdr.undp.org/en/media/HDR_20072008_EN_Technical1.pdf for details on the
gender differentials in wages but also depends on the proportion of the female economically active population over total population: this is why this indicator assumes values generally higher than the wage gap indicators provided by Eurostat for EU countries. Table 4.7 shows the ranking on this indicator for the countries object of study.
Figure 4.3. Attitude towards female work: an international comparison
Note: variables are standardized in the (-1, +1) range
Also in this case, a significant correlation emerges between the indicators of attitude towards female work and the earned income gap. The Pearson’s correlation coefficient between the “Men have more right to work than women” indicator and the female/male income ratio is -0.68, while between the “Men are better executives than women” and the female/male income ratio is -0.57. This evidence reinforces the previous results about employment gender gap, with the same caveats about the direction of causality.
U.S.A
Japan
India
China
Canada Switzerland
Norway
UK
Sweden Spain
Slovenia
Romania
Poland
Netherlands
Italy
Germany France
Finland
Cyprus
Bulgaria
‐1.00 ‐0.80 ‐0.60 ‐0.40 ‐0.20 0.00 0.20 0.40 0.60 0.80 1.00
‐1.00 ‐0.80 ‐0.60 ‐0.40 ‐0.20 0.00 0.20 0.40 0.60 0.80 1.00
Men better executives than women
Men
ha
v
e
more
rig
h
t
to
wo
rk
tha
n
wo
m
e
Table 4.7 – Ratio of female to male earned income (estimated)
This table ranks countries according to the ratio of female to male earned incomes in 2006.
Sweden 0.84 Norway 0.79 Finland 0.72 Romania 0.70
UK 0.70 Netherlands 0.66 Switzerland 0.66 Bulgaria 0.66
Canada 0.65 China 0.65
USA 0.64 France 0.62 Slovenia 0.62 Germany 0.61 Poland 0.60 Cyprus 0.60 Spain 0.53
Italy 0.49 Japan 0.46
India 0.32


![Named Entity Recognition and Correction in OCRized Corpora (Détection et correction automatique d’entités nommées dans des corpus OCRisés) [in French]](data:image/gif;base64,R0lGODlhAQABAIAAAP///wAAACH5BAEAAAAALAAAAAABAAEAAAICRAEAOw==)