Munich Personal RePEc Archive
To Group or Not to Group? Evidence
from Mutual Funds
patel, saurin and sarkissian, sergei
McGill University
20 April 2012
Online at
https://mpra.ub.uni-muenchen.de/38496/
To Group or Not to Group? Evidence from Mutual Funds
Saurin Patel and Sergei Sarkissian
*First draft: March 20, 2012 This draft: April 20, 2012
To Group or Not to Group? Evidence from Mutual Funds
Abstract
The literature has conflicting reports regarding the impact of group decision making on performance. We first observe that in mutual fund studies this results from large discrepancies in reported managerial structures between CRSP and Morningstar databases reaching on average 20% per year. Then we show that with more superior Morningstar data team-managed funds exhibit higher risk-adjusted returns than single-managed funds. The performance spread is present across all fund categories, except aggressive funds, and is robust to the inclusion of fund- and manager-level controls. Across various managerial structures, the largest team-induced gains are reached among funds managed by three individuals. Furthermore, teams significantly improve fund performance when funds are located in financial centers, reflecting larger networking potential and/or better skills of people who reside in larger cities. This improvement is achieved in teams more homogeneous in age and education. In spite of higher returns however, team-managed funds are not riskier than single-managed funds in terms of market exposure or idiosyncratic volatility. Finally, team-managed funds trade less aggressively and are able to generate extra inflows for their funds. Thus, collective decision making is beneficial, but its scale depends on team size and diversity as well as its geographic location.
JEL classifications: G23; J24
1. Introduction
There is a large body of theoretical and empirical studies across a variety of disciplines
that examines the benefits of group versus individual decision making. The idea that a “group
mind” is distinctly different from a single one was first put forward by the social psychologist Le
Bon (1896). From its inception, the concept of a “crowd” has generally been associated with
negative outcomes, in that people, who are loosely linked to each other but act collectively, are
believed to pose risks to the established laws and regulations. There is experimental evidence
that groups may indeed act more aggressively and undertake riskier decisions than the average
choices of individuals in a group – phenomena known as “risky shifts” (see Wallach and Kogan,
1965; Stoner, 1968) and “group polarization” (see Moscovici and Zavalloni, 1969; Kerr, 1992;
Sunstein, 2002).1 In addition, Janis (1982) developed the concept of a “groupthink” where people
in smaller groups accept decisions they may not fully agree on just to avoid conflicts with their
colleagues. All these studies imply inferior choices made within groups than among individuals
resulting from extreme decisions by a dominant player in a team or a reduction in critical
thinking for the sake of unanimity with other group members.2
There is an alternative economics and finance literature that highlights the benefits of
decision making process within groups.3 Sah and Stiglitz (1986, 1991) point out that, while
individual group members have different opinions, the aggregate “group opinion” is the average
opinion of all group members. Sharpe (1981) shows that teams in the portfolio management
industry are able to achieve diversification of style and judgment. Barry and Starks (1984)
provide a theoretical setting suggesting that teams in investment funds may reduce portfolio risk.
Very few empirical studies provide support to the opinion and risk diversification theories of
1
Ambrus, Greiner, and Pathak (2009) cast doubts on “group shifts” findings using the standard practice of comparing the means of group and individual decisions.
2
In economics, the negative effect of group decision making is often linked to possible productivity losses resulting from free-riding by some members of the teams of firm workers and the ways to reduce this problem (e.g., see Alchian and Demsetz, 1972; Holmstrom, 1982; Rasmusen, 1987; Nalbantian and Schotter, 1997).
3
groups.4 Hamilton, Nickerson, and Owan (2003), using data from the garment industry, find that
teams increase productivity, and that this increase is more apparent among earliest team
members, high-ability workers, and heterogeneous teams. Adams and Ferreira (2010) analyze
individual and group bettors in iceberg break-up betting and find that teams arrive to less
extreme decisions than individuals.
The goal of this paper is to analyze the effect of teams on fund performance, their
risk-taking behavior and other fund characteristics using a large U.S. equity mutual fund database.
There are two distinguishing feature of our analysis. First, we focus not only on the examination
of the individual/team split for fund performance but also on the understanding of the value of an
extra group member for the benefits of team management. The intuition here is that any group
work always leads to a tradeoff between a larger intrinsic knowledge base of the group versus a
difficulty in arriving at optimal decisions, especially under time constraints, which are present in
many job occupancies, including the mutual fund industry. Second, we differentiate the team
impact on fund performance across geographic locations, more specifically, between financial
centers and other cities. The intuition here is that the value of adding a new member to a team
must to be higher in large cities where each individual is more likely to bring to the group his/her
unique knowledge, skills, and networking ability.
Our data comes from Morningstar and covers the period between January 1992 and
December 2010. Some studies provide evidence of better and more precise coverage of mutual
funds by Morningstar than CRSP (e.g., see Elton, Gruber, and Blake, 2001; Massa, Reuter, and
Zitzewitz, 2010; Karagiannidis, 2010). However, these papers do not systematize the disparity in
fund management structure reporting. Therefore, as a first step, we highlight the discrepancies
between CRSP and Morningstar data on managerial structure of funds. We show that very often
4
CRSP reports single-managed funds while these funds are team-managed in Morningstar, and
vice versa. The existence of these differences, which in some years in excess of 20% of the
overall sample of named equity mutual funds, cast serious doubts on the results of many recent
studies that use fund manager-specific information using CRSP data.5 Indeed, the impact of a
team on fund performance using an exactly matched sample between CRSP and Morningstar is
very different for the two datasets. With CRSP data teams have no or negative contribution to
risk-adjusted returns computed based on unconditional and conditional versions of Carhart
(1997) model, while with Morningstar data teams show not only positive but also often
significant addition to fund performance.
Next, we examine the difference between team and single-managed funds across various
aspects of fund performance. We observe that on average funds which are team-managed have
higher risk adjusted returns than their single-managed counterparts. This result holds steadily
after accounting for a range of fund and manager characteristics and is present across various
fund investment objectives except those in aggressive growth category. We then examine the
relation between the size of a fund management team and fund returns. We observe that this
relation is non-linear. In particular, we find that three-person teams are the largest contributors to
fund performance relative to single-managed funds. This result corroborates well with the notion
of increasing problems of free-riding and decreasing cooperation effectiveness in larger groups
(e.g., Alchian and Demsetz, 1972; Holmstrom, 1982; Mueller, 2012). We also investigate the
benefits of group decision making across various locations. We split the sample into funds whose
advisors are located in six financial centers as defined in Christoffersen and Sarkissian (2009)
and those located in smaller cities and repeat our tests. We show that only funds located in
financial centers gain from team management, interpreting this result as highlighting the
importance of learning and information spillover effects in larger cities (e.g., see Jacobs 1969;
5
Glaeser, 1999). Locating in financial centers helps individual members to bring more
heterogeneous knowledge and skills to their teams and is consistent with diversification benefits
arising from team work argued by Sharpe (1981). In addition, we find among funds in financial
centers that those with more diverse team members in terms of age and undergraduate institution
underperform those with more homogeneous managers. These results are consistent with
potentially larger frictions and conflicts of interests associated with heterogeneous groups, as
emphasized in Jehn, Northcraft, and Neale (1999), and career concerns issues in the mutual fund
industry raised in Chevalier and Ellison (1999b).
Finally, we analyze whether team-managed funds exhibit different risk-taking behavior
than single-managed ones and what fund characteristics are associated with team management.
We find little evidence that team-managed and single-managed funds differ statistically in their
exposure to total risk, market risk, and idiosyncratic risk. However, the volatility of
team-managed funds is larger in economic terms than their single-team-managed counterparts.
Subsequently, we observe that a substantial part of this excess volatility among funds with
multiple managers comes from their statistically larger loadings on small and value stocks. We
further show that team-managed funds lead to substantially lower turnover, more than 12%
annually with a full set of fund and manager characteristic controls. This result implies less
aggressive trading within groups of portfolio managers and, therefore, provides additional
support that teams lead to less extreme behavior. Finally, teams help funds bring more money:
we find positive and significant link between team management and net fund flows reflecting a
recent trend in mutual fund industry to rely more on team-managed funds.
The list of empirical finance studies that deal with group and individual decision making
is not very long. For example, Prather and Middleton (2002) find no evidence of differences in
fund performance between group and individual decision making, but they deal with data sample
with large survivorship bias. Chen, Hong, Huang, and Kubik, (2004) find underperformance
among team-managed funds, while Bar, Kempf, and Ruenzi (2010) find that teams have lower
studies use CRSP data and do not account for manager characteristics. Massa, Reuter, and
Zitzewitz (2010) compare single, named, and anonymous team management practices.
Kostovetsky and Warner (2011) study manager turnover differences in equity mutual funds
while controlling for manager team size, but they do not examine fund performance issues
related to fund management structure.
The rest of the article is organized as follows. Section 2 presents the motivation for our
analysis and hypotheses development. Section 3 describes the fund- and manager-level data. In
section 4, we compare managerial structures reported in CRSP and Morningstar databases and
then conduct preliminary tests on the importance of team management for fund performance
using the two data sources. Section 5 presents the main empirical findings of our paper. Section 6
examines the differences between team-managed and single-managed funds in terms of various
measures of fund risk and several fund characteristics. Section 7 concludes.
2. Motivation and Hypotheses Development
There is widespread evidence nowadays from the industry that mutual funds prefer
moving towards team management. For example, below is an excerpt from the December 2,
2011 Reuters report:
Mutual fund star managers have gone the way of the vinyl record: They're cool to have, expensive to get, and sometimes, not the best quality. In their place, fund companies like Federated Investors, Eaton Vance and Invesco are moving in favor of a team-oriented approach. Even Fidelity Investments, home of one of the first star managers, Peter Lynch, has switched some funds to a team-managed approach. The move helps fund companies defend against poaching, protect their funds’ returns, and shield themselves from the level of outflows seen at competing firms after their high-profile stars have flamed out.6
6
Recent academic sources also document the same trend (e.g., Massa, Reuter, and Zitzewitz,
2010). This evidence however stands in stark contrast with the results of numerous experimental
and empirical academic studies that have tried, but with little success, to identify benefits of
group work in various fields of social science, including finance and economics. For instance,
papers such as Chen, Hong, Huang, and Kubik, (2004), Massa, Reuter, and Zitzewitz (2010),
Bar, Kempf, and Ruenzi (2010) among others find that team management in mutual funds
provides no gains over single-managed funds and even often leads to inferior performance. Some
literature from economics that finds beneficial impact of teams on productivity and more
balanced decision making, such as Hamilton, Nickerson, and Owan (2003) and Adams and
Ferreira (2009), are based on extremely limited data. Therefore, our main hypothesis, similar to
most of the aforementioned studies, states the rationale for the existence and the spread of
teamwork in fund management, namely:
H1. Fund performance is higher among team-managed funds.
Note that the value of group decision making may greatly depend on internal and external
factors. First, there are many studies that examine team performance as a function of team size.
For instance, research shows that larger teams may often perform worse than small ones (e.g.,
see Thompson, 2003; Mueller, 2012). While the earlier literature has no clear answer on the
optimal number of people in a group (on average, varies between five and ten), it is obvious that
the ideal team size should depend on the tasks performed by individuals within a group. It
appears that the more diluted the tasks are, the smaller should be the optimal group size.In this
respect, Mueller (2012) argues that if companies deal with various coordination and motivational
issues, then any group composed of five or more individuals will already see significant
increases in coordination costs within the group and diminishing motivation across members of
P1. Fund performance is non-linear in the number of team members.
Second, the value of an additional team member must be greater under those conditions
when each individual has a higher potential to enhance the overall knowledge and resource base
of the group. In the fund management industry in particular, skills, knowledge as well as
networking ability of each team member can be of great importance to fund performance.
Numerous studies have shown that those conditions are more readily available in larger cities
(e.g., see Jacobs 1969; Glaeser, 1999; Christoffersen and Sarkissian, 2009). Indeed, larger cities,
especially financial centers, can provide positive externalities to portfolio managers including,
but not limited to, easier knowledge transfer, faster and more diverse business connections, and
potential access to private information. Therefore, we can now formulate our second prediction:
P2. Fund performance is higher among team-managed funds located in larger cities.
Finally, numerous studies compare individual and group decision making to the level of
risk. We follow the arguments in Sah and Stiglitz (1986, 1991), Sharpe (1981), and Barry and
Starks (1984) and assume that working in teams does not induce extreme risk taking behavior
among portfolio managers. Thus, our second hypothesis can be stated as follows:
H2. Team-managed funds do not take excessive risk.
Note that given the inconclusiveness of previous studies on the impact of group decision making
on fund performance, it is imperative to deal with precise fund managerial structure data. We
3. Data
3.1. Main Data Source
Our primary data source is Morningstar Direct (MS, henceforth), a relatively new
survivorship-bias free institutional research product offered by Morningstar, Inc. This database
provides one of the most comprehensive and in-depth coverage of open-ended mutual funds
across the globe, including the United States. Our sample covers actively managed U.S.
diversified domestic equity funds with the following investment objectives: Aggressive Growth
(includes Small Company), Growth, Growth & Income, and Equity Income from 1992 to 2010.
We exclude all sector funds from our analysis because their portfolios are constrained to follow a
particular industry and hence are not diversified. We also exclude index funds because majority
of these funds are not actively managed. MS reports all data at the fund share class level,
including the names of the fund managers. However, different share classes of the same fund
might have identical underlying portfolio with the same fund manager(s). This might lead us to
multiple counting of fund management information and bias our analysis. To avoid such biases,
we aggregate mutual fund share class level observations to one fund level observation using a
unique fund identifier in MS.
To determine whether a fund is sole-managed or team-managed at the end of a calendar
year, we use the detailed fund manager data which includes fund manager names, the exact date
a fund manager joins and leaves a particular fund. We classify a fund as sole- or team-managed
based on the number of fund managers with the fund at the end of calendar year. When only one
fund manager is named at the end of calendar year, we classify that fund as sole-managed for
that year. Similarly, when two or more fund managers are named with the fund, we classify the
fund as team-managed. We remove all fund-years which have missing fund manager names or
tenure dates from our sample. Our final sample covers 3,935 unique funds with 35,440
manager-fund-year observations.
3.2. Fund Characteristics
For each fund we obtain information on total net assets under management, expense
ratios, turnover ratios, fund inception date, and fund family name from MS. This information
helps us control for fund characteristics that are well known in the literature to affect individual
fund performance. These characteristics typically include fund size, measured by the total net
assets under management of the fund at the end of calendar year; fund age, defined as the
difference between the fund’s inception year and the current year; expenses, measured by the
annual net expense ratio of the fund; turnover, measured by the turnover ratio of the fund; fund
family size, measured by the total net assets under management of the fund complex to which the
fund belongs at the end of calendar year; fund return volatility, measured by standard deviation
of raw net returns of funds over the past year. We also include net fund flows, defined as the net
growth in the total net assets of funds, as a percentage of their total net assets, adjusted for prior
year returns. To minimize the effect of outliers on our analysis, we winsorize expense ratios,
turnover and annual fund flow variables at 1% and 99% levels.
Christoffersen and Sarkissian (2009) show that fund managers located in financial centers
earn higher returns than their peers located in smaller towns. To control this location effect, we
obtain the location information of fund advisors from MS. Following Christoffersen and
Sarkissian (2009), we define the following six cities to be financial centers: Boston, Chicago,
Los Angeles, New York, Philadelphia, and San Francisco. If the fund advisor company is
headquartered within a 50-mile radius of any of these six cities, we classify the fund as located in
the financial center.
It is important to point that our location variable differs from the previous studies. Instead
of using the headquarter location of the fund company or fund sponsor (e.g., Christoffersen and
Sarkissian, 2009), we use the headquarter location of the fund advisor company. For majority of
funds, the fund advisor and the fund sponsor (the company that offers the mutual fund to public)
might be the same company (Chen, Hong, and Kubik, 2011). But for few funds they might be
advisor companies. By choosing the fund advisor location, we make analysis immune to the
possibility of any bias due to third-party fund management outsourcing.
3.3. Fund Manager Characteristics
In any study that examines potential impact of group decision making on fund
performance, it is important to control for the influence of manager’s demographic
characteristics.7 The demographic information available to us includes the name(s) of fund
manager(s), the name(s) of all funds they currently manage and have managed in the past, their
start and end dates with those funds, all undergraduate and graduate degrees received, the year in
which the degrees were granted, and the name of degree-granting institution. In addition, we also
have a detailed biographical sketch for all fund managers from MS. This sketch is provided to
MS by the fund managers themselves which includes their personal and past work experience
details. Following Chevalier and Ellison (1999a), we use these data to create four manager
characteristics variables: Manager Tenure, MBA dummy, Average SAT, and Manager Age.
Specifically, we define the manager tenure as the difference between the year when a
fund manager started as a portfolio manager for a given fund and the current year. To create the
MBA dummy variable, we use the graduate degree details of each fund manager in our sample.
We define the MBA dummy variable as one if the fund manager received an MBA degree and
zero otherwise. To construct the average SAT, we closely follow the methodology of Chevalier
and Ellison (1999a). First, we obtain the name of the undergraduate institution for each fund
manager. Then, we look for that institution’s SAT score in the 23-rd edition of Lovejoy’s
College Guide (see Straughn and Straughn, 1995). Most schools report the upper and lower of
median verbal and math scores for incoming student in that year. To calculate the composite
SAT score for a given school, we simply add the average of the upper and lower bounds of the
verbal score to the average of the upper and lower bounds of the math score. In few cases,
7
schools choose to report ACT scores instead of SAT. In those cases, we convert the ACT to an
equivalent SAT using SAT-ACT concordance tables provided by the College Board.8
The construction of fund manager age variable is not straightforward because very few
fund managers in our sample disclose their date of birth in their biographical sketch. To
overcome this problem, we again follow the methodology proposed by Chevalier and Ellison
(1999a). For managers who report their date of birth, we simply take the difference between the
year of their birth and the current year. For managers who do not report their date of birth, we
construct an approximate manager age variable by assuming that each manager was 21 year old
upon receiving their undergraduate degree. The limited coverage of undergraduate degree year
information does reduce our sample size, but does not affect our analysis.
An important difference between Chevalier and Ellison (1999a) and our study is that they
focus only on single manager funds, while our study focuses on both single- and team-managed
funds. It is relatively straightforward to create manager characteristics for single-managed funds.
But it is somewhat problematic to create manager characteristics for teams of fund managers.
Ideally, one might be able to create team characteristics based on detailed understanding of the
contribution of each team member. Unfortunately, we do not have any these data. To overcome
this problem, we simply assume equal contribution of each team member. Hence, manager
characteristics for a team, such as manager tenure, age and SAT scores will simply be the
equally-weighted average of manager tenure, age and SAT scores of each fund manager in the
team, respectively. For the MBA dummy variable in case of teams, we define it to be one if any
one of the team members has a MBA degree and zero otherwise.
3.4. Fund Performance Measures
For computing fund performance measures we use each fund’s monthly net fund returns
from MS. We use three different performance metrics: objective-adjusted returns, OAR,
8
unconditional four-factor alpha, (4U), using Carhart (1997) model, and conditional four-factor
alpha, (4C), following the application of Ferson and Schadt (1996) framework to Carhart
(1997) model. We define OAR as the difference between the average monthly return
(net-of-fees) of a fund in the year minus the mean fund returns across all funds for a given fund
investment objective and year. We estimate each fund’s unconditional and conditional
risk-adjusted alphas using the following two equations:
t i t i t i t i t m i i t
i r sSMB hHML mUMD e
r, , , , (1)
and
itTerm t t m Term i Tbill t t m Tbill i t i t i t i t m i i t
i r sSMB hHML mUMD b r Z b r Z e
r, , , 1 , 1 , , (2)
respectively, where ri,t is the monthly net fund return less the risk-free rate (proxied by the
one-month U.S. T-bill rate), rm,t is the monthly U.S. excess market return (i.e., the return on the
CRSP Value-weighted NYSE/AMEX/Nasdaq composite index less the one-month U.S. T-bill
rate), while i is the risk-adjusted return, unconditional in Eq. (1), (4U), and conditional in Eq.
(2), (4C). SMB, HML, and UMD are returns on the size, book-to-market, and momentum
portfolios, respectively.9 In equation (2), Tbill t
Z1 and Term t
Z1 are the two lagged (demeaned) public
information variables: the one-month U.S. Treasury bill rate (T-bill) and the term-structure
spread (Term), defined as the difference in yields on the 10-year U.S. government bond and
three-month U.S. T-bill.
Funds change the number of fund managers from year to year. Therefore, we remove all
fund-years that have less than 12 monthly fund return observations and estimate the fund alphas
using their prior twelve monthly returns. Although the 12-month horizon gives us fewer data
points for the estimation than we may want, we believe that given the high frequency of fund
9
manager turnover, the longer (greater than one year) estimation horizons will introduce bias in
our analysis by incorrectly attributing fund performance to a certain type management structure.
3.5. Summary Statistics
First, in Figure 1, we show the evolution of mutual fund management structure from 1992
to 2010. It depicts the percentage of single-managed and team-managed funds along with the
total number of funds in each year of our sample. The total number of funds increased from
around 750 in the beginning of the sample period to more than 2,000 by 2010, peaking in 2007
with close to 2,500 funds. Consistent with reports in other studies (e.g., Massa, Reuter, and
Zitzewitz, 2010), we can see that the proportion of single-managed funds has dropped
significantly in the last two decades from almost 70% in 1992 to around 30% in 2010.
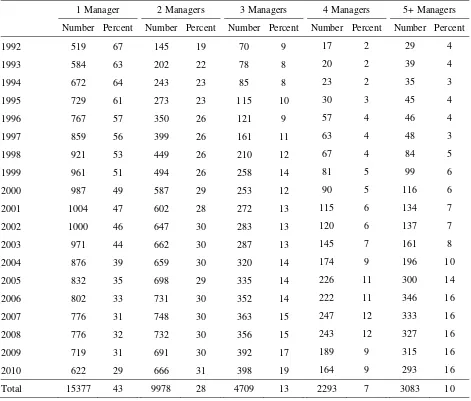
Table 1 shows the summary statistics of mutual funds by the fund management structure,
where the data on team-managed funds is divided into funds with two managers, three managers,
four managers, and five managers or more. Panel A reports the distribution (number and
proportion in percent) of single- and team-managed funds for each year in our sample. While all
team-managed funds have increased their presence in the industry, multiple-manager funds (five
and more) have experienced the largest relative and absolute gains in representation, four-fold
from 4% in 1992 to 16% in 2010. However, the largest proportion of team-managed funds has
been directed by two managers throughout our sample period.
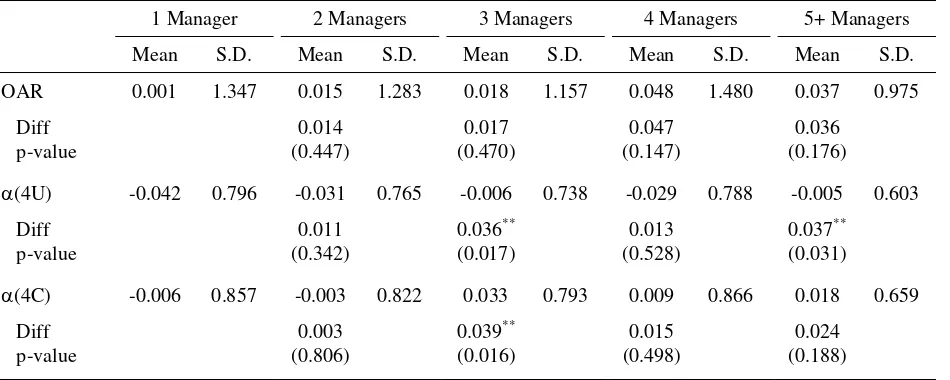
Panel B of Table 1 reports three measures of performance, OAR, (4U), and (4C), for
single and team-managed funds. It also contains information about the difference test in mean
performance measures between each group of team-managed funds and single-managed funds.
We can see that team-managed funds show better objective- and especially risk-adjusted
performance. For example, the difference in OAR between two-manager and single-manager
funds is 0.014 per month or about 17bp per year, while that between four-manager and
single-manager funds is almost 56bp per year, although this result is statistically insignificant.
by five or more people gain the most relative to funds managed by a single person. For
three-manager funds, the differences in (4U) and (4C) are 43bp and 47bp per year, respectively, and
these results are significant at the 5% level. For five-plus-manager funds, the positive and
significant difference is observed only with respect to the unconditional alpha measure. Other
team sizes are not associated with significant outperformance relative to single-managed funds.
Panel C of Table 1 reports mutual fund characteristics other than performance measures.
These include fund volatility, total net assets (Find Size), fund age (Fund Age), turnover, and
expenses. Among other fund characteristics, the notable differences across managerial structures
include turnover and expenses. Both these measures decrease with an increase in the number of
fund managers (and expenses decrease monotonically). In addition, fund size tends to increase
with team size. There are no obvious differences however in fund volatility and age.
Finally, Panel D of Table 1 reports fund manager characteristics for our five managerial
structure groups. We notice that the average tenure with the same fund is the highest among
single-managed funds and so are the average SAT scores. Not surprisingly, funds with larger
teams are more likely to have at least one manager with an MBA degree. The average age of
managers appears relatively stable across both single-managed and team-managed funds.
4. Management Structure: CRSP versus Morningstar
4.1. Fund Management Structure Differences
First of all, we determine the accuracy of funds’ management structure information by
comparing our MS sample to the widely used CRSP Survivorship Bias Free Mutual Fund
Database (CRSP, henceforth). Like MS, the unit of observation in CRSP is the fund share class
and the fund tickers are uniquely assigned to share classes. To avoid double counting of fund’s
management structure, we aggregate the share class-level information to fund level for each
inception. In cases where the fund ticker information is missing, we use fund names along with
their date of inception for matching purposes. We carefully do this matching by hand because
there are differences in fund naming conventions in both MS and CRSP. MS only reports the
most recent name adopted by the fund whereas CRSP reports different names adopted by the
fund over its active life. To ensure the accuracy of our matching strategy, we double check each
matched fund by hand. At the end, we are able to match 92.78% of our MS sample funds to
CRSP (3,651 out of 3,935 funds) sample between 1992 and 2010.
We also classify CRSP sample into single- or team-managed funds. For each fund in a
given calendar year CRSP reports the name of the fund manager(s) under “Portfolio Manager
Name” (also known as “mgr_name”) variable. We classify a fund as sole-managed when only
one manager name is listed and classify as team-managed when two or more managers (or
phrases such as “Team Managed” and “Investment Committee”) are listed. We remove funds
from our sample that report the name of the fund company or their advisor(s) under the manager
name variable. In addition, we also remove fund-year observations for which the manager name
is not available. We end up with 29,918 manager-fund-year observations in CRSP that represents
an 84.42% match with our main MS sample.
The table below provides an example of mismatch between the two data sources. This
example includes AARP Growth and Income Fund (CRSP Fund No: 53; MS Fundid:
FSUSA004ZG).
# Fund Managers
Fund Name (MS) Fund Name (CRSP) Year MS CRSP SEC
AARP Growth & Income AARP Growth & Income Fund 1992 3 3 -
AARP Growth & Income AARP Growth Tr: Growth and Income Fund 1993 3 1 -
AARP Growth & Income AARP Growth Tr: Growth and Income Fund 1994 3 1 -
The table compares the fund name as well as the number of fund managers that manage the fund
at the end of the each calendar year for both CRSP and MS. To test the accuracy of fund
manager information in both databases, we compare this information to the one provided by the
fund to the financial regulator, the Securities and Exchange Commission (SEC), each year. We
hand collect the fund manager information from the fund’s Prospectuses and other filings
available on SEC’s EDGAR database each year. To determine the number of fund managers in
the SEC database, we count the names of fund managers listed in the SEC filings at the end of
the calendar year.10 The first and second columns report the name of the fund given in MS and
CRSP, respectively. Columns 4-6 show the number of fund managers reported in MS, CRSP,
and SEC databases in a given year, respectively. The first three rows in the last column have
missing values because we were unable to find corresponding year’s SEC filings on EDGAR’s
website. This table shows the managerial structure reported by Morningstar is consistent with
SEC, but we cannot the say the same thing about CRSP data.
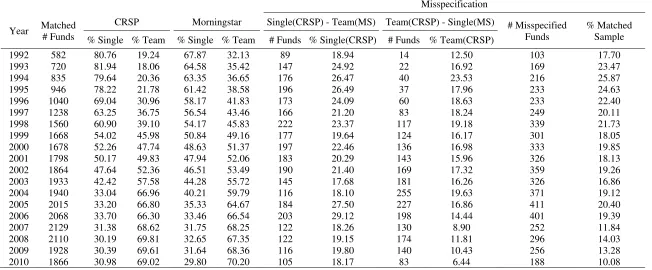
Table 2 reports the full extent of a misspecification in management structure between
CRSP and MS datasets for each year in our sample. Column 2 reports the number of matched
funds. We see that the overlap in funds between the two databases is large in every year of our
sample and it roughly follows the same trend as the overall number of funds in our sample
reported in Table 2. Column 3 and 4 as well as 5 and 6 report the percent of single-managed and
10
team-managed funds in CRSP and MS databases, respectively. We can observe that for the
whole of 1990s, especially in the beginning of the sample period, CRSP reports much more
single-managed funds than MS. Towards the 2000s, the overall proportion of single- and
team-managed funds becomes similar between the two databases. Columns 7 to 12 report
misspecification statistics. Columns 7 and 8 show the number of funds and their proportion that
is identified as single-managed funds in CRSP but are team-managed in MS. Columns 9 and 10
show the opposite problem, that is, the number of funds and their proportion that is identified as
team-managed funds in CRSP but are single-managed in MS. Finally, column 11 gives the total
number of misspecified funds, while the last column indicates the percent of misspecification in
the overall matched sample.
Columns 7-12 of Table 2 easily show that the largest misspecification in managerial
structure reporting between the two databases occurs in the early part of the sample. The total
misspecification is higher than 20% of the matched sample for most of the 1990s. However, even
in the 2000s, when both CRSP and MS report about the same proportion of single- and
team-managed funds (see columns 4 and 6), there is still a significant misreporting in fund
management structure that never goes below 10% of the sample. Note that the average
management structure misspecification over the whole sample period is almost 19%. Taking into
account the fact that we were not able to match about 16% of MS sample with CRSP database,
the actual misspecification in the reports on the number of managers between the two databases
is in excess of 20% during the last two decades. The range of misspecification in CRSP is 17%
to 29% for single-managed funds and 6% to 23% for team-managed funds. Thus, Table 2
illustrates that the extent of differences in management structure reporting between CRSP and
MS databases is very large and is likely to have a direct impact on studies using CRSP data in
analyzing the impact of teams in mutual funds returns.
Now we proceed to comparing the effect of team management on mutual fund
performance using CRSP and MS data. The regression model that we deal with has the following
general form:
t i t i t
i t
i t
i o
t
i c cTeam Fund Controls Mgr Controls FE e
Perf, 1 , 1 _ ,12 _ , 3 , , , (3)
where Perfi,t is one of our performance measures, Team is the dummy for multiple-manager
funds, Fund_Controlsi,t-1 and Mgr_Controlsi,t are the sets of fund- and manager-specific
characteristics, while FEi,t includes the year and fund investment objective fixed effects. Our
fund-level controls are lagged by one period to exclude the contemporaneous effect that they
may have on fund performance.
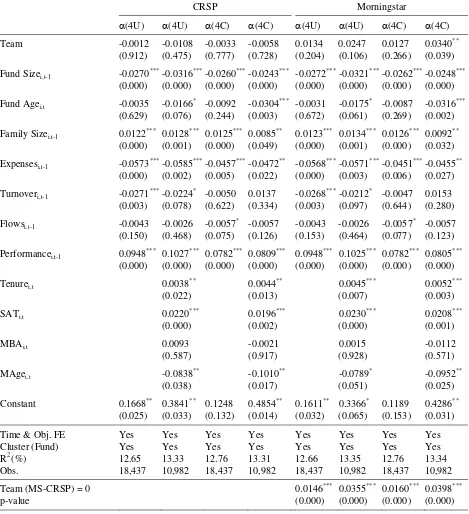
Table 3 reports the results of panel regression tests of our two risk-adjusted returns,
(4U) and (4C), computed in a similar way from CRSP and MS databases on a large set of
fund and manager characteristics. In this table we again use our matched sample between the two
databases. The independent variable of interest is Team, defined as a dummy variable which
equals one if the fund has two (or more) fund managers and zero if it has only one fund manager
at the end of calendar year. Most of other independent variables are defined in Table 1. To
reduce the influence of outliers, we take the natural logs of fund size, fund age, and manager age.
Variable Flows is the net growth in total net assets under management of the fund over the past
year. SAT score is divided by 100. All fund-level controls are lagged by one period except fund
age. All regression specifications include time and investment objective fixed effects (FE), and
the standard errors are clustered by fund. Each regression model also reports the number of
observations and the adjusted R2.
Panel A of Table 3 shows full sample estimations. There are 18,437 fund-year
observations with fund controls alone, but this number drops to 10,982 after the inclusion of
manager characteristics. Columns 1-4 report the estimation output using CRSP data. Columns 1
columns 3 and 4 show the corresponding estimates for (4C). We can see that in all these
regressions, the coefficient estimate on Team is negative but statistically insignificant. This result
could explain conclusions in many papers that use CRSP data that team management does not
add any positive value for fund performance (e.g., see Chen, Hong, Huang, and Kubik, 2004;
Bar, Kempf, and Ruenzi, 2011). Columns 5-8 of report the estimation output using MS data.
Again columns 1 and 2 show the estimates for (4U), while columns 3 and 4 for (4C), again
without and with fund manager controls, respectively. Now, we see that the results are drastically
different. The coefficient on Team is consistently positive across all estimations and, even
though is not always significant, is also economically sizable at least after accounting for both
fund and manager characteristics. Moreover, at the bottom of the panel we also report the test
results of the hypothesis that slope coefficients on Team in the corresponding MS and CRSP
estimations are the same, Team (MS-CRSP) = 0. As one can see, the difference is positive and
statistically highly significant across all four regression specifications. In economic terms, this
difference is 43-48bp per year, depending on the type of alpha, for the tests that are based on
estimates from regression models with a full set of control variables.
It is worthwhile to mention the estimation results related to our control variables. In
particular, note that the coefficient estimates and their statistical significance are very consistent
across both CRSP and MS, unlike the results on the Team dummy, and are in line with results in
previous studies. Among fund-level characteristics, we observe that fund size and expenses have
large detrimental effect on performance. These results are similar to findings in many other
papers.11 However, funds benefit when they are part of a larger family, again consistent with
earlier studies (Chen, Hong, Huang and Kubik, 2004; Pollet and Wilson, 2008). We also
document persistency in our two risk-adjusted performance measures. Finally, there is also some
evidence (for (4U)) that higher turnover reduces subsequent returns. As for the manager
characteristics, consistent with Chevalier and Ellison (1999a) we find a positive and highly
11
significant relation between fund performance metrics and managers’ SAT scores and no relation
to MBA degree. In addition, our results confirm that fund returns are higher for more
experienced managers with longer tenures at their respective funds (e.g., see Christoffersen and
Sarkissian, 2009). Note finally that even though the inclusion of manager characteristics
drastically reduces the total number of fund-year observations, the adjusted R2 indicate that they
provide incremental explanatory power for fund returns and therefore are important for proper
decoupling of the team management effect from manager-specific variables.
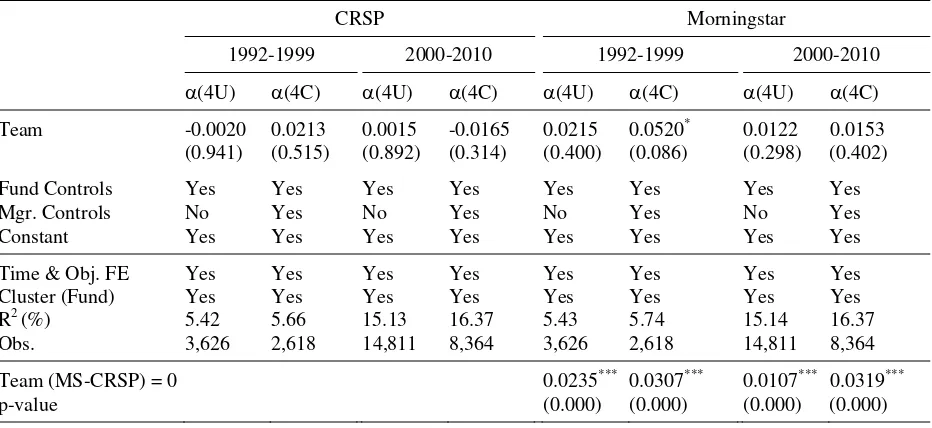
Panel B of Table 3 shows sub-sample estimations over two non-equal periods, 1992-1999
and 2000-2010. This non-equal time period split is motivated by some of the well-known earlier
results on the importance of teams for mutual fund returns, such as Chen, Hong, Huang, and
Kubik (2004), who use CRSP data over the 1992-1999 period and do not find any benefits for
team management. Each specification controls for fund and manager characteristics but, for the
sake of convenience, we report only the coefficient on Team dummy alongside with its
respective p-values. The evidence in Panel A that using MS data leads to significantly more
positive impact of team management on fund performance is present also in sub-sample
estimations. The test that slopes on Team for the respective MS and CRSP regressions are the
same, that is, Team (MS-CRSP) = 0, is rejected for all specifications.
Thus, Table 3 shows that large discrepancies in management structure records between
CRSP and MS databases can translate to significant differences in team management impact on
fund performance. Ceteris paribus, MS data is able to provide much more support for the
benefits of group decision making in the mutual fund industry.
4.3. Additional Misspecification Issues in Management Structure
There are two additional implications of the misspecification in management structure
data in CRSP which are important. First, one can no longer rely on the start dates of fund
manager(s) provided in this database, particularly in cases where more than one fund manager
unique fund manager entry and specifies the date the current manager(s) took control and
assumed responsibility of the fund. For entries that list one fund manager these dates might be
less problematic, but for entries that list two or more fund managers these dates might lead to
serious errors. By giving one start date for funds with two or more fund managers, CRSP leads
researchers to assume that these managers joined the fund on the same date which might not be
true in all cases. And this is exactly what we find in MS data, where in almost all team-managed
funds, different fund managers join the fund on different dates. Second, because CRSP provides
incomplete information on the number of fund managers (as shown previously), one also cannot
rely on the name of fund manager(s) provided in this dataset. Particularly, studies on manager
turnover which use fund manager names from CRSP might be affected from this
misspecification.
5. Team Management and Fund Performance: Empirical Tests
Having established that a researcher, using MS data, is more likely to find evidence of
positive contribution of team work in fund management industry, we now directly examine the
extent of its impact by using our full MS sample. Note that the sample that we use for the
reminder of the paper is larger than the one used in the CRSP-MS matching tests in Table 3. Our
goal is to analyze the potential benefits of team management for various fund and/or manager
characteristics.
5.1. The Average Effect of Team Management
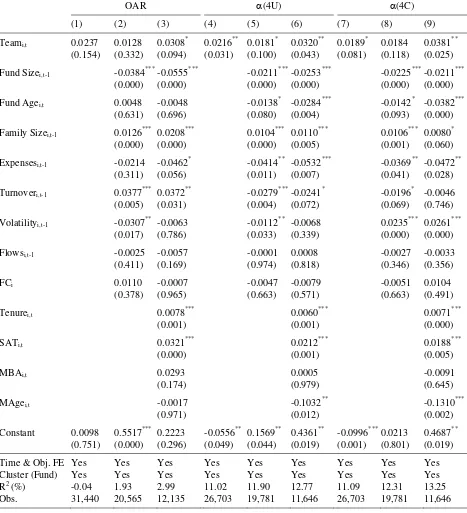
Table 4 reports the results of the tests on the impact on team management on our three
measures of fund performance, OAR, (4U) and (4C). We report test results with net
(expense-adjusted) returns in Panel A and gross (expense-un(expense-adjusted) returns in Panel B. As in Table 3, all
errors are clustered by fund. We also indicate the number of observations and the adjusted R2.
Again, the variable of interest is the Team dummy. Most of our controls are also similar to those
in Table 3 with two exceptions. First, given some controversy regarding the inclusion of lagged
dependent variable in panel tests, we no longer consider lagged performance measures as
additional independent variables.12 Second, given the evidence of funds returns may be different
across geographic locations (e.g., Coval and Moskowitz, 2001; Christoffersen and Sarkissian,
2009), now include a dummy variable for financial centers (FC) which equals one if the fund is
in a financial center and zero otherwise.
In columns 1-3 of Table 4, the dependent variable is the objective-adjusted returns. We
report the results without and with fund-level and manager-level controls. In Panel A, the Team
dummy comes up positive in all three regressions and is significant at the 10% level in the most
comprehensive specification that controls for both fund and manager characteristics. In this latter
regression, the economic impact of team management on objective-adjusted fund returns is close
to 40bp per year. In columns 4-6, the dependent variable is the four-factor alpha. In this case, in
Panel A even without controls, the impact of team management is positive and significant at the
5% level. After adding fund-level variables, its significance drops slightly to 10%, but with the
inclusion of manager characteristics, the coefficient on Team becomes significant at the 5%
level, and its economic magnitude increases by about 50% relative to that in column 4. In
columns 7-9, the dependent variable is conditional alpha. In Panel A, the coefficient on Team
again is positive in all three specifications, and while it is a bit less significant in the first two
regressions relative to the corresponding output in columns 4 and 5, it is again significant at the
5% level for the most comprehensive last regression specification. In fact, the economic impact
of team management on conditional alpha after accounting for all fund and manager
characteristics is 46bp per year. The slopes on most of the control variables in line with those
12
reported in Table 3.13 In Panel B of Table 4, we generally see the same pattern as in Panel A.
There is only a small reduction in economic and statistical significance of the coefficient on
Team dummy for each estimation vis-à-vis the corresponding test in Panel A. As before, the
impact of team management on fund performance is the largest after controlling for both
fund-level and manager characteristics.
We have observed that on average funds with team management practices appear to do
better than single-managed funds. The next natural inquiry is to determine whether teams benefit
all type of funds, irrespective of their investment objective. If team-induced performance gains
are concentrated in a specific fund category, then the most likely explanation for previous
findings will be not so much related to the benefits that teams brings to fund operations but
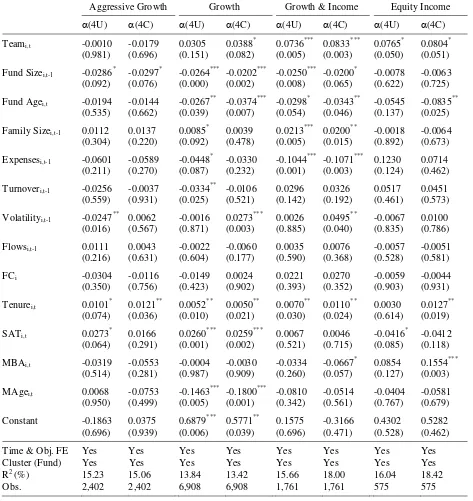
rather to the characteristics of that single fund category. Table 5 reports the results of our tests on
the impact on team management separately for each of the four fund investment objectives. We
show the outcome of tests for two risk-adjusted measures of fund performance, (4U) and (4C), and report the same set of estimates as in Table 4. The characteristics of regression
models are also the same as before but they always include both fund- and manager-level
controls.
Columns 1 and 2 of Table 5 show that team management virtually has no impact on
aggressive growth funds returns. This could be due to the fact that aggressive growth funds are
believed to be benefitting the most among other fund types from higher turnover rates; therefore,
coordinating frequent trading decisions among multiple team members may become impeding
for fund performance. Note also that aggressive growth funds deal with more “soft,” not easily
available information about stocks and, as Stein (2002) argued, in these cases, single-manager
structures may be preferable. This is not however the case for other objective categories. As
shown in columns 3-8, managerial teams have economically and statistically significant, at least
at 10% level, relation to risk-adjusted returns in all six estimations but one, for (4U) of growth
13
funds.14 Even in this case, the economic impact of team management is 37bp per year, while that
for growth & income and equity income funds approaches a whapping 1.00% per year.
Therefore, Table 5 illustrates that having funds managed by teams of managers benefits most of
fund categories.
5.2. The Effect of an Additional Team Member
Our previous analysis shows that on average team-managed funds perform better than
single-managed funds, and this result holds across most of fund investment objectives. Clearly,
another relevant question is whether the positive relation between team management and fund
returns is linear in team size. Prior research is very scarce on this issue. The only convincing
evidence of non-linear benefits of team size is present in Hamilton, Nickerson, and Owan (2003)
who find largest increases in productivity of garment industry workers when they join the teams
at the early stages of team formation.
Recall from our Table 1 (Panel B) that team size indeed appears to be important to fund
returns, and that the largest gains in risk-adjusted performance are observed among funds
administered by three managers. What is necessary to do now is to examine if this pattern
persists or changes after controlling for our usual sets of fund and manager characteristics.
Therefore, we run the following regression model:
t i t i t i t i t i t i t i t i t i e FE Controls Mgr Controls Fund FM c FM c FM c FM c c Perf , , 3 , 2 1 , 1 , 4 , 3 , 2 , 1 0 , _ _ 5 4 3 2
, (4)
where 2FMi,t, is a dummy which equals one if the fund has two fund managers at the end of
calendar year and zero otherwise; 3FMi,t, is a dummy which equals one if the fund has three fund
managers at the end of calendar year and zero otherwise; 4FMi,t is a dummy which equals one if
the fund has four fund managers at the end of calendar year and zero otherwise; and 5FMi,t is a
14
dummy which equals one if the fund has five (or more) fund managers at the end of calendar
year and zero otherwise. The other variables are defined as before.
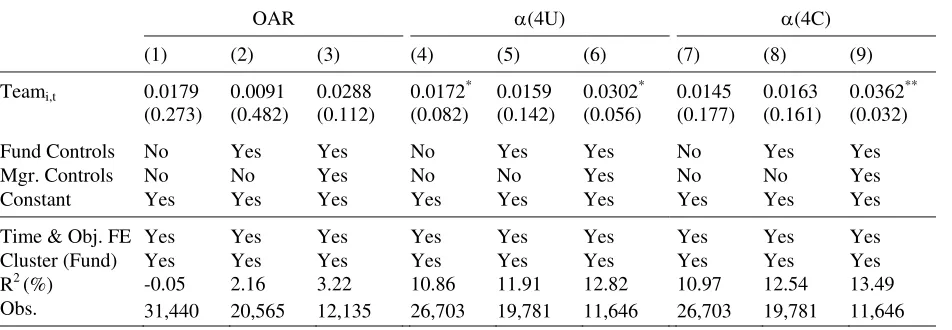
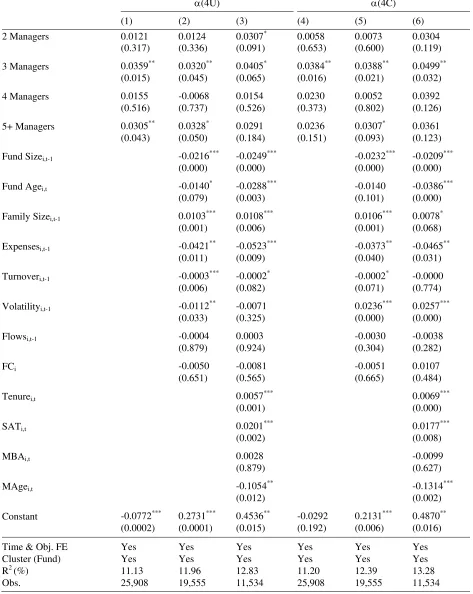
Table 6 shows the estimation results of fund management team size on the two measures
of risk-adjusted fund performance, (4U), and (4C). Consistent with results of simple
difference tests in Panel B of Table 1, the three-manager funds add the most of performance
gains vis-à-vis single-managed funds in terms of both unconditional and conditional alphas. The
economic value of a three-person team management on fund performance ranges between 50bp
and 60bp per year for the specification that includes all control characteristics (0.04 and 0.05
percent per month, respectively). Teams with two managers as well as larger teams (four and
five or more managers) add less performance gains relative to single-managed funds. These extra
benefits are not always statistically significant even at the 10% level which is achieved only
among funds with five or more managers. However, note that not only statistical significance of
funds managed by five people but also their economic impact decreases with the inclusion of
control variables, especially after accounting for average manager characteristics. Having said
that, the economic value of team management for funds that are managed by two, four, or five or
more managers can still remain sizable, although always less than that for funds managed by
three people in each respective tests specification. For instance, for funds with five or more
managers the annual impact of team management on their conditional alpha is 43bp, as reported
in column 6 (it is 60bp for three-manager funds).
Thus, Table 6 confirms our prediction P1 and shows that team size is non-linearly related
to fund performance. Intuitively, the number of team members determines the tradeoff associated
with larger knowledge base that more people bring to the team versus coordination costs among
multiple individuals, as indicated by Mueller (2012) and others. This result is also consistent
with Hamilton, Nickerson, and Owan (2003). Each group member brings his/her specific skills
and talents, but large cohorts of people with various views on the subject matter may reduce
5.3. Team Management and Geographic Location
If teams in the financial industry are able to achieve diversification of style and judgment,
as argued by Sharpe (1981), then the value of having a team must be more profound under those
conditions when there are more objective reasons for people in groups to have “uncorrelated” to
each other views. This can occur more easily in larger cities than in smaller communities.
Indeed, group members in larger cities may have more independent sources of information and
more diverse networking potential than residents of small towns. Therefore, we test this idea by
examining now the team impact on fund performance in financial centers versus smaller towns.
The regression model is as follows,
t i t i t i t i i i t i t i t i e FE Controls Mgr Controls Fund FC c FC Team c Team c c Perf , , 3 , 2 1 , 1 3 , 2 , 1 0 , _ _
, (5)
where Teami,tFCi is the interaction term between the dummies on team management and
financial center dummies.
Table 7 reports the estimation results of fund management team size on our two
risk-adjusted measures of fund performance, (4U), and (4C). Besides reporting the usual outcome
of estimations, for each regression it also shows the results of the F-test of the hypothesis that the
performance of team-managed and single-managed funds is the same. These tests are conducted
separately across funds whose advisors are located in six financial centers and those outside that
set of cities. Columns 1, 2, and 3 of the table show the estimation results for the unconditional
alpha without controls, with fund controls only, and with full set of control variables,
respectively. We can see that in all three specifications, the coefficient on Team is statistically
zero (sometimes positive, sometimes negative), implying that teams add no gains to performance
for funds not located in financial centers. The F-test at the bottom of the table restates these
results. However, the value of a team is diametrically opposite in financial centers. First, the
coefficient on the interaction term is consistently positive and economically significant,
and more importantly, the F-test shows that in financial centers team-managed funds always
significantly (at the 5% level) outperform single managed funds.15
Our estimations with conditional alpha in columns 4-6 of Table 7 lead to the same
findings. Again, we observe no gains to managing funds in teams if the locations of funds
advisors are outside financial centers. When funds are in financial centers, the evidence of
benefits of group-decision making is even higher than before. Both economic and statistical
results are stronger than in the case of unconditional alpha. For instance, for the regression
specification with the full set of control variables (column 6), the marginal value of
multiple-manager funds versus single-managed ones is almost 70bp per year, and this difference is
statistically significant at the 1% level. All these findings confirm our prediction P2.
The results in Table 7 support Sharpe (1981) arguments and provide novel evidence that
group decision making is more beneficial in such environments where group members are more
likely to acquire knowledge and skills and establish business connections. Clearly, at least in the
finance industry in general and mutual fund industry in particular, this becomes more achievable
in financial centers than in smaller cities. Our evidence also highlights a new example of superior
learning and/or knowledge spillover effects in larger cities as argued by Jacobs (1969), Glaeser
(1999) and others.
5.4. The Role of Team Diversity
Besides the tradeoff between group and individual decision making and the determination
of the optimal size of a team, the other important question is the potential effect of group
diversity on performance. The literature on diversity in teams has led to inconclusive results
regarding the impact of group composition on their performance (see Williams and O’Reilly,
1998; Jehn, Northcraft, and Neale, 1999; Hamilton, Nickerson, and Owan, 2003; Van
Knippenberg and Schippers, 2007). On the positive side, larger diversity in team members may
15
In these tests, we test whether the combined coefficient of the team impact on fund performance, c1+c2, is positive
enhance information processing skills of the group as a whole; on the negative side – significant
differences among team members may cause frictions, conflicts of interests, and within-group
biases. Most of the aforementioned studies deal with limited experimental and empirical data.
Our rich mutual fund dataset with various characteristics of fund managers provides an
ideal testing ground for the examination of the effect of group diversity on fund performance. In
particular, we can create diversity proxies across three dimensions of fund manager
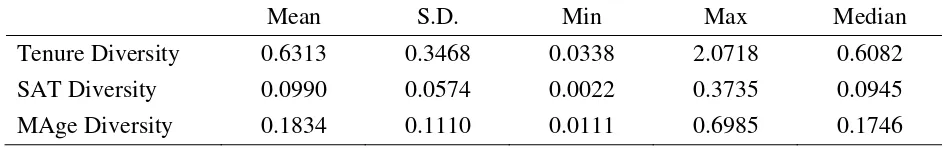
characteristics: tenure with the fund, SAT score, and age. As a diversity measure we use the
coefficient of variation. It is the ratio of the standard deviation of a variable over its mean, and it
is a useful statistic for data which can only take non-negative values (e.g., see Allison, 1978).
Thus, our diversity proxies are:
) (
/ )
( , ,
,t it it
i Tenure Tenure
Diversity
Tenure , (6)
) ( / )
( , ,
,t it it
i SAT SAT
Diversity
SAT , (7)
) (
/ )
( , ,
,t it it
i MAge MAge
Diversity
MAge , (8)
where and are the standard deviation and mean of the corresponding manager characteristic,
respectively. The table below reports the summary statistics of these diversity measures.
Mean S.D. Min Max Median
Tenure Diversity 0.6313 0.3468 0.0338 2.0718 0.6082
SAT Diversity 0.0990 0.0574 0.0022 0.3735 0.0945
MAge Diversity 0.1834 0.1110 0.0111 0.6985 0.1746
All average and median diversity measures are within 0-1 range. The largest spread in these
[image:31.612.69.541.509.583.2]measures is observed for the fund tenure diversity, the smallest for SAT score diversity.
Table 8 shows the impact of team diversity on fund performance for funds located in
since we already determined a primary impact of team management on funds located in larger
cities. The table reports the estimates from panel regressions of unconditional and conditional
fund alphas on three team diversity measures defined by Eqs. (6-8), the number of observations,
and the adjusted R-squares.16 Columns 1 to 4 show the results for funds in financial centers,
while columns 5 to 8 – in other locations. In columns 1 and 3 financial center fund alphas are
regressed only on the three manager diversity measures with no any controls. We observe
significant economic and statistical impact of diversity in SAT scores and manager age on fund
performance, and this relation is negative. This implies that homogeneous teams in financial
centers outperform heterogeneous ones. The diversity in manager tenure does not appear to play
an important role for fund returns. After controlling for the full set of fund and manager
characteristics, including the team size in columns (2) and (4), our earlier conclusions only
strengthen. Now, the values and statistical significance of coefficients on manager diversity
measures based on SAT scores and age increase, while retaining the negative sign. A one
standard deviation (0.06) increase in the SAT score diversity increases unconditional and
conditional alphas by about 50bp and 70bp per year, respectively, while one standard deviation
(0.1) increase in manager age diversity leads up to 60bp annual performance boost based on
conditional alpha. We do not find any consistent evidence for the importance of diversity in team
members among funds located outside financial centers, illustrating again the irrelevance of team
management for fund performance for these types of funds. The only significant outcome occurs
with manager tenure diversity which results in a positive slope when the dependent variable is
conditional alpha after controlling for fund and other manager characteristics.
Thus, our findings support other papers on team diversity that highlight more problems
than benefits associated with grouping people with different characteristics into the same teams
(e.g., Jehn, Northcraft, and Neale, 1999). The results are also consistent with career concerns
16
issues in mutual funds (e.g., see Chevalier and Ellison, 1999b). Managers with large differences
in incentives and career options, stemming from differences in their educational background and
age, are unlikely to collaborate well on such vaguely defined issues as fund portfolio
composition and trading activity.
6. Team Management, Risk Taking, and Fund Characteristics
After analyzing various aspects of performance differences between team-managed and
single-managed funds in the earlier part of the paper, in this section, we examine whether there
exist systematic differences in risk taking and other fund characteristics that can be distinctly
attributed to group decision making in mutual fund industry. First, recall that the existing
literature is unclear on the impact of team on risk taking. Some studies, such as Wallach and
Kogan (1965), Stoner (1968), Sunstein (2002), and others find that groups could act more
aggressively and undertake more risk. Other studies, however, such as Barry and Starks (1984)
and Adams and Ferreira (2009), provide theoretical and some empirical evidence that groups,
may in fact, reduce risk. To address these issues within our framework, we use the following
model:
t i t i t
i t
i t
i t
i d dTeam Fund Controls Mgr Controls FE e
Risk, 0 1 , 1 _ ,12 _ , 3 , , , (7)
where Riski,t is one of fund’s i risk measures at time t. We consider several risk measures. The
first is the total volatility of the fund. The second is market risk and the idiosyncratic residual
volatility coming from the standard CAPM. The final set comes from the Carhart (1997) model
(see Eq. (1)) and includes market beta, the loadings on size, book-to-market and momentum
portfolios, as well as the idiosyncratic residual volatility from this model.
Table 8 reports the results of the estimation of the impact of team management on various
and IdVol1, respectively, while these risks from the Carhart (1997) model as Mrk4 and IdVol4,
respectively. Each regression specification includes a full set of fund and manager controls as in
previous tests with the exception of two fund-level variables, namely, fund family size and net
flows. There are no a priori expectations about the impact of those two variables have on risk
characteristics of funds. We can see that team management has no statistically significant impact
on funds’ total risk, market risk, or idiosyncratic risk, irrespective whether the latter two
measures are estimated based on the CAPM or Carhart (1997) model. One could still argue that
the total risk of team managed funds, even though being insignificant statistically, is large in
economic sense, reaching almost 1% per year (0.0797*12). However, the two metrics of the
idiosyncratic risk, IdVol1 and IdVol4, that have different signs as well as economically similar
yet small exposures to the market portfolio, Mrk1 and Mrk4 imply at best potential exposure to
non-conventional risk measures. Indeed, we observe that team-managed funds load more on
small firms and high book-to-market firms: the coefficients on SMB and HML are both positive
and significant. Among control variables, the most consistent results for market risk are that we
find that it increases for large funds and funds with higher turnover rates. Also, we note that fund
age has negative and almost everywhere statistically significant impact on risk across most of its
measures except momentum.
In sum, Table 8 illustrates that the impact of group-decision making on fund risk taking
behavior is not very straightforward. Team-managed funds do not seem to take more market risk,
and their volatility, both total and risk-adjusted, is also non-excessive, but they may expose
themselves more to other possible measures of risk than single-managed funds.
Next, we look if team management is associated with specific fund characteristics using
the regression setting below:
t i t i t
i t
i t
i t
i d dTeam Fund Controls Mgr Controls FE e