Research Article
Renin-Angiotensin System Gene Variants and Type 2 Diabetes
Mellitus: Influence of Angiotensinogen
Siew Mei Joyce-Tan,
1Shamsul Mohd Zain,
1Munavvar Zubaid Abdul Sattar,
2and Nor Azizan Abdullah
11Department of Pharmacology, Faculty of Medicine, University of Malaya, 50603 Kuala Lumpur, Malaysia
2School of Pharmaceutical Sciences, University Sains Malaysia, 11800 Penang, Malaysia
Correspondence should be addressed to Nor Azizan Abdullah; azizan@ummc.edu.my
Received 17 November 2014; Revised 24 April 2015; Accepted 11 May 2015
Academic Editor: Aziz Ghahary
Copyright © 2016 Siew Mei Joyce-Tan et al. This is an open access article distributed under the Creative Commons Attribution License, which permits unrestricted use, distribution, and reproduction in any medium, provided the original work is properly cited.
Genome-wide association studies (GWAS) have been successfully used to call for variants associated with diseases including type 2 diabetes mellitus (T2DM). However, some variants are not included in the GWAS to avoid penalty in multiple hypothetic testing. Thus, candidate gene approach is still useful even at GWAS era. This study attempted to assess whether genetic variations in the renin-angiotensin system (RAS) and their gene interactions are associated with T2DM risk. We genotyped 290 T2DM patients and
267 controls using three genes of the RAS, namely, angiotensin converting enzyme (ACE), angiotensinogen (AGT), and angiotensin
II type 1 receptor (AGTR1). There were significant differences in allele frequencies between cases and controls forAGTvariants
(𝑃 = 0.05) but not forACEandAGTR1. Haplotype TCG of theAGTwas associated with increased risk of T2DM (OR 1.92, 95%
CI 1.15–3.20, permuted𝑃 = 0.012); however, no evidence of significant gene-gene interactions was seen. Nonetheless, our analysis
revealed that the associations of theAGTvariants with T2DM were independently associated. Thus, this study suggests that genetic
variants of the RAS can modestly influence the T2DM risk.
1. Introduction
Type 2 diabetes mellitus (T2DM) is a major public health concern and affected patients stand a higher risk of suffering the injurious effects of hyperglycemia such as coronary artery disease, peripheral arterial disease, and ultimately stroke [1]. Prolonged hyperglycemia could lead to the development of microvascular complications such as diabetic nephropathy, neuropathy, and retinopathy [2]. The number of individuals with diabetes is on the rise and the figure is expected to reach 552 million by 2030 owing to many factors such as population growth, aging, urbanisation, obesity, and physical inactivity [3]. Although environmental factors are reasons often consid-ered, it is important to keep in mind that environmental fac-tors, by themselves, represent only a fraction of cases. Individ-uals with family history of T2DM are at higher risk of devel-oping the disease as shown in familial studies [4] suggesting strong genetic contribution.
Now that the genome-wide association studies (GWAS) are feasible, allowing genetic data to be collected at unprece-dented rates, many disease-associated alleles have been iden-tified through GWAS and applied to T2DM [5]. Notwith-standing that, one cannot deny that the candidate gene approach has been a pioneer and at a forefront of genetic asso-ciation studies. The so-called genome-wide significance level (𝑃 < 5 × 10⁸) has limited the common and rare variants cap-turing and hence contribute to the missing heritability. Thus, candidate gene approach is still valuable even at the GWAS era. The roles of renin-angiotensin system (RAS) in insulin signaling pathway and insulin resistance have been well doc-umented [6]. The blockade of the system has been shown to have beneficial effects in the prevention of T2DM [7]. These findings strongly imply that the variations in RAS might be associated with the onset of T2DM. Nevertheless, the under-lying genetic mechanisms of the RAS and susceptibility to T2DM remain poorly understood.
In this study, we examined the association of genetic variations of the RAS with susceptibility to T2DM in the Malaysian Malays. While most of the reports are centered on the Western populations, little is known about the data from the Asians. Furthermore, the Malaysian Malays differ in terms of population structure among other Asians including the Chinese and Japanese [8]. However, whether or not the genetic variations of the RAS contribute to the risk difference of T2DM remains to be investigated and is a hypothesis of this study. We also examined the gene-gene interactions within the system in order to understand the gene-gene effect on the occurrence of T2DM.
2. Methods
2.1. Study Participants. This study consisted of 557 Malay participants, 290 of which are T2DM patients and 267 are controls recruited from the University Malaya Medical Cen-tre (UMMC). T2DM patients and controls were matched by age with mean age of 57.4 and 57.0, respectively. T2DM was diagnosed by qualified clinicians based on fasting blood glucose (FBG) levels≥7.0 mmol/L for two consecutive routine screen readings and glycated haemoglobin (HbA1c)≥6.5% (≥48 mmol/mol) with normoalbuminuria, and without a his-tory of any renal complications. Controls were those coming for routine health screening at clinics, with no evidence or family history of T2DM. The study was approved by the medical ethics committee of the UMMC and was performed according to the Declaration of Helsinki. Written informed consent was obtained from all study participants prior to participation into the study.
2.2. Laboratory and Clinical Data. Anthropometric data such as height (cm), weight (kg), body mass index (BMI, kg/m2), and waist circumference were determined as standard proto-col. Measurement of blood pressure (mmHg) was according to standard recommendation and clinical practice guidelines. The biochemical tests for the determination of fasting blood glucose (mmol/L), HbA1C (%, mmol/mol), serum urea (mmol/L), serum creatinine (mmol/L), glomerular filtration rate (GFR) (mL/min/1.72 m2), serum triglyceride (mmol/L), serum cholesterol (mmol/L), high density lipoprotein (HDL) (mmol/L), and low density lipoprotein (LDL) (mmol/L) were according to standard clinical laboratory methods carried out in an accredited laboratory at UMMC. Other clinical data included were information on duration of diabetes, presence of any complication, and history of other disorders.
2.3. Genotyping. Genomic DNA was extracted from periph-eral blood leucocytes using the QIAamp DNA Blood Mini Kit (Qiagen, Valencia, CA, USA) according to manufacturer’s protocols. Genotyping was carried out for the selected vari-ants: angiotensin converting enzyme (ACE) rs4344, rs4359, rs4363, rs4459609, rs1800764, and ACE Insertion/Deletion; angiotensinogen (AGT) rs699, rs4762, and rs5051; and angiotensin II type 1 receptor (AGTR1) rs388915. Amplifica-tion and quantitative real-time RT-PCR analyses were carried out by using Step One Real Time PCR system (Applied Biosystems, USA). The total reaction volume for each well
was 10𝜇L containing 5𝜇L (2x) TaqMan Genotyping Master Mix (Applied Biosystems, USA), 0.5𝜇L customized assay mix (20x) containing sense and antisense primers and TaqMan probe (Applied Biosystems, USA) specific to each gene, 3.5𝜇L distilled water, and 1𝜇L (10–20 ng) genomic DNA. Cycles were 60∘C for 30 sec, a 10 min 95∘C denaturing step, followed by 40 cycles of 95∘C denaturation, incubated at 60∘C for 1 min, and denatured at 95∘C for 15 sec for the final step.
2.4. Statistical Analysis. All statistical tests were performed using SPSS version 18.0 (IBM Corp., Chicago, IL, USA), otherwise mentioned. Data were presented as percentage or mean±standard deviation (S.D.). Categorical and con-tinuous variables were compared between patients with diabetes and patients without diabetes using Pearson’s𝜒2test, independent𝑡-test, and Mann-Whitney𝑈test as appropriate. Hardy-Weinberg equilibrium (HWE) was checked for the genotype distribution prior to genetic analysis using a good-ness of fit𝜒2test. Deviation from HWE was called when the 𝑃 < 0.05. Odds ratios and 95% confidence interval (CI) for the findings were computed using logistic regression. Mul-tivariate analysis revealed that gender, waist circumference, and waist-to-hip ratio (WHR) are contributing factors associ-ated with T2DM. Gender was collapsed into men and women in the subsequent analysis; thus, adjustment would render unnecessary. Waist circumference was used in the multiple logistic regression as suggested earlier [9]. Correction for multiple testing was performed using Bonferroni’s method. Linkage disequilibrium (LD) and haplotype analyses were computed using Haploview 4.2 program.𝑃values for haplo-type analysis were calculated based on 100,000 permutations. The odds ratio for the haplotype association was calculated using R program version 2.11.1. Parameter comparisons among genotypes were tested using Analysis of Variance (ANOVA) and Kruskal-Wallis as appropriate. Linear regres-sion was used to assess the correlation between genetic variants and clinical parameters for normally distributed variables; otherwise, Spearman’s correlation test was adopted. A two-sided𝑃value of<0.05 is considered to be statistically significant. To investigate the influence of gene-gene inter-action on T2DM, Generalized Multifactor Dimensionality Reduction (GMDR) method was employed. All possible interactions were tested using 10-fold cross validation with exhaustive search, which considers all possible variable com-binations.
3. Results
Table 1: Demographic and clinical data of participants.
Characteristics 𝑛(%) or mean±SD 𝑃value
Control (𝑛 = 267) DM (𝑛 = 290)
Gender 0.824a
Male 108 (40) 120 (41)
Female 159 (60) 170 (59)
Age 57.0±6.9 57.4±6.2 0.618
BMI (kg/m2) 26.9±4.9 27.3±4.6 0.317b
Waist circumference (cm) 86.3±12.7 91.8±11.9 <0.000b
Waist-to-hip ratio 0.87±0.1 0.90±0.1 <0.0001
Systolic blood pressure (mmHg) 131.7±15.5 133.7±15.8 0.058
Diastolic blood pressure (mmHg) 78.8±10.3 77.8±8.5 0.650
Fasting blood glucose (mmol/L) 5.3±0.7 8.4±3.1 <0.0001
HbA1c (%) (mmol/mol) 5.5±0.5 (36±6) 8.8±1.9 (73±21) <0.0001
Serum urea (mmol/L) 5.5±7.8 5.3±1.8 <0.0001
Serum creatinine (mmol/L) 76.9±22.6 86.3±25.3 <0.0001
Glomerular filtration rate (mL/min/1.7 m2) 85.4±25.1 77.4±23.3 0.988b
Triglyceride (mmol/L) 1.8±5.2 1.8±0.9 <0.0001
Total cholesterol (mmol/L) 5.2±3.8 4.8±3.2 <0.0001
HDL cholesterol (mmol/L) 1.9±8.2 1.6±5.9 <0.0001
LDL cholesterol (mmol/L) 3.0±0.9 2.6±1.0 <0.0001
[image:3.600.62.548.388.603.2]a𝑃values were obtained using Pearson’s𝜒2test,b𝑃values were obtained using independent𝑡-test, and other comparisons used Mann-Whitney𝑈test.
Table 2: Demographic and clinical data of male participants.
Characteristics Mean±SD 𝑃value
Control (𝑛 = 108) DM (𝑛 = 120)
Age (years) 57.4±6.8 58.13±6.2 0.753a
BMI (kg/m2) 26.7±4.1 27.2±4.1 0.986a
Waist circumference (cm) 90.8±11.1 95.3±11.7 0.003a
Waist-to-hip ratio 0.90±0.1 0.94±0.1 <0.0001
Systolic pressure (mmHg) 131.30±15.7 133.78±14.9 0.112
Diastolic pressure (mmHg) 79.11±10.3 78.22±9.0 0.676
Fasting blood glucose (mmol/L) 5.29±0.7 8.33±2.8 <0.0001
HbA1c (%) (mmol/mol) 5.44±0.5 (35.93±5.6) 8.65±2.0 (70.98±21.7) <0.0001
Serum urea (mmol/L) 5.28±2.3 5.42±1.6 0.101
Serum creatinine (mmol/L) 91.70±19.5 99.60±23.5 0.022
Glomerular filtration rate (mL/min/1.72 m2) 79.20±19.2 75.40±21.1 0.232a
Triglyceride (mmol/L) 2.35±8.1 1.78±1.0 0.276
Total cholesterol (mmol/L) 5.38±5.9 4.50±1.2 0.005
HDL cholesterol (mmol/L) 1.24±0.4 1.98±9.2 0.088
LDL cholesterol (mmol/L) 2.94±0.9 2.53±0.9 <0.0001
a𝑃values were obtained using independent𝑡-test and other comparisons used Mann-Whitney𝑈test.
serum cholesterol, and low density lipoprotein in men with diabetes and controls (Table 2).
3.1. RAS Variants and T2DM. Assessment of genotype dis-tributions in both T2DM patients and controls indicated no deviation from HWE, thus, providing confidence for the genetic analysis. None of the investigated genetic variants were associated with T2DM in the overall participants as
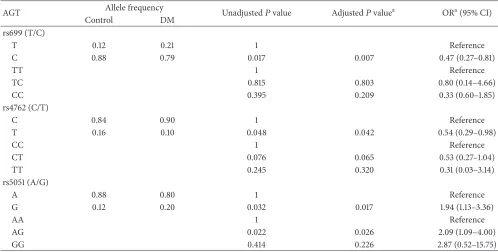
Table 3: Association of AGT SNPs with diabetes in the male gender.
AGT Allele frequency Unadjusted𝑃value Adjusted𝑃valuea ORa(95% CI)
Control DM
rs699 (T/C)
T 0.12 0.21 1 Reference
C 0.88 0.79 0.017 0.007 0.47 (0.27–0.81)
TT 1 Reference
TC 0.815 0.803 0.80 (0.14–4.66)
CC 0.395 0.209 0.33 (0.60–1.85)
rs4762 (C/T)
C 0.84 0.90 1 Reference
T 0.16 0.10 0.048 0.042 0.54 (0.29–0.98)
CC 1 Reference
CT 0.076 0.065 0.53 (0.27–1.04)
TT 0.245 0.320 0.31 (0.03–3.14)
rs5051 (A/G)
A 0.88 0.80 1 Reference
G 0.12 0.20 0.032 0.017 1.94 (1.13–3.36)
AA 1 Reference
AG 0.022 0.026 2.09 (1.09–4.00)
GG 0.414 0.226 2.87 (0.52–15.75)
aAdjusted for waist circumference, age, and BMI.
associated with T2DM only in male (Table 3). However, none of the genetic variants withinACE and AGTR1were associated with T2DM (Supplementary Table 2).
TheAGTrs699-C and rs4762-T alleles were significantly higher in the controls compared to the patients (adjusted OR 0.47, 95% CI 0.27–0.81,𝑃 = 0.007and adjusted OR 0.54, 95% CI 0.29–0.98,𝑃 = 0.042, resp.), suggesting that these variants are associated with reduced risk of T2DM. Nonetheless, the
AGTrs5051-G allele was associated with 1.94-fold increased risk of T2DM (𝑃 = 0.017). These findings, after adjustments for the confounding factors, clearly indicated that the variants were independent predictors for T2DM. Although our initial multivariate analysis found no contributing effect of age and BMI, we ought to include these variables during the adjust-ment as they are strong predictors for the developadjust-ment of T2DM [12]. Differences observed between the patients and controls, especially in fasting blood glucose and HbA1c, were not adjusted for as these are diabetes-associated risk factors. While dyslipidemia was excluded as it is attributed to metabolic disorder from diabetes. Following correction for multiple testing (0.05/6), onlyAGTrs699𝑃value remained significant.
3.2. Linkage Disequilibrium and Haplotype Association of AGT Variants in the Male Gender. AGTvariants appeared to be in strong (𝐷 > 0.98) linkage disequilibrium (LD), suggesting the tendency of the single nucleotide polymorphisms (SNPs) to be coinherited. A small set of tag SNP would therefore be sufficient to capture the genetic information of the gene. In this study, three haplotypes inferred from rs699, rs4762, and rs5051 (CCA, TCG, and CTA) were yielded with frequencies above 5% (Table 4). Haplotype CCA (71%) was the most
Table 4: Association of haplotypes in AGT gene with diabetes in the male gender.
Haplotype Control (%) Case (%) 𝑃valuea ORb(95% CI)
CCA 0.721 0.691 0.457 0.859 (0.577–1.281)
TCG 0.117 0.202 0.012 1.917 (1.149–3.200)
CTA 0.157 0.103 0.078 0.615 (0.357–1.059)
a𝑃value was based on 100,000 permutations andbOR was calculated using
R program.
frequent followed by TCG (16%) and CTA (13%). Haplotype analysis revealed that TCG was found to be associated with T2DM (OR 1.92, 95% CI 1.15–3.20, permuted𝑃 = 0.012). Tag SNP was reported forAGTrs699.
3.3. RAS Gene-Gene Interactions. In order to understand the genetic basis of T2DM, we evaluated the interactions at the gene level. Analysis however indicated a lack of evidence for gene-gene interactions within the RAS.
3.4. AGT rs699 Variant and Association with Clinical Param-eters. We chose to explore the relationship between theAGT
[image:4.600.309.547.400.455.2]investigate whether the variant was also correlated with the levels of the parameters. We demonstrated marginal negative correlations with FBG and HbA1c (𝑃 = 0.06and𝑃 = 0.052); associations however improved when analysed in men (𝑃 = 0.04and𝑃 = 0.017). The results suggest thatAGTvariants were independently associated with T2DM.
4. Discussion
Genome-wide association study (GWAS) is a comprehensive and unbiased approach that is able to identify candidate gene markers encompassing the entire genome [13]. However, a major stumbling block to the successful execution of the GWAS is the high cost for exhaustive genotyping due to enormous number of SNPs in the entire genome. The efficiency of GWAS often rests on a set of tag SNPs that serve as proxies for the uncollected SNPs. Together with the fact that frequency of allele is often population specific, there may still be a need for candidate gene approach. In this study, we examined the association of genetic variants of the RAS with T2DM risk. Some of the variants are reported for the first time in the present study. We also examined whether there are gene-gene interactions within the RAS that can influence patient’s susceptibility to T2DM. We showed that allele frequencies of theAGTvariants were significantly different between the T2DM patients and controls, suggesting genetic predisposition to T2DM.
Among the studied genes, only AGT was shown to be associated with T2DM and this association was seen only in men. TwoAGT variants rs699 and rs4762 were associated with reduced risk of T2DM while rs5051 was associated with increased risk. Intriguingly, these three variants displayed similar linkage disequilibrium structure and the haplotype TCG was associated with increased risk of T2DM. Risk of diabetic nephropathy was previously shown to be associated with enrichment of this haplotype in the Tunisians [14]. Nev-ertheless, exhaustive search of the literatures failed to find any study that examined the haplotype association with T2DM, making the present study the first to report this haplotype association.AGTrs699-C allele was previously found to be associated with increased risk of T2DM in the Pakistani [15], despite no significant association in the Chinese [16] and recently the Japanese [17]. The Pakistani and the Japanese were not investigated by gender comparison whilst the Chi-nese demonstrated neither association in men nor women. Although these published studies and the present study shared a common study population which is of Asian descen-dent, the direction of findings was however different among studies, indicating that population-specific candidate gene study is still useful. Pakistan is one of the Asian countries reported with high prevalence of diabetes compared to the Malay, Chinese, and Japanese [18]. To date, there is only one report on the association betweenAGTrs4762 and diabetes [19]. The study examined the association of AGT rs4762 with diabetes in a post kidney transplant patients in Korea and found thatAGTrs4762 is associated with increased risk of diabetes. Interestingly, the direction of finding from the Korean also differs from us, suggesting ethnicity differences may contribute to the conflicting results. It should also be
noted that the Korean study did not compare the gender. As for AGT rs5051, to the best of our knowledge, there is no published report on the association with diabetes, and our study provides a novel report. We also failed to demonstrate any significant association between variants within theACE
andAGTR1variants.
Genetic association studies between the RAS and T2DM have not been extensively studied. Several RAS-related genes interactions including ACE Ins/Del were reported in the Chinese T2DM patients, but these associations were not seen in single locus marker except forACEIns/Del in women [16]. Nonetheless, interactions between the RAS genes were not shown in our study. A meta-analysis conducted in different Chinese ethnics revealed no significant association between
ACE Ins/Del and T2DM [20], which is supported by a Japanese study [17]. Together, these observations indicate that there are conflicting results in a small set of studies, thus pointing for the need for further investigation into this rela-tionship. In this study,AGTgene showed a modest but sig-nificant influence toward the outcome of T2DM. The mech-anisms of theAGTvariants in causing T2DM are currently unclear, but it is likely due to the impact of angiotensinogen levels. Angiotensinogen is an adipokine component of the RAS that is involved in the earlier part of the system cascade. The angiotensinogen mRNA levels are highly expressed in the visceral rather than the subcutaneous adipose tissue region [21]. Despite presenting with no biological activity, once bro-ken down to angiotensin II (AngII) via a consecutive action of renin and ACE, it can induce insulin resistance via a cross-talk mechanism between insulin and AngII signaling cascade [6]. Transitional changes of amino acid methionine to thre-onine (rs699) and threthre-onine to methithre-onine (rs4762) in the exonic regions of AGT lead to alterations of the protein func-tion thereby regulating theAGTexpression and subsequently plasma angiotensinogen levels [22]. Carriers of rs699-C allele are reported with higher serum angiotensinogen levels [23]. On the other hand, the AGT promoter variant rs5051 has been associated with anin vitroincrease inAGTexpression [24].
In this study, two main diabetic traits (FBG and HbA1c) reached significant associations with AGT genotypes. We earlier indicate that these associations were independently associated. This strongly suggests that a change in FBG and HbA1c levels attributable toAGTgenotypes has a metabolic impact on the risk of T2DM. With reference toAGTrs699, patients carrying the C-allele exhibit a trend of significant reduction in FBG and HbA1c levels. Our results also showed an association between haplotype TCG inferred fromAGT
to gain insight into this mechanism, although we note there is some evidence for association of AGT genotypes with reduced diabetic parameters.
The present study also identified two important factors that contributed to the susceptibility to T2DM, particularly male gender and waist circumference. Although we showed that the variants of theAGTwere independently associated with T2DM, the influence of these factors in T2DM warrans further discussion. Asian men are at greater risk for T2DM compared to women [10]. Unlike the Caucasians who need to be relatively big to get diabetes, the Asians develop diabetes at even lower degree of obesity [26]. Similar trend is seen when comparing with the Europeans, where both BMI and waist circumference are lower in the South Asian men but the visceral adiposity is larger [27]. The notion that one’s BMI measures one’s waist and thus indicating diabetes, however, cannot be extrapolated at the Asian level. India for example, despite having low prevalence of obesity, they have notably high rates of T2DM [28]. Our data indicate that genetic vari-ants ofAGTin men make them more predisposed to T2DM and out of the 290 patients with T2DM, only 24% were obese. There is a likelihood of 53% risk reduction of T2DM in men subjected to variation inAGTrs699 and 47% risk reduction when confounded by waist circumference. In other word, the risk of diabetes is relatively high in Asian men with greater waist circumference, and the risk is higher when presented with susceptible genetic variations. The findings suggest that male gender and waist circumference are among the important factors need to be considered when analysing data involving Asian population, and this is one of the strengths in this study.
Results from studies of complex diseases like diabetes are not easily reproducible in different set of population com-monly due to polygenic inheritance and gene-environment interactions [29]. In this study, we have eliminated the gene-gene interaction and confounding effects. Thus, our results fall within the assumption that the genetic variants of theAGT
were independently associated with T2DM. Nevertheless, the gene-environment interactions such as physical activity and diet were not investigated and thus could be a limitation of this study. This limitation has been shared by many other genetic association studies including GWAS. More impor-tantly, the GWAS has a limited success to identify new gene variants (especially those with low allele frequency) associ-ated with disease susceptibility owing to the complexity of the disease and the key element of exposure and further substan-tiated by the number of independent tests performed [30]. Another limitation is associated with relatively small sample size of the patients. The said high prevalence of T2DM among the Asians should reflect a greater number of T2DM patients in our study; however, this was not achieved. This limitation is conditioned by several factors: (i) we recruited only Malay T2DM participants; (ii) the catchment area is more populated by the Chinese; and (iii) this study includes only a cohort from one centre. Measurement of plasma angiotensinogen levels would have been useful in view of the proposed importance of AngII, a breakdown product of angiotensino-gen, in accentuating the T2DM risk in men, but these measurements have not been made. However, studies have
demonstrated that angiotensinogen levels are strongly cor-related with AGT variants [22]. Hence, further replication studies are required to confirm these findings.
5. Conclusion
Taken together, the present study provides a support on the association of genetic variants of the AGT gene with risk of T2DM. These RAS variants could serve as independent genetic predictors for the T2DM in the area of personal-ized medicine involving metabolic diseases. Further studies that include more variants of the RAS and examine the angiotensinogen and oxidative stress levels are necessary to dissect the potential role of these genetic variants as a predictive genetic marker for T2DM.
Conflict of Interests
The authors declare no conflict of interests.
Authors’ Contribution
Siew Mei Joyce-Tan and Shamsul Mohd Zain contributed equally to this project and should be considered cofirst authors.
Acknowledgments
This project was supported by the following grants: Univer-sity Malaya Research Grant RG056/09HTM, Postgraduate Research Fund PV057/2012A, and University Malaya High Impact Research Grant UM.C/625/1/HIR/MOHE/MED/05. The authors would also like to gratefully acknowledge the subjects for their participation in this study and investigators and staff of the UMMC for their assistance.
References
[1] M. J. Fowler, “Microvascular and macrovascular complications
of diabetes,”Clinical Diabetes, vol. 26, no. 2, pp. 77–82, 2008.
[2] W. T. Cade, “Diabetes-related microvascular and macrovascular
diseases in the physical therapy setting,”Physical Therapy, vol.
88, no. 11, pp. 1322–1335, 2008.
[3] D. R. Whiting, L. Guariguata, C. Weil, and J. Shaw, “IDF Diabetes Atlas: global estimates of the prevalence of diabetes for
2011 and 2030,”Diabetes Research and Clinical Practice, vol. 94,
no. 3, pp. 311–321, 2011.
[4] A. Doria, M.-E. Patti, and C. R. Kahn, “The emerging genetic
architecture of type 2 diabetes,”Cell Metabolism, vol. 8, no. 3,
pp. 186–200, 2008.
[5] R. Sladek, G. Rocheleau, J. Rung et al., “A genome-wide association study identifies novel risk loci for type 2 diabetes,”
Nature, vol. 445, no. 7130, pp. 881–885, 2007.
[6] L. A. Velloso, F. Folli, X. J. Sun, M. F. White, M. J. A. Saad, and C. R. Kahn, “Cross-talk between the insulin and angiotensin
sig-naling systems,”Proceedings of the National Academy of Sciences
of the United States of America, vol. 93, no. 22, pp. 12490–12495, 1996.
[7] A. J. Scheen, “Prevention of type 2 diabetes mellitus through
inhibition of the Renin-Angiotensin system,”Drugs, vol. 64, no.
[8] P. Wangkumhang, P. J. Shaw, K. Chaichoompu et al., “Insight into the peopling of Mainland Southeast Asia from Thai
pop-ulation genetic structure,”PLoS ONE, vol. 8, no. 11, Article ID
e79522, 2013.
[9] M. Wei, S. P. Gaskill, S. M. Haffner, and M. P. Stern, “Waist circumference as the best predictor of noninsulin dependent diabetes mellitus (NIDDM) compared to body mass index, waist/hip ratio and other anthropometric measurements in
Mexican Americans—a 7-year prospective study,” Obesity
Research, vol. 5, no. 1, pp. 16–23, 1997.
[10] Q. Qiao, G. Hu, J. Tuomilehto et al., “Age- and sex-specific prevalence of diabetes and impaired glucose regulation in 11
Asian cohorts,”Diabetes Care, vol. 26, no. 6, pp. 1770–1780, 2003.
[11] J. Logue, J. J. Walker, H. M. Colhoun et al., “Do men develop type 2 diabetes at lower body mass indices than women?”
Diabetologia, vol. 54, no. 12, pp. 3003–3006, 2011.
[12] A. Schienkiewitz, M. B. Schulze, K. Hoffmann, A. Kroke, and H. Boeing, “Body mass index history and risk of type 2 dia-betes: results from the European Prospective Investigation into
Cancer and Nutrition (EPIC)-Potsdam Study,”The American
Journal of Clinical Nutrition, vol. 84, no. 2, pp. 427–433, 2006. [13] M. A. Eberle, P. C. Ng, K. Kuhn et al., “Power to detect risk alleles
using genome-wide tag SNP panels,”PLoS Genetics, vol. 3, no.
10, Article ID e170, 2007.
[14] N. Mtiraoui, I. Ezzidi, A. Turki, M. Chaieb, T. Mahjoub, and W. Y. Almawi, “Renin-angiotensin-aldosterone system genotypes and haplotypes affect the susceptibility to nephropathy in type
2 diabetes patients,”Journal of the Renin Angiotensin Aldosterone
System, vol. 12, no. 4, pp. 572–580, 2011.
[15] R. Shaikh, S. M. Shahid, Q. Mansoor, M. Ismail, and A. Azhar, “Genetic variants of ACE (insertion/deletion) and AGT (M268T) genes in patients with diabetes and nephropathy,”
Journal of the Renin-Angiotensin-Aldosterone System, vol. 15, no. 2, pp. 124–130, 2014.
[16] J.-K. Yang, J.-B. Zhou, Z. Xin et al., “Interactions among related genes of renin-angiotensin system associated with type 2
dia-betes,”Diabetes Care, vol. 33, no. 10, pp. 2271–2273, 2010.
[17] M. Ichikawa, T. Konoshita, T. Nakaya et al., “Genetic variant of the renin-angiotensin system and prevalence of type 2 diabetes mellitus: a modest but significant effect of aldosterone synthase,”
Acta Diabetologica, vol. 51, no. 4, pp. 595–599, 2014.
[18] A. Ramachandran, C. Snehalatha, A. S. Shetty, and A. Nanditha,
“Trends in prevalence of diabetes in Asian countries,”World
Journal of Diabetes, vol. 3, no. 6, pp. 110–117, 2012.
[19] S. R. Lee, J. Y. Moon, S. H. Lee et al., “Angiotensinogen polymorphisms and post-transplantation diabetes mellitus in
Korean renal transplant subjects,”Kidney and Blood Pressure
Research, vol. 37, no. 2-3, pp. 95–102, 2013.
[20] D. Zhou, R. Ruiter, J. Zhang et al., “Angiotensin-converting enzyme I/D polymorphism is not associated with type 2
diabetes in a Chinese population,”Journal of the
Renin-Angiot-ensin-Aldosterone System, vol. 13, no. 3, pp. 372–378, 2012. [21] V. van Harmelen, M. Elizalde, P. Ariapart et al., “The
associa-tion of human adipose angiotensinogen gene expression with
abdominal fat distribution in obesity,”International Journal of
Obesity, vol. 24, no. 6, pp. 673–678, 2000.
[22] T. Nakajima, L. B. Jorde, T. Ishigami et al., “Nucleotide diversity and haplotype structure of the human angiotensinogen gene in
two populations,”The American Journal of Human Genetics, vol.
70, no. 1, pp. 108–123, 2002.
[23] X. Jeunemaitre, F. Soubrier, Y. V. Kotelevtsev et al., “Molecular
basis of human hypertension: role of angiotensinogen,”Cell, vol.
71, no. 1, pp. 169–180, 1992.
[24] I. Inoue, T. Nakajima, C. S. Williams et al., “A nucleotide substi-tution in the promoter of human angiotensinogen is associated with essential hypertension and affects basal transcription in
vitro,”The Journal of Clinical Investigation, vol. 99, no. 7, pp.
1786–1797, 1997.
[25] T. Ogihara, T. Asano, K. Ando et al., “Angiotensin II-induced insulin resistance is associated with enhanced insulin
signal-ing,”Hypertension, vol. 40, no. 6, pp. 872–879, 2002.
[26] J. C. N. Chan, V. Malik, W. Jia et al., “Diabetes in Asia:
epi-demiology, risk factors, and pathophysiology,”The Journal of the
American Medical Association, vol. 301, no. 20, pp. 2129–2140, 2009.
[27] A. D. Sniderman, R. Bhopal, D. Prabhakaran, N. Sarrafzadegan, and A. Tchernof, “Why might South Asians be so susceptible to central obesity and its atherogenic consequences? The adipose
tissue overflow hypothesis,”International Journal of
Epidemiol-ogy, vol. 36, no. 1, pp. 220–225, 2007.
[28] K.-H. Yoon, J.-H. Lee, J.-W. Kim et al., “Epidemic obesity and
type 2 diabetes in Asia,”The Lancet, vol. 368, no. 9548, pp. 1681–
1688, 2006.
[29] M. C. Cornelis and F. B. Hu, “Gene-environment interactions in the development of type 2 diabetes: recent progress and
contin-uing challenges,”Annual Review of Nutrition, vol. 32, pp. 245–
259, 2012.
[30] W. Amos, E. Driscoll, and J. I. Hoffman, “Candidate genes versus genome-wide associations: which are better for detecting
genetic susceptibility to infectious disease?”Proceedings of the
Submit your manuscripts at
http://www.hindawi.com
Stem Cells
International
Hindawi Publishing Corporationhttp://www.hindawi.com Volume 2014
Hindawi Publishing Corporation
http://www.hindawi.com Volume 2014
INFLAMMATION
Hindawi Publishing Corporation
http://www.hindawi.com Volume 2014
Behavioural
Neurology
Endocrinology
International Journal of Hindawi Publishing Corporationhttp://www.hindawi.com Volume 2014
Hindawi Publishing Corporation
http://www.hindawi.com Volume 2014
Disease Markers
Hindawi Publishing Corporation
http://www.hindawi.com Volume 2014
BioMed
Research International
Oncology
Journal of Hindawi Publishing Corporationhttp://www.hindawi.com Volume 2014
Hindawi Publishing Corporation
http://www.hindawi.com Volume 2014 Oxidative Medicine and Cellular Longevity Hindawi Publishing Corporation
http://www.hindawi.com Volume 2014
PPAR Research
The Scientific
World Journal
Hindawi Publishing Corporationhttp://www.hindawi.com Volume 2014
Immunology Research
Hindawi Publishing Corporation
http://www.hindawi.com Volume 2014
Journal of
Obesity
Journal ofHindawi Publishing Corporation
http://www.hindawi.com Volume 2014
Hindawi Publishing Corporation
http://www.hindawi.com Volume 2014
Computational and Mathematical Methods in Medicine
Ophthalmology
Journal ofHindawi Publishing Corporation
http://www.hindawi.com Volume 2014
Diabetes Research
Journal ofHindawi Publishing Corporation
http://www.hindawi.com Volume 2014
Hindawi Publishing Corporation
http://www.hindawi.com Volume 2014 Research and Treatment
AIDS
Hindawi Publishing Corporation
http://www.hindawi.com Volume 2014
Gastroenterology Research and Practice
Hindawi Publishing Corporation
http://www.hindawi.com Volume 2014
Parkinson’s
Disease
Evidence-Based Complementary and Alternative Medicine
Volume 2014 Hindawi Publishing Corporation