5
III
March 2017
Technology (IJRASET)
Breast Cancer Detection using Support Vector
Machine
M. Chithra Devi 1, S. Dhivya Bharathi2
1,2
Department of Software Engineering, Periyar Maniammai University
Abstract: Women affected by breast cancer widely all around the world. The most commonly used screening method to detect breast cancer by using Mammographic images. In this paper, watershed segmentation algorithm is used for segmentation and the support vector machine is used to detect either benign or malignant. This avoids unwanted biopsy and stress for women. Keywords: Pre-processing, Segmentation, Support vector machine, Mammogram.
I. INTRODUCTION
The diagnosis of disease is done by analysing or grading the image. To study the image pathologists identify the characteristics of tissue. Breast tumours are uncontrollable. It is more basically exist in women than in men. If the disease is detected then the grading process will performed, which deals with spreading of infected cells all over the tissue. In this paper it is motivated that detecting and classifying breast cancer accurately. Watershed segmentation method is used in imaging that helps the specialists to examine the picture for understanding abnormalities of cancer. Support vector machine classifies the findings of either benign or malignant.
A. Background Work
Researchers have been trying to develop a way to utilize electromagnetic waves to image the human body in order to detect cancer. Some years back microwave system was the possible solution. X-rays were also be used to detect breast cancer. But they caused
side effects to the breast tissues of the patients. The currently used methods is x-ray mammography, the presence of tumour is being
detected by comparing properties of cancerous and normal breast tissue. Different image processing techniques are applied for image texture classification, gland and nuclei segmentation, cell counting, cell type identification or classification to deriving quantitative measurements of disease features from histological images. It supports to automatically determine whether a disease is present within analysed samples or not. Also this research will help to decide the different grades or severity of disease if the disease is present in the sample. Computer aided histopathological study has been conducted for various cancer detection and grading applications, including prostate, breast, renal cell carcinoma, pediatric tumour neuro-blastoma and lung cancer grading [1]-[3],[5],[6]. Using different segmentation, feature extraction and classification techniques the researchers analysed histopathology images. The overall literature survey says that there are various methods are already used in medical images. They are beneficial as well as many challenges exist. Researchers used various organs like breast, prostate, follicular lymphoma, colon glands, meningioma tumour and oral mucosa. Methods such as hierarchical normalized cut, colour gradient active contour, colour texture cell Gaussian mixture model based segmentation and object graph approach were used for segmentation. Texture classification using fractal textures, classification using nonlinear quantization and support vector machine were used for classification approach [4], [7]-[11].Texture has been studied as a breast cancer risk factor independent of average breast density [12]-[17], but the results have not been adequately adjusted for breast density and other risk factors. For example, a negative significant correlation between regional skewness, fractal dimension, results cancer risk [13]. However, the regional skewness and fractal dimensions had no association with breast cancer after adjusting for other risk factors and overall breast density. One feature, lacunarity, remained significant [12].
II. PREPROCESSING
A. Localization
Technology (IJRASET)
B. Segmentation
In pre-processing, image segmentation separates objects of interest from back ground through various methods in image processing i.e., removal of unwanted particles from the image by their intensity values. It enhances the image quality to get good results. In this work Watershed algorithm is used to process segmentation. A binary image is produced by the Watershed Transform, 1(black) is assigned or watersheds, and 0 (white) assigned to regions surrounded by dams. In image processing, watershed is a transformation used to define grey scale images. It represents the brightness of each point in the image and finds the edges.
III. FEATUREEXTRACTION
Feature extraction involves reducing amount of resources required to describe large set of data. In this process if the input data of an algorithm is too large to be performed then it can be transformed into a reduced set of features. Features are extracted either at the cellular or at the tissue-level. Morphological characteristics of image are measured to find abnormality or to classify the image for different grades of disease. The cellular-level features focuses on quantifying the properties of individual cells without considering spatial dependency between them. For a single cell, the morphological, textural, fractal, and or intensity-based features can be extracted. In this work textural features are considered for further processing. Grey level histogram is used in this work to extract the features such as skewness and kurtosis. Skewness is a measure of the symmetry in a distribution. A symmetrical dataset will have a skewness equal to 0. So, a normal distribution will have a skewness of 0. Skewness essentially measures the relative size of the two tails. Kurtosis is a measure of the combined sizes of the two tails. It measures the amount of probability in the tails. The value is often compared to the kurtosis of the normal distribution, which is equal to 3. If the kurtosis is greater than 3, then the dataset has heavier tails than a normal distribution. If the kurtosis is less than 3, then the dataset has lighter tails than a normal distribution.
IV. CLASSIFICATION
In order to classify a set of data into different classes or categories, the relationship between the data and the classes into which they are classified must be well understood. It is the process of assigning pixels in the image to categorize them. Support vector machine with quadratic kernel algorithm is applied to classify the results. Support vector machine is a supervised learning methods with associated learning algorithms that analyse data used for classification [18]-[20]. This maximizes the margin between two classes. Nonlinear classifiers are implemented by applying kernel trick to maximum-margin hyper plane [9]. The resultant algorithm is similar with the exception that each dot product is substituted by a nonlinear kernel function. This permits the algorithm to adjust the maximum-margin hyper plane in an altered feature space [12].
V. EXPERIMENTALRESULTS
A. Performance Evaluation
The dataset used in this work was obtained from trusted online database Mammogram Image for Analysis Society (MIAS). A database image of 150 counts was called for training and testing the detection as well as classification processes. The sample of each dataset is divided into 75 percentage of training and 100 percentage of testing categories. The support vector machine classifier is trained with the training data set. During testing each testing image is compared with the trained images and classified. To evaluate the performance of the proposed approach using evaluation metrics such as sensitivity, specificity and accuracy are computed using the following equations 1, 2 and 3.
Sensitivity % = x 100 (1)
Specificity % = x 100 (2)
Accuracy % = x 100 (3)
Where, TP True Positive, TN True Negative, FP False Positive , FN False Negative, N Number of inputs. The textural features such as gray level, contrast, homogeneity, correlation and energy are also calculated from the grey level histogram. The features such as skewness and kurtosis are obtained by using the equation 4 and 5.
Skewness =
( )( )∑ ( ̅)
=
( )( ) (4)
Kurtosis = ( )
( )( )( )∑ ( ̅)
}− ( )
( )( ) (5)
Technology (IJRASET)
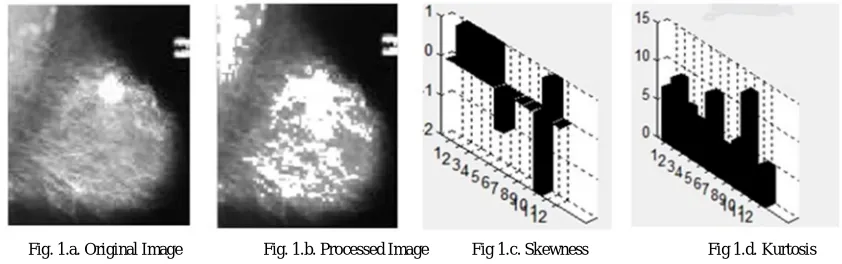
Fig. 1.a. Original Image Fig. 1.b. Processed Image Fig 1.c. Skewness Fig 1.d. Kurtosis
The Fig. 1.a. represents the original mammography image and the processed image is shown in Fig. 1.b. The skewness value and kurtosis value are represented in image Fig 1.c. and Fig 1.d. respectively. The resultant values are passed as input for two class support vector machine. The quadratic kernel function of support vector machine is given in equation 6.
(6)
Where k is the kernel, x and y are input vectors derived from input space. The power of the polynomial used in this case is equal to two. It is very much suitable to construct non trivial function. If the feature points are nonlinear then this quadratic kernel has applied to separate the feature points. In this work, the experimental work results 87 percentage of accuracy.
VI. CONCLUSIONS
Early detection of breast cancer is most important, since localized cancer can only be cured. Mammogram Image for Analysis Society dataset is used for this work. To detect the breast cancer earlier, pre-processing is presented with Hough transform and Watershed segmentation algorithm. The classification of support vector machine with quadratic kernel algorithm results better performance of 87 percentage of accuracy.
REFERENCES
[1] Hui Kong, Metin Gurcan, and Kamel Belkacem-Boussaid, “Partitioning Histopathological Images: An Integrated Framework for Supervised
Color-Texture Segmentation and Cell Splitting”, IEEE Transactions On Medical Imaging, Vol. 30, No. 9, pp. 1661-77, September 2011.
[2] M.Murat Dundar, Sunil Badve, Gokhan Bilgin, Vikas Raykar, Rohit Jain, Olcay Sertel, and N.Metin “Computerized Classification of Intraductal Breast
Lesions Using Histopathological Images”, IEEE Transactions On Biomedical Engineering, Vol. 58, No. 7, pp. 1977-84 , July 2011.
[3] Akif Burak Tosun and Cigdem Gunduz-demir, “Graph Run-length Matrices For Histopathological Image Segmentation”, IEEE Transactions On
Medical Imaging, Vol. 30, No. 3, pp. 721-31, March 2011.
[4] M.Muthu Rama Krishnan, Mousumi Pal, Suneel K Bomminayuni, Chandan Chakraborty, Ranjan Rashmi Paul and Ajoy K Roy, “Automated
classification of cells in sub-epithelial connective tissue of oral sub-mucous fibrosis – An SVM based approach”, Computers in Biology & Medicine, pp. 1096-1104, 2009.
[5] Jun Xu, Andrew Janowczyk, Sharat Chandran and Anant Madabhushi, “A Weighted Mean Shift, Normalized Cuts Initialized Color Gradient Based
Geodesic Active Contour Model: Applications to Histopathology Image Segmentation”, Medical Imaging , Proceedings of SPIE , Vol. 7623, 76230Y, doi: 10.1117/12.845602, 2010.
[6] Cigdem Gunduz-Demir, Melih Kandemir, Akif Burak Tosun and Cenk Sokmensuer, “Automatic segmentation of colon glands using object-graphs”,
Medical Image Analysis, Vol.14, pp.1-12, 2010.
[7] Omar S. Al-Kadi, “Texture measures combination for improved meningioma classification of histopathological images”, Pattern Recognition , Vol. 43,
pp.2043-2053 , 2010.
[8] Pelin Gorgel, Ahmet Sertbas, Niyazi Kilic, Osman N.Ucan,and Onur Osman, “Mammographic mass classification usingwavelet based Support Vector
Machine”, Journal of Electrical &Electronics Engineering, Vol.9, No.1, pp.867-875, 2009.
[9] E.Tian-Tian Chang, Jun Feng, Hong-Wei Liu, and H.IP, “Clustered microcalcification detection based on a multiple kernel Support Vector Machine with
Grouped Features (GF-SVM)”, Pattern Recogntion, ISSN:978-1-4244-2175 Vol. 6/08, IEEE, pp.1-4, 2008.
[10] J.Dheeba and S.Tamil Selvi, “An improved decision support system for detection of lesions in mammograms using differential evolution optimized wavelet
neural network”, J Med Syst , Vol.36, No.5, pp.3223–3232, 2012.
[11] El-Naqa, Y.Yang, M.Wernick, N.Galatsanos, and R.Nishikawa, “Support vector machine learning for detection of micro calcifications in mammograms”,
Technology (IJRASET)
Journal Design, Anal. Tools circuits and system, Vol.1, pp. 1-8, 2011.
[13] JW.Byng, M.Yaffe, GA.Lockwood, LE.Little, DL.Tritchler, NF.Boyd, “Automated analysis of mammographic densities and breast carcinoma risk” Cancer.
Vol. 80(1), pp.66–74, 1997.
[14] J.Byng, N.Boyd, E.Fishell, R.Jong, M.Yaffe, “Automated analysis of mammographic densities”, Phys Med Biol. Vol.41(5):909, 1996;
[15] C.Castella, K.Kinkel, MP.Eckstein, PE.Sottas, FR.Verdun, FO.Bochud, Semiautomatic mammographic parenchymal patterns classification using multiple
statistical features. Acad Radio, Vol. 14(12) pp.1486–9, 2007.
[16] ME.Mavroforakis, HV. Georgiou, N.Dimitropoulos, D.Cavouras, S.Theodoridis, “Mammographic masses characterization based on localized texture and
dataset fractal analysis using linear, neural and support vector machine classifiers”, Artificial Intelligence Med. Vol. 37(2), pp.45–62, 2006.
[17] AE.Burgess, “Mammographic structure: Data preparation and spatial statistics analysis”, In Medical Imaging'99. Bellingham: International Society for Optics
and Photonics, pp. 642–653, 1999.
[18] C.J.C. Burges “A tutorial on support vector machines for pattern recognition”, Data mining knowledge Discovery, Vol.2, pp.121-167, 1998.
[19] C.Cortes and V Vapnik, “Support Vector Networks”, Machine Learning, Vol.20, pp.273-29, 1995.
[20] M.A.Aizerman, E.M.Braverman, L.I.Rozonoer, “Theoretical foundations of the potential functions method in pattern recognition”, Automation of Remote