Identification, Delineation and Mapping of Micro
Watershed of Kaneri
Shweta Ramchandra Nale1
1Rural Technology Department, Yashwantrao Chavan School of Rural Development, Shivaji University, Kolhapur
Abstract: Water is most important part of our life. Now a days almost in all parts of Maharashtra people are suffering from water scarcity. To overcome this problem water conservation and management is the only solution. Delineation is one of the important part of this management and conservation process. Also as consider to mapping, we have all type of maps at district level but not at micro (goan) level. But using GIS software we can prepare all type of maps at micro level.
Keywords: Delineation, Mapping, QGIS System, Management, Watershed, Raster-Vector Data, DEM
I. INTRODUCTION
Water one of the dynamic resource of life on the earth is becoming a rare commodity because of many reasons. Due to rapid increase in population, growth in agricultural doings, rapid growth in urban and industrial areas demand for water is increasing day by day causing shortage for water. The situation degrades more due to improper exploitation and scrupulous management. Almost all water from surface and ground is being polluted due to disposal of human waste and industrial effluents. There is moderate rainfall in western Maharashtra so in summer can face shortage of water in some areas. Therefore it is important to study this crucial problem and fix it. These problems can be study by Identification Delineation and Mapping of Watershed. So for project work we have selected area of Kolhapur region of western Maharashtra. While studying water resource issues huge area enclosed by the Maharashtra can become a problem as in western area of Maharashtra gets plentiful rain while eastern areas are nearly dry. There are not enough water supplies in some areas even during normal rainfall periods. During drought this shortage of water is exaggerated to the point that essential needs may be threatened. So there is need of extensive planning for present and future water demands. The requirement of complex management tools to identify, assess, and resolve these water resource problem turn out to be most important by considering the effects of growth in population as well as new and emerging environmental issues.
II. LITERATURESURVEY
P. Venkatachalam [1] provided a technique for automatic delineation of watershed and drainage from DEM. He also discussed steps for delineation of watershed with pre-processing of digital elevation data. AndreeaZamfir[2] presented the Oltet watershed without manually processing of topographic map sheet. They have used open source and commercial solutions i.e. commercial software ArcGIS Desktop 9.3 and GRASS plugin of the open source software Quantum GIS 1.7.0 Wroclaw. For hydrological analysis input data required by GIS solutions is digital model (DEM). David G. Tarboton [3] demonstrated step by step execution for using major functionality available in the Arc Hydro tools for Raster Analysis. They have performed drainage analysis on a terrain model for Reynolds Creek. Several data sets are derived using Arc Hydro tools which gives drainage patterns of the catchment. To produce data on flow accumulation, stream segmentation, flow direction, stream definition and watershed delineation Raster analysis is done. The data produced are used for developing vector representation of drainage lines and catchments from selected point. By applying data, attributes are developed which are used to establish usefulness of Arc Hydro tool which help in hydrologic modelling. Important functionality and features have been exposed both in raster and vector environments. Dean Djokic [4]] explained how Watershed delineation is one of the most commonly performed activities in hydrologic and environmental analyses. Digital elevation models (DEM) provide good terrain representation from which the watersheds can be derived automatically using GIS technology. The paper gives idea about methodology for DEM pre-processing which delivers the basis for fast (sub-minute) consistent watershed delineation on DEMs of any resolution and size with the help of desktop GIS technology which is referred as Fast Watershed Delineation method (FWD).
square grid over the area and attributing point elevation data to the nodes. The elevation data have been referenced from Google Earth application which has a vertical resolution of 1 m. The accuracy of elevation information has been checked by tallying with the benchmarks in the Survey of India (SOI) topographical map (1:50,000 scale) and it has been found that RLs (reduced level) of the points in the map matches exactly with Google earth data . Fortunately, Google Earth Inc. provides elevation values at 1 m. vertical resolution. This data has been manually attributed to the nodes of the square grid. This procedure will be cumbersome for large watershed areas since huge number of point elevations will be needed but this is useful when small areas, as in our case, are encountered.
D. D. Konadu[7] used Geographical Information Systems (GIS) and Digital Elevation Models (DEM) to perform many geospatial
and hydrological modelling including drainage and watershed delineation, flood prediction and physical development studies of urban and rural settlements. In this study they have explores the use of contour data and planimetric features extracted from topographic maps to derive digital elevation models (DEMs) for watershed delineation and flood impact analysis (for emergency preparedness) of part of Accra, Ghana in a GIS environment. Shubhas Chavre [8] The study of the relief structure is for the analysis slope, watershed delineation, drainage pattern analysis, and soil formation study. The rainfall runoff and soil erosion also analyzed from the slope analysis. The river is flow towards the slope. In the hilly area drainage density and bifurcation ration is high due to slope and this indicates the flood condition. The slope is more steep means runoff is more and the percolation rate of water is to low and its leads to soil erosion. SRTM data and GIS techniques are helpful to analyze the slope and aspect of that area and we can do the proper measurement for reducing the soil erosion problem .The main objective of the present study is to analyze the relief of the Kolhapur district using SRTM data and GIS techniques. The elevation model derived from Shuttle Radar Topography Mission (SRTM) data is used for the relief analysis.Relief visualization study is important for the analysis of slope of particular area. In the present study the slope of Kolhapur district is steep in western side and gentle towards the eastern side and from the slope analysis we can identify the drainage pattern of the area and watershed boundaries.
III.DELINEATIONANDMAPPING
A. Gis System And Data Description
As Digital data and GIS are very useful tools in this thesis some features and advantages of GIS are explained below:
1) Geographic Information Systems: Before going to data usage in this thesis it is necessary to understand use of GIS and other tools used for data manipulation. Over past decade use of GIS has grown intensively in government, academic institutions and business for various applications. Accordingly various definitions have been developed for GIS though the most accepted definition is stated by Association for Geographic Information as “A system for capturing, storing, checking, integrating, manipulating, analysing and displaying data which are spatially referenced to the earth”. From definition we come to know GIS is not just a computer system for making maps but is an analytical tool.
The key advantage of GIS is that is gives spatial relationships among map features (ESRI, 1997) which is very important ability For Water Availability Modelling research plan. Relationship between different features can be established by overlapping maps of river networks, water rights and river basins. For example Which water right fell on river reach and in which Basin, and which water rights are upstream and downstream of the current one can be mapped using GIS which previously done by manual interpretation. Connecting spatial data with geographic information about a particular feature on a map is another significant feature of GIS.Every feature in a GIS map is connected to a set of attributes that is stored in a database (ESRI, 1997). So any individual can get information about map feature by just giving query of feature.ARC/INFO GIS and Arc View GIS are the programs used for performing the queries. Both programs are developed by Environmental Systems Research Institute (ESRI). ARC/INFO uses a command language that functions similarly to the way a computer’s operating system works: commands are entered at a prompt before different tasks (ESRI, 1997). However, Arc View is a much more visual medium for working with maps in which commands are executed through menu option.
graphical output is very similar to hand-drawn maps (Foote, 1996). An example of vector data is the EPA’s river reach file. The following figure is a comparison of vector and raster data.
Figure1: Comparison of features in raster and vector format (Maidment, 1998)
Following this brief description of GIS, the next step is to take a look at the data that were used in building the water rights database.
B. Data Description
Many different types of data are required for a project that will eventually provide information on the entire state of Texas. Therefore, it is important to take a look at each data set in detail. The following is a list of the data sets to be discussed in this section: Digital Elevation Models, Environmental Protection Agency River Reach Files (Version 3.0), Water Right Locations, Digital Raster Graphics, Precipitation Grids, and Curve Number Grids
1) Digital Elevation Models: One of the most important data sets needed for drainage area calculations is an accurate representation of the land surface. In a GIS framework, a Digital Elevation Model (DEM) contains such information. A DEM consists of a sampled array of elevations for ground positions that are normally at regularly spaced intervals, as shown in Figure.2
Figure 2: Sample representation of a DEM (Maidment, 1998)
In the early stages of this project, the best available data sets were 90-meter DEMs (3 by 3-arc second spacing), which contained elevation values at approximately 90-meter intervals (USGS, 1996). However, during the course of the work, the National Elevation Dataset (NED) was made available for the state of Texas. The NED files (or 30-meter DEMs) are DEMs with grid cells of 1 by 1-arc-second spacing or elevation values at 30-meter intervals. The next section discusses these two data sets in detail.
Figure 3.Image of DEM elevations overlain on topographic contours (Maidment, 1998)
Manual and automated correlation techniques are used to collect elevation data from photographic sources. First, the elevations along a profile are collected at 80 to 100 percent of the eventual point spacing. Then, the raw elevations are weighted with additional information during the interpolation process in which final elevations are determined for the required matrix form and interval spacing (USGS, 1996).The elevation data for the 3 arc-second DEM are referenced horizontally on the geographic (latitude/longitude) coordinate system of the World Geodetic System 1972 (WGS 72) and are referenced vertically in meters relative to the National Geodetic Vertical Datum of 1929 (NGVD 29). The data are approximately equivalent to that which can be derived from contour information represented on 1:250,000 scale maps (USGS, 1996). Each file contains 1201 rows and columns or approximately 1.4 million cells and takes 6.91 MB of memory with elevations in floating point meters. The river basins covered by this study require 4-6 one-degree blocks to cover them. Typical grid sizes for the river basins were 10 million cells.
3.(30) Meter DEM: The NED is a new raster product assembled by the USGS and has a resolution of 1 arc-second (approximately 30 meters) for the conterminous United States. The NED is designed to provide national elevation data in a seamless form with a consistent datum, elevation unit, and projection (USGS, 1999).Building a seamless elevation database involved a complex system for performing the conversion and transformation of over 50,000 DEM files. Once all the DEMs in the National Digital Cartographic Database were identified, the system accomplished the following: filtered production artefacts, computed datum conversions, appended individual DEM files, computed coordinate transformations, resample data; merged the various sources, and performed edge matching between each separate DEM file. As with the 90-meter DEM, the files were stored in 1-degree by 1-degree blocks (USGS, 1999). Each file in this dataset contains 3600 rows and columns or approximately 12.9 million cells and takes 52.8 MB of memory with elevations in floating point meters. Typical 30-meter grid sizes for the river basins were 60million cells. Unlike the previous 30-meter DEM sources, the final NED product has universal data characteristics. In the NED assembly process, the elevation values were converted to decimal meters as a consistent unit of measure; North American Datum 1983 was consistently used as the horizontal datum; and all the data were recast into a geographic projection, whereas the earlier 30-meter DEMs were in UTM projection (USGS, 1999).
4. DEM Accuracy: The main factors that determine the accuracy of a DEM are the source resolution and the spatial resolution (or grid spacing) of the data profiles. Since a dependency exists between the scale of the source materials and the level of grid refinement possible, the source resolution determines the level of content that may be extracted during digitization. Within a standard DEM, most terrain features are generalized by being reduced to grid nodes spaced at regular intersections in the horizontal plane. This generalization reduces the ability of the DEM to represent positions of specific features smaller than the internal spacing of the nodes and results in a “smoothing” of the surface during gridding (USGS, 1996). Therefore, the assumption is that higher resolution data (i.e. smaller grid spacing) more accurately represents the drainage features of the terrain and results in more accurate watershed delineations.
C. Procedure
1) Procedure of creating contours: Step 1. Select the Raster menu, and hover the mouse cursor to Extraction tool set and select the Contour tools to open the contour window.
Step 2. In the contour window, For Input file (raster) select SRTM Kolhapur from the drop down menu
Step 4.For Interval between contour lines key in as 50 and check the Attribute name and leave the name as default i.e ELEV. Step 5.Set the option for Load into canvas when finished, Once done click on OK button to run the contour function.
Step 6.Close the contour window to view the newly created contours, drag and drop the Contours_50 to the Top in the Table of contents.
Step 7.Display the Labels for contours using the ELEV field.
Step 8.Using the Label toolbar display the labels for the contours with ELEV as field.
[image:6.612.184.432.167.341.2]Step 9.Select the Contours_50 layer in the Table of contents and click on the Label tool to open the Layer Labeling Settings
Figure 4. Contour Map of Kaneri
2. Procedure of creating slope:
Step 1.Slope identifies the steepest downhill slope for a location on a surface.
Step 2.The Slope command takes an input surface raster and calculates an output raster containing the slope at each cell.
Step 3.Lower the slope value, the flatter the terrain; the higher the slope value, the steeper the terrain. The output slope raster can be calculated as percent slope or degree of slope.
Figure 5.Slope identification
Step 4.Open the GRASS Tools and under Modules list, Type r.slope and select it, For “Name of the elevation raster map” Select DEM from the drop down menu.
Step5. Name the ouput slope raster map as DEM_Slope and click on the advanced options and make sure that percent has been selected and Run the slope module.
[image:6.612.171.444.436.622.2]Figure 6. Slope Map of Kaneri
3. Procedure of delineation of kaneri watershed
Step 1. Preparation of raster image.
Step 2. Obtaining raster image of maharastra from srtm data.
Step 3. As the area of kaneri is very small as compared to the area of Maharashtra.
Step 4. So for obtaining the raster image of kaneri a boundry of kaneri is plotted and a buffer of 10m is drawn around the boundry of kaneri.
Step 5. This buffer is divided by grids of equal intervals.
Step 6At every intersection of grid elevations are plotted using a plugin called “ELEVATION” from QGIS. Step 7. From this elevation raster image of kaneri is obtained.
Step 8. Adding raster image of kaneri to QGIS. The name of this is “Kaneri_raster_final”. Step 9. Now using Grass Tool creating new map set.
Step 10. Creating contour maps,slope maps, aspect, hillshade etc
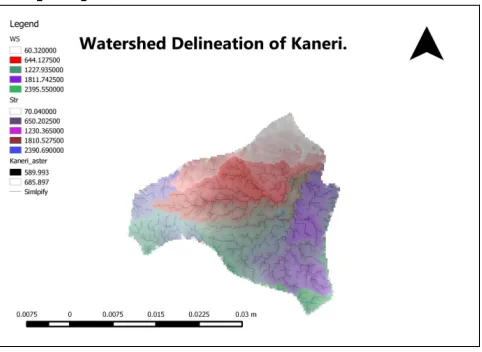
Figure 7. Watershed Delineation of Kaneri
4. Mapping of Kaneri Watershed.
For mapping of Kaneri watershed we need the shape file of line polygon and point. Step 1. Creating new shape file.
Step 2. Save the new shape files.
[image:7.612.187.428.432.608.2]Step 6. On the digitization tool bar click on capture polygon tool for creating polygon and continue this process until start point. Step 7. Once we reach the start point of polygon simply right clicks using the mouse to complete the polygon.
Step 8. For attribute fill in the following information and click ok. Step 9. Then polygon as a boundary map kaneri obtained. Step 10. Once done save the edits by clicking on save edit tool. Step 11. Similarly we can show the plots by the above procedure.
Step 12. Now switch of the boundary and plot layer and on the well layer and similarly we can show wells on the map. Step 13. By using snapping option we can define the parameters of the map.
Step 14. Once done click on the save menu from toggle editing.
IV.CONCLUSION
Delineation & mapping of Kaneri Micro watershed with GIS is done in this project. Watershed delineation will give watershed boundary for that particular stream. The results obtained from watershed delineation have wider application for watershed management with the help of structures like farm pond, contour trench, bore wells. Wells gully plugging & terrace farming. Due to watershed management in Kaneri there is big change in crop production & hence farmers of that village have economical benefits.
V. ACKNOWLEDGEMENT
I present my thesis on “Identification Delineation and Mapping of Micro Watershed of Kaneri.”I would like to express our deep sense of gratitude to our guide Dr. G. S. Kulkarni for his valuable guidance, encouragement and kind co-operation throughout the dissertation work. I feel glad to present my research work under his guidance, also for providing all necessary facilities to carry out this thesis work and whose encouraging part has been a perpetual source of inspiration. I am also thankful to Mr. M. S. Salunkhe and Mr. S. B. Desai for their encouragement and support. I am deeply indebted to Mrs. V.A.Swami, Associate Professor, KIT’s College of Engineering, Kolhapur. She has always encouraged me to pursue my ideas, offered innumerable creative insights and guided me with whole hearted efforts. Her stimulating suggestions and back-up helped me throughout the project work. It would not have been possible for me to complete this project without her encouragement, guidance and cooperation.
REFERENCES
[1] P. Venkatachalam B .Krishna Mohan. Amit Kotwal.Vikas Mishra Mayur Pandya (2001), “Automatic Delineation of Watershed for Hydrologic Application.” [2] Andreea Zamfir, Daniel Simulescu (2011),“Automatic Delineation of A Watershed Using A DEM. Case Study – The Oltet Watershed, Watershed Delineation
from Digital Elevation Models.”
[3] David G. Tarboton (2011),”Watershed Delineation from Digital Elevation Models”
[4] Dean Djokic and Zichuan Ye Esri Redlands, California (2000), “DEM Pre-Processing for Efficient Watershed Delineation.” [5] Mudher N. Abdulla (2011),“Catchment Area Delineation Using GIS Technique for Bekhma Dam.
[6] Amitava Saha (2010), “Channel Network Delineation and Catchment Area Demarcation of Ponds.”