R E S E A R C H
Open Access
Single-cell transcriptomics unveils gene
regulatory network plasticity
Giovanni Iacono
1*, Ramon Massoni-Badosa
1and Holger Heyn
1,2*Abstract
Background:Single-cell RNA sequencing (scRNA-seq) plays a pivotal role in our understanding of cellular
heterogeneity. Current analytical workflows are driven by categorizing principles that consider cells as individual entities and classify them into complex taxonomies.
Results:We devise a conceptually different computational framework based on a holistic view, where single-cell datasets are used to infer global, large-scale regulatory networks. We develop correlation metrics that are specifically tailored to single-cell data, and then generate, validate, and interpret single-cell-derived regulatory networks from organs and perturbed systems, such as diabetes and Alzheimer’s disease. Using tools from graph theory, we compute an unbiased quantification of a gene’s biological relevance and accurately pinpoint key players in organ function and drivers of diseases. Conclusions:Our approach detects multiple latent regulatory changes that are invisible to single-cell workflows based on clustering or differential expression analysis, significantly broadening the biological insights that can be obtained with this leading technology.
Background
Single-cell RNA sequencing (scRNA-seq) is the leading technology for exploring tissue heterogeneity, unraveling the dynamics of differentiation, and quantifying transcrip-tional stochasticity. scRNA-seq data are being used to an-swer increasingly demanding biological questions, which has driven the development in recent years of an array of computational tools for scRNA-seq analysis [1]. Currently, these tools focus on improving features such as clustering, retrieving marker genes, and exploring differentiation tra-jectories [1]. These scenarios are inspired by a dividing, fragmenting principle, where each cell is an independent identity that must be categorized into different types or stages of increasing hierarchical complexity. This is illus-trated by recent large-scale cell atlases that often reach hundreds of stratified (sub)clusters [2]. This has undoubt-edly improved our understanding of cell diversity in vari-ous biological contexts. However, we hypothesize that a very different approach, inspired by a unifying rather than dividing ideal, would add a novel layer of information that
would significantly increase the knowledge gained from single-cell datasets.
Gene expression is tightly regulated by networks of tran-scription factors, co-factors, and signaling molecules. Un-derstanding these networks is a major goal in modern computational biology, as it will allow us to pinpoint crucial factors that determine phenotype in healthy systems as well as in disease [3,4]. Unraveling the determinants of a given phenotype provides mechanistic insights into causal de-pendencies in complex cellular systems. Potentially, single-cell information offers the opportunity to derive a global regulatory network [5]. Traditional approaches to transcriptome profiling, namely microarray and RNA-seq of pooled cells, have been successfully used to infer and characterize regulatory networks, with a recent example using 9435 bulk RNA-seq samples to decode tissue-specific regulatory networks [6]. To date, there are only small-scale efforts to derive regulatory networks from single-cell tran-scriptomics data, and these efforts have been restricted to specific network properties [7, 8]. This seems unexpected given that single-cell sequencing is the ideal technology for monitoring real interactions between genes in individual cells. However, single-cell data is undermined by a series of technical limitations, such as drop-out events (expressed
© The Author(s). 2019Open AccessThis article is distributed under the terms of the Creative Commons Attribution 4.0 International License (http://creativecommons.org/licenses/by/4.0/), which permits unrestricted use, distribution, and reproduction in any medium, provided you give appropriate credit to the original author(s) and the source, provide a link to the Creative Commons license, and indicate if changes were made. The Creative Commons Public Domain Dedication waiver (http://creativecommons.org/publicdomain/zero/1.0/) applies to the data made available in this article, unless otherwise stated. * Correspondence:giovanni.iacono@cnag.crg.eu;holger.heyn@cnag.crg.eu
1CNAG-CRG, Centre for Genomic Regulation (CRG), The Barcelona Institute of
genes undetected by scRNA-seq) and a high level of noise, which have made it difficult to infer regulatory networks using this type of data [9].
In this paper, we demonstrate the feasibility and value of regulatory network analysis using scRNA-seq datasets. We present a novel correlation metric that can detect gene-to-gene correlations that are otherwise hidden by technical limitations. We apply this new metric to gener-ate global, large-scale regulatory networks for 11 mouse organs [10], for pancreas tissue from healthy individuals and patients with type 2 diabetes [11], and for a mouse model of Alzheimer’s disease [12]. We then validate the resulting networks at multiple levels to confirm the reli-ability of the reconstruction. Next, we analyze the net-works using tools borrowed from graph theory, such as node centralities and dynamical properties. Finally, we integrate network-driven results with standard analyses such as clustering and differential expression analysis and show that key regulators of healthy and diseased systems can only be identified by using integrated, network-based approaches. Together, our results repre-sent the first complete, validated, high-throughput, and disease-centered application of single-cell regulatory
network analysis, significantly increasing the knowledge gained from this leading technology.
Results
Inferring regulatory networks from large-scale single-cell transcriptomics
We initially set out to develop a reliable approach for in-ferring global regulatory networks from single-cell data (Fig. 1). To generate a regulatory network starting from expression data, we require a robust measure of correl-ation between genes. Unlike in RNA-seq from pools of cells (bulk), single-cell data is inherently noisy and highly sparse, which prevents the effective use of standard coeffi-cients such as Pearson, Spearman, orCosinecorrelation, or evenmutual information. Hence, we conceived a novel correlation measure based on a computational framework tailored to analyze single-cell data, with the rationale that two correlated genes follow similar patterns of differential expression between cell sub-types (see the“Methods” sec-tion). Therefore, instead of searching for relationships using the original variables, namely (normalized) expres-sion counts, we compute the correlations between trans-formed variables, in which expression counts are replaced
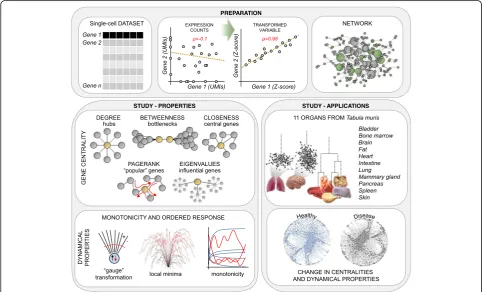
Fig. 1Overview of the computational framework. Preparation: A change of variable (from expression values toZ-score) is used to detect otherwise hidden correlations between genes in single-cell datasets, ultimately allowing us to infer the global regulatory network. Gene centrality: Biological importance of genes is quantified using concepts from graph theory. Dynamical properties: We characterize the putative dynamical behavior of the regulatory networks by measuring the monotonicity. Applications: We generated, compared, and characterized the networks of 11 organs in the mouse (Tabula Muris), in the pancreas from healthy and type 2 diabetes human subjects, and in a mouse model of
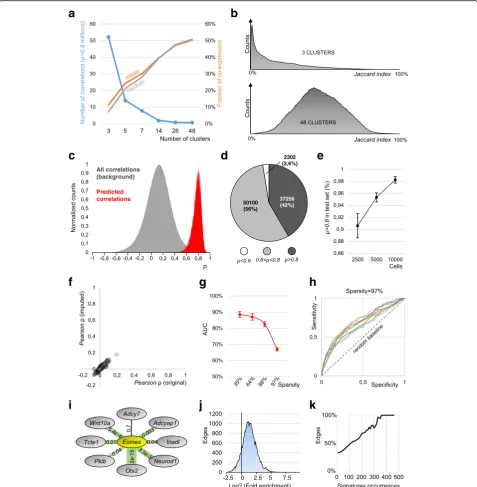
[image:2.595.56.540.371.663.2]byZ-scores. TheseZ-scores are derived from an unsuper-vised analysis based on iterative differential expression (DE) between small clusters of cells. To computeZ-scores, we exploit a probabilistic model of the noise that considers all sources of variability in single-cell data. Thereby, this ap-proach can detect correlations that would otherwise be concealed by drop-out events and other technical artifacts and, thus, is particularly suitable for single-cell RNA-seq data. When applied to a dataset of 7697 microglia cells [12], we identified 933,936 significant gene-to-gene correla-tions (Pearson> 0.8), a gain of almost 40,000-fold compared to normalized UMI count data (only 24 correlations, Fig.2a). This large increase in the number of detected cor-relations is supported by a different distribution in the
Z-score space compared to the UMIs/reads space (Fig.2a). Drop-out events can entirely obscure correlations, when genes, although being co-expressed in the same cell type (i.e., cluster), experience mutually exclusive drop-outs (Fig.2b). When applied to seven additional datasets gener-ated using different scRNA-seq techniques (Fluidigm C1,
10x Genomics Chromium, MARS-seq, Smart-seq2), with different sequencing depths and from different tissue sources [10,13,14], theZ-score metric consistently outper-formed standard approaches, suggesting that it is a valid correlation metric for scRNA-seq data (Fig.2c).
After identifying gene-to-gene correlations, an adaptive threshold is applied to retain only significant correlations (see the “Methods” section). This adaptivity equalizes the effects of different cell numbers and coverage, and other technical features of scRNA-seq datasets. The retained correlations then become the weighted edges of the regu-latory network, with either positive or negative signs. In the final step, gene ontology (GO) information is used to subset the network to“regulators of gene expression,” in order to retain only putative causal (regulatory) relation-ships (Fig.2d). Note that using external information (e.g., GO) is an established method for refining networks [15– 17]. To determine the importance of a given gene in a single-cell regulatory network and its underlying biological system, we applied analytical tools from the field of graph
a
b
c
d
Fig. 2A metric tailored to single-cell data allows detection of hidden correlations.aDistribution ofPearsoncorrelationsρpin normalized
expression data (7697 microglia cells) or in theZ-score space. We detect only 24 correlations |ρp| > 0.8 in the first scenario, but almost one million
|ρp| > 0.8 in theZ-score space.bExamples of correlations using either expression values orZ-score-transformed data (ρpPearson,ρcCosine,ρs Spearman). Due to drop-out events and other artifacts, the positive correlation betweenMmp25andAnkrd22is only exposed usingZ-scores. Similarly for the negative correlation betweenSamd9landCx3cr1.cComparison of detected correlations |ρp| > 0.8 using either original expression
[image:3.595.56.540.343.642.2]theory. These tools allow us to quantify the biological rele-vance of a gene using various measures of centrality, namely degree, betweenness, closeness, pagerank, and ei-genvalues (Fig. 1). For example, genes with a high be-tweennesscentrality are crucial for the flow of information between network modules (bottlenecks), genes with a high
closeness can rapidly spread a signal across the network, and genes with a higheigenvalueare highly influential (see the“Methods”section).
Benchmarking inferred correlations
The inferred correlations were linearly proportional to the correlations computed over the average gene expression per cluster, confirming that the approach is not introdu-cing global biases nor artifacts (Additional file 1: Figure S1a). The quality of the inferred correlations critically de-pends on the number of clusters: a tradeoff between sensi-tivity and specificity. Partitioning cells in few, large clusters allows a sensitive DE analysis, however, with re-duced specificity. For example, partitioning 3005 brain cells [14] in three clusters detected 52 million correlations (ρ> 0.8, Fig. 3a). However, the median co-expression of correlated gene pairs was only 7% (Jaccard index), indicat-ing that most of the correlated genes are not expressed in the same cell (Fig.3a, b). As three clusters are not suffi-cient to segregate sub-types, cells with different pheno-types enter the same cluster and generate false-positive correlations. Importantly, our approach applies a recursive clustering that maximizes the number of biologically in-formative clusters, increases the quality of correlations, and preserves sensitivity (see the “Methods” section). Ex-emplarily, recursive clustering divides the 3005 brain cells into 48 clusters, increasing the average co-expression to 51% (Fig.3a, b). Of note, drop-out events impede the de-tection of a complete co-expression of 100%.
Next, we quantified the false discovery rate (FDR) of the inferred correlations using the 3005 brain cells and random cluster assignment as the null model. Any correlation found with the random clustering must be false positive, originated from an uncon-trolled sensitivity in the DE analysis and subsequent
Z-score-based correlation. We applied a reshuffling of
the 48 clusters to generate random assignments with-out altering the distribution of cluster sizes. We ob-served an average FDR of 0.062 ± 0.012%, indicating that the approach has a low detection of false-positive events (S.E.M., 5 independent repetitions of random clusters; Additional file 1: Figure S1b).
We then tested if the approach was a robust predictor of correlations. To this end, we randomly sampled two non-overlapping groups of 5000 cells from the 1.3 mil-lion dataset of mouse brain cells [18], to quantify the ex-tent to which correlations inferred from a training set (group 1) can predict correlations in a test set (group 2).
Correlating genes in the training set were very likely to be correlated in the testing dataset, as illustrated by a clear distribution shift compared to the background
(ap-proximate p value < 1e−31128, Wilcoxon signed-rank
test; Fig. 3c). Specifically, 42% (97.6%) of correlations found in the training set (ρ> 0.8) revealed correlations of ρ> 0.8 (ρ> 0.6) in the test set (Fig.3d). We repeated this simulation for smaller (2500 cells) and larger (10,000 cells) datasets, consistently determining the in-ferred correlations as valid predictor (Fig. 3e). Overall, these results indicate that our inferred correlations are reproducible, with datasets of similar type (e.g., bio-logical replicates) yielding similar correlations. Import-antly, the robustness of the prediction increased with the dataset size, suggesting that the approach efficiently exploited higher cell numbers to infer more robust cor-relations. This is particularly important considering the trend towards very large datasets in single-cell tran-scriptomics studies [19].
Imputation is utilized in single-cell dataset to replace drop-out events with non-zero estimates of predicted ex-pression values. We assessed if imputation improves cor-relation coefficients of transcript count data and therefore constitutes a viable alternative to the here pre-sented approach. We applied scImpute [20], a widely
used and benchmarked imputation tool [21, 22], on
8333 microglia cells [12], an extremely sparse and chal-lenging dataset (6.1% non-zero values after filtering for expressed genes). Although imputation was able to de-crease the sparsity (non-zeros inde-creased to 20.4%), the improvement was not sufficient to detect correlations (Pearson ρ> 0.8, Fig. 3f ). We further tested MAGIC, a Markov affinity-based graph imputation method, previ-ously shown to be able to denoise count matrixes and to fill in missing transcripts [23]. The imputed dataset was able to detect large amounts of correlations (Pearson co-efficients ρ> 0.8), however, with excessive amounts of false-positive correlations compared to our approach (Additional file1: Figure S1c), a common artifact of im-putation methods [24]. In line with previous
observa-tions [24, 25], we concluded that imputation, although
certainly valuable in aiding clustering and phenotyping, is not sufficient to cope with the detrimental effects of drop-out events, preventing correlation analysis of single-cell expression count data.
We next sought to further validate our approach using simulations [26]. First, we simulated a single-cell “
refer-ence dataset” with minimal sparsity (3% sparsity, 97%
a
b
c
d
e
f
g
h
i
j
k
Fig. 3Technical benchmarks.aLeft axis, amounts of detected correlations (sensitivity) decrease with the number of clusters. Right axis, mean and median of co-expression (specificity) increase with the number of clusters.bDistribution plots of the co-expression (Jaccard index) for 3 (top) and 48 (bottom) clusters.cDistribution plots showing all the correlations of the testing dataset (gray) compared with a selected subset (those predicted by the training dataset).dPie chart, composition of the predicted correlations in the testing dataset (5000 cells).eRelationship between size of the set and resulting predicted correlations withρ> 0.6 (mean ± S.E.M.).fScatter plot of correlations inferred from the original counts against those inferred from imputed counts (scImpute). The two distributions are correlated withPearsonρ= 0.983.gAUC of inferred correlations, simulated data, 10 independent repetitions for each sparsity (error bars S.E.M.).hROC curves for 10 simulations with the highest sparsity of 97% are above the random ROC line.iExample of the validation ofEomesneighbors in the brain network. For each edge, we computed fold enrichment (proportional to edge width, highestOtx2with 9.87, lowestAdcy7with 0.83) and apvalue (labels). In the case of
[image:5.595.59.537.88.576.2]ROC (receiver operating characteristics) curve. Our approach performed optimally up to the sparsity of
88% (AUC = 83%, Fig. 3g) and still performed better
than random chance at the highest sparsity (97%,
AUC = 67%, Fig. 3g, h).
In principle, segregating a dataset with recursive cluster-ing and computcluster-ing average gene expression per cluster might sufficiently mitigate the effects of drop-out events and improve the performance of correlation metrics. However, averaged expression values were considerably more skewed than Z-scores, presenting few outliers with high expression levels (Additional file1: Figure S1d, f ). As a result, the correlations inferred by cluster-average ex-pression values are mainly driven by outliers (highly posi-tive clusters). In contrary,Z-scores use the information of all clusters, making them overall more accurate (Add-itional file1: Figure S1d, e, f ).
In summary, the benchmarking confirmed our approach for inferring correlations to be accurate, scalable, robust, artifact-free, and out-performing imputation-based approaches.
Single-cell regulatory networks identify essential and specific genes for organ function
To evaluate the value of using large-scale regulatory net-works inferred from single cells to aid biological interpret-ation of scRNA-seq datasets, we first applied our framework to a single-cell resolved mouse organ atlas [10]. We generated regulatory networks from 11 organs: endoderm (lung, pancreas, intestine), mesoderm (heart, fat, spleen, bladder, bone marrow), and ectoderm (skin,
brain, mammary glands). The adaptive correlation thresh-old, required to normalize batch effects such as sequen-cing depth or cell numbers, reached high values for all organs (ρthresh> 0.9, Table 1), which confirms the
signifi-cance of selected correlations. Inferred networks had a scale-free topology (a structure conferring fault-tolerant
behavior, p> 0.01 Kolmogorov–Smirnov test,
Add-itional file1: Figure S2) which is in line with previous find-ings in manually curated networks [27–29].
As expected, the number of nodes (i.e., genes) in the network scaled with the average number of detected
genes (Pearson ρ= 0.82, Table 1). All networks had a
positive modularity, indicating a structure organized into multiple, separated modules of genes (also called com-munities). The most modular networks were the pan-creas, heart, and brain, and the bone marrow was the
least modular (Table 1). Interestingly, networks showed
a wide variation in their density (ratio edges/nodes). Lower network densities could indicate a frequent use of
“indirect” transcriptional regulation, signaling cascade involving genes without direct gene regulatory function
(see the “Methods” section). Of note, network density
and modularity showed an inverse relationship (Pearson
ρ=−0.8, Table 1), suggesting that sparser networks
(such as the brain, heart, and pancreas) preserve a strong intra-modular connectivity at the expense of
de-creased inter-modular connectivity (Table 1). Hence,
[image:6.595.59.539.509.733.2]modularity represents a proxy for the tissue heterogen-eity, with an increased phenotype diversity being related to more modular networks.
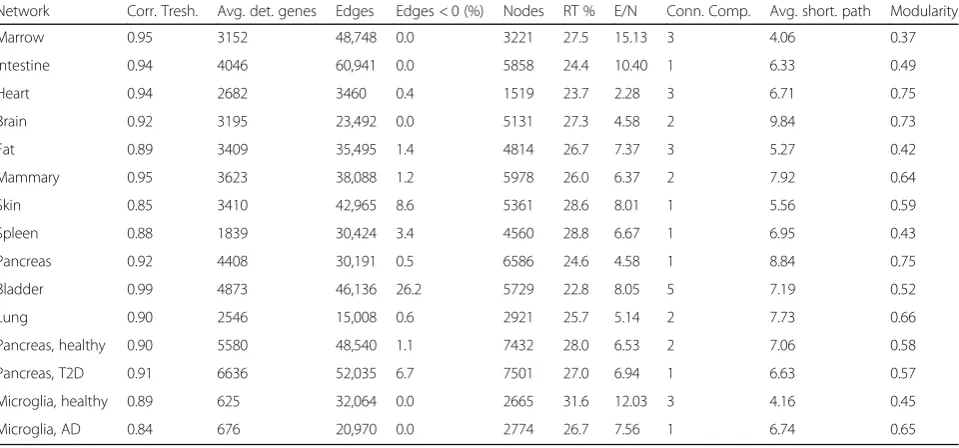
Table 1Overview of specifications for inferred regulatory networks. In order: the adaptive correlation threshold set to retain significant correlations; average detected genes, number of edges, and percentage of negative edges; number of nodes and percentage of nodes being“regulators of transcription”; network density (ratio edges/nodes), number of connected components, average shortest path, and modularity
Network Corr. Tresh. Avg. det. genes Edges Edges < 0 (%) Nodes RT % E/N Conn. Comp. Avg. short. path Modularity
Marrow 0.95 3152 48,748 0.0 3221 27.5 15.13 3 4.06 0.37
Intestine 0.94 4046 60,941 0.0 5858 24.4 10.40 1 6.33 0.49
Heart 0.94 2682 3460 0.4 1519 23.7 2.28 3 6.71 0.75
Brain 0.92 3195 23,492 0.0 5131 27.3 4.58 2 9.84 0.73
Fat 0.89 3409 35,495 1.4 4814 26.7 7.37 3 5.27 0.42
Mammary 0.95 3623 38,088 1.2 5978 26.0 6.37 2 7.92 0.64
Skin 0.85 3410 42,965 8.6 5361 28.6 8.01 1 5.56 0.59
Spleen 0.88 1839 30,424 3.4 4560 28.8 6.67 1 6.95 0.43
Pancreas 0.92 4408 30,191 0.5 6586 24.6 4.58 1 8.84 0.75
Bladder 0.99 4873 46,136 26.2 5729 22.8 8.05 5 7.19 0.52
Lung 0.90 2546 15,008 0.6 2921 25.7 5.14 2 7.73 0.66
Pancreas, healthy 0.90 5580 48,540 1.1 7432 28.0 6.53 2 7.06 0.58
Pancreas, T2D 0.91 6636 52,035 6.7 7501 27.0 6.94 1 6.63 0.57
Microglia, healthy 0.89 625 32,064 0.0 2665 31.6 12.03 3 4.16 0.45
We next sought to validate our predicted regulatory edges. We reasoned that when a system is perturbed, pairs of connected genes (linked by an undirected edge), on average, are more likely to be activated/deactivated to-gether. Thus, we used the Molecular Signature database (MSigDB), which contains an extensive collection of ex-perimental signatures representing perturbations in differ-ent biological systems. We performed a proportional test (Fisher’sexact test) to quantify the co-occurrence of neigh-boring genes in MSigDB experimental signatures, thereby testing the significance of each individual edge in the net-work (Fig. 3i). In the brain network, the edges (23,492) showed an overall distribution bias towards positive fold
enrichment and significantp values, which supports our
inferred regulatory links (Fig. 3j, k). Specifically, 34% of the edges were validated (p< 0.05), and this percentage in-creased when we considered only the edges whose genes are present in many MSigDB signatures (Fig. 3k). In fact, 100% of the edges were validated when considering only genes appearing in at least 360 signatures. The results were similar for the other 10 mouse organ networks (Add-itional file1: Figure S3a).
Notably, genes that were central in the different mea-sures showed marginal overlap (Fig. 4a, Additional file1: Figures S4, S5), which suggests that conceptually different centralities quantify distinct types of biological importance and provide mutually complementary information.
To confirm the importance of central regulatory genes in the biological system, we calculated their enrichment among experimentally validated essential genes (Online GEne Essentiality (OGEE) database); knockdown of these genes causes lethal or infertile phenotypes in Mus musculus (see the “Methods” section). For all centrality metrics, gene centrality was proportional to biological essentiality (Fig. 4b, c), which supports the reliability of our networks and the validity of applying node centrality theories to single-cell data. These results also suggest that, in principle, all the tested centralities yield bio-logical insights. However, some centralities (pagerank,
betweenness, degree) produced more stable predictions
irrespective of the network structure (Fig. 4d,
Add-itional file1: Figure S6). For example,closenesscentrality did not perform well on disconnected graphs.
Next, to assess genes’ organ-specific centrality and
how this relates to biological functions, we compared the centrality of genes across organs. In 11 regulatory networks, we identified genes that were central for single or multiple mouse organs (Fig.4e, Additional file1: Fig-ure S3b). Genes that were central in multiple organs ap-peared more essential than organ-specific genes (Fig.4g, Additional file 1: Figure S3c). In line with this, shared central genes were associated with general housekeeping functions (e.g., gene expression or metabolic processes), whereas organ-specific central genes were associated
with organ-specific processes (GO enrichment, Fig. 4h).
Examples include epidermis development in the skin (p
< 3.2 × 10⁻⁵
), regulation of blood vessel diameter in the heart (p< 4.1 × 10⁻⁵), andregulation of neuron apoptotic processin the brain (p< 5.8 × 10⁻⁴). Importantly, regula-tory network analysis provided biologically relevant in-formation not captured by gene expression levels alone. In fact, most organ-specific central genes are not upreg-ulated in their respective organs (Fig. 4f ). This implies that gene expression levels are not an adequate measure of the importance of such genes for their underlying bio-logical system.
Overall, our framework for single-cell network analysis was capable of exposing functional regulatory structures and key genes that are undetectable by current computa-tional strategies. We believe that this approach will be very valuable and broadly applicable for interpreting healthy and diseased complex biological systems. For the latter, regulatory networks will allow us to detect the molecular fingerprints of perturbations and to identify key driver genes for disease.
Altered regulatory network architecture in the pancreas from type 2 diabetes (T2D) patients
We considered that regulatory networks and gene central-ities would be particularly informative about latent disease-related regulatory changes that are invisible to current analytical approaches. Thus, we generated healthy and T2D regulatory networks for 2491 single-cell tran-scriptomes from diabetes patients and controls [11]. First, we studied disease-related changes inpagerankcentrality, a metric originally conceived to rank the popularity of
websites. Nodes with high pagerank centrality indicate
“popular”genes involved in multiple regulatory pathways.
We hypothesized that genes with altered pagerank
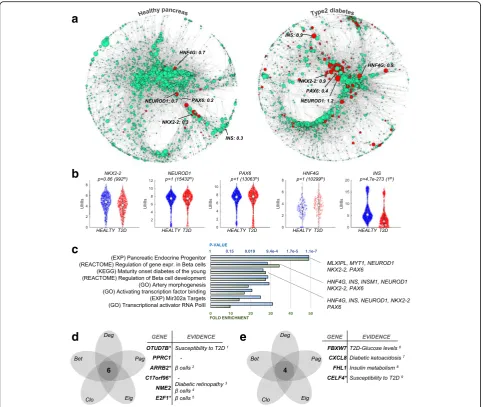
cen-trality would represent T2D regulatory changes with high functional impact on disease pathology. We found 162 genes with significantly increased pagerank centrality in T2D, despite showing equal expression levels (p> 0.05) in T2D patients and healthy controls (Fig.5a, b). In addition, we detected 10 genes, including insulin (INS), with in-creasedpagerankthat were significantly downregulated in T2D (p< 0.05). Consistent with known disease pathology,
insulin was the most downregulated gene (p< 2.2 × 10−264), but had significantly higher pagerank centrality (from 0.3 to 0.9; Fig. 5a, b). This shows that insulin is a crucial limiting factor in the T2D network, and further emphasizes its pivotal role for the disease. Next, we used GO and MSigDB to confirm the importance of the 172
genes with increased pagerank for pancreas function.
Gene set enrichment supported their role in diabetes pathophysiology, as illustrated by the overrepresentation of terms such as“onset of diabetes in the young”signature
a
b
e
c
d
f
g
h
[image:8.595.61.537.86.547.2]remaining centralities (eigenvalues,closeness,betweenness,
degree) were also enriched in diabetes-related functions, further highlighting the value of our method for interpret-ing scRNA-seq data (Additional file2).
Finally, we identified genes with a simultaneous increase or decrease in the five centralities, which we expect to drive essential regulatory changes in T2D. We detected 4 (6) genes with repeated increased (decreased) centrality, most of which have previously been linked to diabetes pathology (Fig. 5d, e) [30–37]. For example, ARRB2, a gene with a
demonstrated role inβ cell development [38], showed no
differential expression (p> 0.05) but was simultaneously de-creased in all six centrality measures. This is particularly
re-markable because β cells were the most deregulated cell
type in the original analysis [11], which however did not de-tect the importance ofARRB2in this context. This further supports the notion that generating global regulatory net-works from single-cell data provides important insights into the pathological mechanisms of diseases. We further mea-sured the degree of monotonicity to test whether the T2D network had a more chaotic dynamical behavior compared to the healthy pancreas network, but did not find significant changes for this attribute (Additional file1: Figure S7c, d).
Network-driven interpretation of differentially expressed genes
Differential expression (DE) is the backbone of most analytical pipelines for RNA-seq. A typical challenge is
a
b
c
d
e
[image:9.595.57.541.87.494.2]to interpret differentially expressed genes and identify functionally important events. This is generally achieved
by (i) focusing on the genes with most significant p
value, (ii) integrating external databases (GO or
MSigDB) to elucidate key genes and pathways, or (iii) using personal knowledge to identify previously anno-tated genes. However, none of these approaches guaran-tees an unbiased classification of biological importance. In fact, in DE analysis,p values rank genes by technical reproducibility, not by biological importance, and both external databases and personal knowledge can be biased. Single-cell regulatory networks can be used to provide an unbiased, hypothesis-free classification of the biological importance of genes, allowing us to automat-ically identify pivotal deregulated genes, which greatly facilitates data interpretation. Comparing gene
expres-sion inβcells between healthy and T2D individuals, we
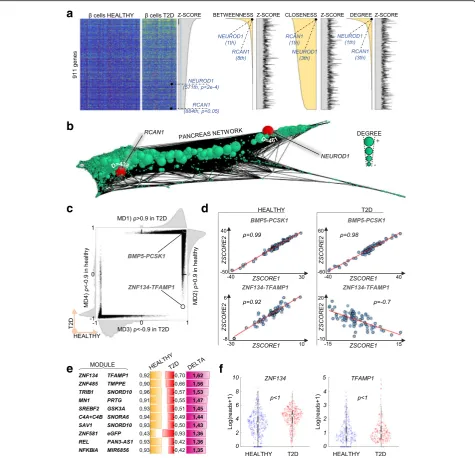
detected 911 genes upregulated in T2Dβcells (p< 0.05; Fig.6a). Ranking these genes by centrality rather than p
values (i.e., Z-scores) provided quantitative sorting by biological importance, allowing us to immediately focus
on the most relevant candidates. For example,
NEU-ROD1 and RCAN1 showed the highest centrality of all deregulated genes according to multiple metrics (Fig.6a, b), suggesting that they are the most informative and
biologically relevant. Interestingly, mutations in
NEU-ROD1were associated with T2D [39], whereas
upregula-tion ofRCAN1was shown to cause hyperinsulinemia, β
cell dysfunction, and diabetes [40]. Notably, neither of
these genes was highlighted with DE p values (
NEU-ROD1 2829th, p< 2 × 10⁻⁴; RCAN1 4331th, p< 0.05). This example highlights the high additive value of using single-cell regulatory networks and related node central-ities to aid interpretation of DE results.
Inversions of gene correlations in T2D
Regulatory networks can be further interrogated to de-tect changes in local interactions, namely pairwise corre-lations between genes. We reasoned that gene pairs with an inverted correlation in T2D samples compared to the healthy pancreas represent rewired functional modules with potential pathological implications. Of note, a complete inversion of correlation, from positive (training set, ρ> 0.9) to negative (test set, ρ< 0), never occurred when benchmarking the correlation approach (25,632 computed cases, p< 1/25,632; Fig. 3c–e). Performing comparative analysis of the healthy and T2D networks, all pairwise correlations were highly similar under
healthy and T2D conditions (example of BMP5 and
PCSK1, Fig.6c, d), which is remarkable considering that the data come from different donors and are subject to inter-individual variability as well as several confounding factors (e.g., age and weight). In contrary, correlations inferred directly from expression data were few, in line
with our previous results on other datasets (Fig.2c), and unreproducible across conditions (Additional file 1: Fig-ure S7a, b). This indicates that our approach works transversely to confounding variables, ultimately expos-ing the true functional correlations between genes (see the “Confounding variables” section in the “Methods” section). Closer inspection revealed a number of mod-ules (14) with strongly (ρ> 1) inverted correlations, the
most striking example being ZNF134 and TFAMP1,
which switch from a strong positive correlation in the healthy pancreas (ρ= 0.92) to a negative correlation in T2D (ρ=−0.7). Neither of these genes showed a change in expression between conditions (healthy/T2D), which renders their altered functionality invisible to standard methods (Fig.6e, f ).
Several other genes displaying inverted correlations have previously been linked to diabetes (7/18), either by functional studies (TRIB1, glucose metabolism;NFKBIA, insulin resistance pathway) or as candidate disease genes
in GWAS or gene expression studies (TMPPE, PRTG,
andZNF319) [41–46]. Functionally, the most interesting areSREBP2and GSK3A, which have a direct mechanis-tic relationship and are both implicated in T2D and which also switched from a positive to a negative correl-ation. SREBP transcription factors are major players in lipid metabolism and possibly insulin resistance, whereas GSK3 phosphorylates SREBP in the absence of insulin and AKT signaling, leading to its degradation [47–49]. Consequently, we can speculate that the reversal in cor-relations inferred from single-cell data is directly related to a change in insulin signaling and the degradation of
SREBP2 through GSK3A.
In summary, the comparative analysis of single-cell-driven correlations is a suitable novel approach for disen-tangling the molecular mechanisms of diabetes and further enlarges the repertoire of single-cell data analysis strategies available for meaningful data interpretation.
Rewiring of microglia gene regulation in Alzheimer’s disease (AD)
We further evaluated the applicability of our network-based approach in a different disease and species context with datasets of higher size and increased sparsity. To this end, we analyzed scRNA-seq data from immune cells (CD45+) derived from 5XFAD transgenic mice, a com-monly used model for AD [12]. The dataset contained transcriptomes from 22,951 single cells from different dis-ease stages (1–8 months, control, and 5XFAD) as well as
data as an input to generate regulatory networks for con-trols and AD. Overall, while the two networks were of comparable size (Table 1), we observed a general loss of connectivity in AD, which increased network sparseness and signal traveling time (shortest paths, Table1). Conse-quently, centralities of several genes were different in the
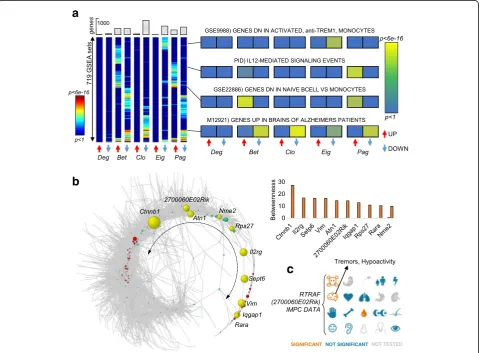
AD network compared to the control (Fig. 7a). Altered
centralities were associated with different MSigDB enrich-ments, further reflecting the fact that each centrality high-lights different functional aspects. For example, genes that lost influence (eigenvalue) significantly overlapped with genes that were dependent on Trem1in monocytes (p<
a
b
c
e
d
f
Fig. 6Prediction of gene importance in DE data and directional changes in correlations.aHeatmap of normalized expression values of 911 genes found significantly upregulated in T2Dβcells compared to healthyβcells (p< 0.05) sorted by decreasingZ-score (i.e., increasingpvalues) or decreasing centralities (betweenness,closeness, anddegree). Biological importance ofNEUROD1andRCAN1is highlighted by their high centrality but not by their DEZ-scores. In general, correlation between DEZ-scores and centrality is marginal, as shown by the erratic area plots ofZ-scores sorted by centrality.bPancreas regulatory network generated using all cells (both healthy and T2D), node size proportional to its degree.
[image:11.595.61.537.88.546.2]6.5 × 10⁻⁶). This observation is intriguing given the
rele-vance ofTrem2in the mediation of immune response in
AD brains.
Other function–centrality associations include genes that are upregulated in AD patients (p< 5.0 × 10⁻¹²), the interleukin 12 signaling cascade (p< 1.1 × 10⁻⁸), and genes that are downregulated in naive B cells compared to monocytes (p< 3.5 × 10⁻¹⁰; Fig. 7a). Overall, betweenness
showed the most dramatic changes of all centralities. In fact, the AD network was rewired into a circular shape, which in turn causes a number of genes to become infor-mation bottlenecks (Fig. 7b). Interestingly,beta catenin 1
(Ctnnb1), part of the main pathway that regulates the on-set and progression of AD [50], showed the largest
in-crease in betweenness (from 0.0 to 27.3%, Fig. 7b) and
became the main bottleneck in the AD network. Among
the top 10 genes with increased betweenness, we also
found a poorly annotated transcript 2700060E02Rik
(Fig.7c), whose heterozygous deletion was previously as-sociated with tremors and hypoactivity, a common
symp-tom of AD (Mouse Phenotyping Consortium, www.
mousephenotype.org).
Discussion and conclusions
During the last decade, single-cell transcriptomics has be-coming increasingly important for deconvoluting the cellu-lar architecture of complex tissues and for classifying cells with categorizing principles. An integrated scenario, where single cells are combined to infer global regulatory net-works, has not yet been comprehensively explored. There have been isolated studies using small-scale single-cell data to derive partial regulatory networks, although their reliabil-ity has been questioned [9]. Hence, it remained unclear
a
b
Fig. 7Rewiring of regulatory network in Alzheimer’s disease microglia introduces information bottlenecks.aMSigDB enrichments for 10 lists of genes with altered centrality in AD compared to control network (5 centralities, 719 MSigDB terms were found to be enriched withp< 0.05 in at least one entry). The results show that the tested centralities provide insights into different functional pathways.bThe AD regulatory network follows a circular shape in which the nodes along the terminal tail (yellow genes) become bottlenecks, i.e., acquire increasedbetweenness. The exact increase inbetweennessis represented in the histogram.cInternational Mouse Phenotyping Consortium data for the transcript
[image:12.595.59.539.302.655.2]whether single-cell datasets can be analyzed using strategies other than clustering-based phenotyping.
The main obstacles that impede network analysis of single-cell data are the technical limitations inherent to the technology and the very large data volumes. Guo and coworkers used least square fitting on expression data from 28 epithelial cells and inferred a partial regula-tory network of few hundred nodes and edges [7], how-ever, without validating it. Further, the use of least square fitting is known to perform poorly with the sparse and low complexity of single-cell data [5]. In an-other work [8], 92 cells were analyzed using an asyn-chronous Boolean approach to refine literature curated models of hematopoiesis. Boolean approaches are not easily scalable [5] and can therefore only be used to in-spect reduced, specific sub-networks. Other studies ap-plied graphical approaches not scalable to large-scale
sequencing data [51–57], metrics not tailored to
scRNA-seq-specific features [51, 52, 54, 55, 57, 58], or
dynamic process-specific approaches [53, 54, 58, 59].
More recently, Aibar and colleagues developed the first tool designed to infer transcription factors and their tar-get genes from single-cell data [60]. However, this tool ultimately seeks to infer one network for each cell, with consequent applications in clustering and phenotyping but not global regulatory networks.
In this work, we conceived an analytical framework for inferring large-scale regulatory networks from single-cell data. To confirm the viability of this approach, we gener-ated a large and diverse repertoire of regulatory net-works in healthy and diseased contexts. To support network interpretation, we applied tools from graph the-ory and validated this strategy thoroughly at multiple levels. Importantly, we showed that regulatory networks derived from single-cell data can be used to obtain novel and biologically relevant insights into the molecular architecture of complex systems and the pathophysi-ology of diseases. This work represents an important leap forward in the field of single-cell analysis for the reasons described below.
First, we conducted the first large-scale analysis of glo-bal regulatory networks using single cells. We processed datasets from up to 8000 single cells into networks with up to 60,000 edges and 7000 nodes, going far beyond
previous studies [7, 8]. Second, we conceived a metric
which consistently identified hidden correlations within the single-cell dataset. The metric was specifically tai-lored to single-cell data, diminishing the effect of data sparsity, confounding factors, and other technical arti-facts. Thereby, it removes main obstacle to processing scRNA-seq data into regulatory networks. Third, we studied the global and local properties of networks using tools from graph theory, enabling a comprehensive characterization. Fourth, we validated our results at
multiple levels. Diversified technical benchmarks with real and simulated datasets proved our method to be artifact-free, robust, reproducible, accurate, and better performing than imputation-based approaches. Fifth, we validated inferred correlations between transcription reg-ulators and target genes via experimental signatures of perturbed biological systems. In line with previous
evi-dence, the inferred networks were scale-free [27–29].
The centrality of genes was also validated using external experimental datasets of essential genes (OGEE data-base), supporting their biological relevance. Further, we validated the functionality of organ-specific central genes in their respective tissue contexts (GO enrichment). Lastly, we found that genes with altered centrality in T2D and AD strongly overlap with previous known
dis-ease mechanisms. Sixth, we compared the results from
the regulatory network approach with those from con-ventional DE analysis. Notably, we found that networks repeatedly disclosed latent variation and features that were invisible to standard analysis. Moreover, we showed that gene centrality analysis was able to work in synergy
with differential expression analysis to provide an un-biased, quantitative ranking of biological importance from dysregulated genes. To our knowledge, this is a unique strategy for deducing a data-driven biological ranking without the need to incorporate external infor-mation (e.g., GO or MSigDB) or personal knowledge.
Seventh, we have completed the first single-cell, network-driven analysis of diseased samples. Here, graph-based tools allowed us to enhance our under-standing of their molecular pathology. Our results sug-gest that different diseases might affect different gene centralities, as observed in Alzheimer’s disease, which primarily affectedbetweenness. This raises the possibility of different measures of centrality being sensitive to dif-ferent forms of pathophysiological alterations, i.e., regu-latory alterations.
In general, given its integrated rather than classifying use of single cells, we propose that the network ap-proach is particularly well-suited for complex experi-mental designs with multiple confounding factors. For example, a case–control design with biased patient se-lection (e.g., sex and age) will inevitably result in com-position biases in single-cell dataset. Disentangling such confounding from disease-related effects is a challenging task without a straightforward solution. We showed that, although greatly affecting DE analysis and clustering, such biases do not impact on gene-to-gene correlations and single-cell-derived gene regulatory networks.
completeness of the captured regulatory interactions, and this should be the primary future task.
Methods
Inferring gene expression correlations and regulatory networks from scRNA-seq data
Single-cell sequencing is characterized by a series of technical limitations that generate artifacts, such as drop-out events, irregular sequencing depth, and low li-brary complexity. First, drop-out events represent expressed genes that are undetected by scRNA-seq for technical reasons, resulting in zero values in the expres-sion count matrix. These events make single-cell data-sets considerably sparser than bulk RNA-seq datadata-sets. Drop-out events are perhaps the most important factor affecting the performance of correlation methods, such as Spearman or Pearson, applied directly to expression count data. Second, irregular sequencing depth is caused by the uneven (non-normalized) loading of single-cell li-braries into the sequencing reaction. Consequently, we observe large fluctuations in sequencing depth between cells, which can only partially be addressed by data normalization. Third, single-cell data present a reduced dynamic range of expression values, which is a further challenge for the performance of correlation methods. In fact, as it is not possible to entirely remove the effects of read distribution biases, traditional correlation coeffi-cients have suboptimal performance with this data type. Since these technical artifacts concur to mask correla-tions when using expression counts, we envisaged that a change of variable would greatly improve the perform-ance of the correlation methods, thereby allowing us to infer the regulatory networks. To this end, we devised the following steps:
1) Data pre-processing.Datasets were analyzed using thebigSCaleframework [13], which handles the noise and sparsity of scRNA-seq data using an ac-curate numerical model of noise. The framework includes modules for differential expression analysis and unsupervised cell clustering. All datasets were processed usingbigSCaleunder default parameters, with the exception of parameters regulating the granularity of clusters.BigSCalewas set to the high-est granularity (i.e., recursive clustering) in order to produce the highest number of clusters, the ration-ale being to segregate cell sub-types and subtle cell states, so as to improve the resolution and quality of inferred correlations.
2) Measuring correlations in the Z-score space.After clustering the cells to the highest feasible granularity, we usedbigSCaleto run an iterative differential expression (DE) analysis between all pairs of clusters. Forxclusters, this results in a
total ofx× (x−1)/2 unique comparisons, each yielding aZ-score for each gene that indicates the likelihood of an expression change between two clusters. This allows us to compute correlations between genes usingZ-scores instead of expression values. For correlation analysis, we usedPearson,
Spearman, andCosinecoefficients. We also tested the mutual information to detect non-linear corre-lations. However, in theZ-score space, this resulted in an excessive number of false positives. Specific-ally, mutual information repeatedly identified sig-nificant dependencies for which one of the two variables was linearly independent of the other (slope = 0). Nevertheless, linear correlations in the
Z-score space can also reflect non-linear correla-tions in the original expression space. Hence, we chose to rely exclusively on a solid measure of lin-ear correlation in theZ-score space viaPearson,
Spearman, andCosinecoefficients. The final correl-ation for each pair of genes was computed as the lowest (worst) betweenPearsonandCosine( Spear-manis used in a later stage as a further control). 3) Building a regulatory network.In the next step, we
retained significant correlations to define the edges of the regulatory network. Notably, the distribution of correlations is influenced by biological and technical factors. For example, increased cell numbers or sequencing depth results in a higher number of significant correlations. Consequently, to compare regulatory networks inferred from
different datasets, we must first adjust for technical factors, for which we used an adaptive rather than fixed correlation threshold. Specifically, the inferred networks were built by retaining the top 0.1% correlations. Using this relative correlation
threshold prevents technical factors from producing artificial differences when comparing different networks. Although relative thresholds could result in the inclusion of non-significant correlations (e.g., ρ= 0.4), we did not observe such events in any of the inferred networks, with most adaptive thresh-olds set betweenρthresh= 0.9 andρthresh= 0.99. The
lowest (worst) adaptive threshold wasρthresh= 0.84
for the AD network, which is still significant. Spear-mancorrelation is used as a further control to dis-card weak correlations. Specifically, final
correlations for which |ρSpearman| < |ρthresh−0.15|
were considered null.
discarded from the network edges representing pairs of genes of which neither was annotated as“regulator of gene
expression,” as we considered these to be spurious
co-expression links. Alternatively, more specific GO terms could be used for network polishing (e.g., GO:0006355
“regulation of transcription, DNA-templated”or GO:000370
“DNA-binding transcription factor activity”). However, we opted for a broader term so as to include in our networks all possible regulatory layers, including indirect signaling events. We refer to this step as GO sub-setting.
Computing theZ-scores
Differential expression (DE) between clusters of cells
yields a Z-score over which correlations are computed.
DE is based on the methods previously described in [13] with two main additions.
Briefly, we generate a numerical model of the noise af-fecting a given single-cell dataset. Cells featuring highly similar transcriptomes are considered as biological rep-licas and are grouped together. Next, the expression vari-ation within groups is used as an estimator of noise. Eventually, apvalue is assigned to each gene, representing the likelihood of a change of expression from one bio-logical replicate to another. This model is then generalized to compute differentially expressed genes between any given pair of cells. When identifying DE between two groups (i.e., two clusters), each cell of one group is com-pared to each of the cells of the other group, resulting in a
total of n1 ×n2 comparison, where n is the number of
cells of each group. For each gene, the n1 ×n2 log10
transformed p values (derived from the probabilistic
model and signed to represent up- or downregulation) are summed into a total raw score. Genes up/downregulated in one group compared to the other will cumulate high (positive or negative) total raw scores. The raw score is next adjusted for the total number of comparison and for the within-group variability, which is estimated by running a DE analysis between randomly reshuffled cells in a way that cells of the same group are compared.
The first modification is adding an independent test of
Z-scores using the Mann–Whitney U test/Wilcoxon
rank-sum test, which was shown to be very effective on single-cell data, especially with high cell numbers [61]. For every gene, the Z-scores generated by the two tests (numerical model and Wilcoxon) are eventually joined
in a final Z-score (the module of the two-dimensional
vectorffiffiffiffiffiffiffiffiffiffiffiffiffiffiffiffiffiffiffiffiffiffiffiffiffiffiffiffiffiffiffiffiffiffiffiffiffiffiffiffiffiffiffiwhose dimensions are the two Z-scores):
Z2num:modelþZ2Wilcoxon q
. This merging rewards reprodu-cibility that is genes with highZ-scores in both methods will have a higher final Z-score. The two tests work in synergy, filling each other’s weaknesses. For example,
Wilcoxon Z-scores are bounded by the size of the
groups: small groups will yield limited Z-scores, no
matter how strongly the genes are differentially
expressed.Z-scores computed with the numerical model
are not limited by group sizes. On the other end, Wil-coxon is more accurate when the group sizes are large (> 500–1000 cells).
Secondly, we modified the process in which the raw score is adjusted for the total number of comparison. The rationale for this adjustment is to take into account that genes with sparser expression will produce smaller scores compared to genes expressed in high frequency. We changed from a log scale to a linear scale in the number of comparisons, allowing a far better resolution and sensitivity, especially in the range of the medium to highly expressed genes.
Recursive clustering
The recursive clustering is the core process in our ap-proach to identify and segregate the maximum possible amount of biologically informative cell clusters (corre-sponding to cells with a specific phenotype). The recur-sive clustering is an evolution of the previous clustering approach used in bigSCale [13], in which (1) all pairwise cell distances were computed over a set of highly vari-able genes (genes presenting a high degree of variation across the dataset) and (2) based on these distances cells were hierarchically clustered (Ward’s linkage).
Cutting the hierarchical tree very low (i.e., towards the leaves) would generate many small clusters. However, these clusters could lack biological relevance, because they are all created from the same initial set of highly variable genes, which is predominantly describing only the major cell types and not the sub-types or subtle cell states. For this reason, it is not suitable to cluster data-sets beyond the levels of main clusters (i.e., cell types) with just one set of highly variable genes. To solve this issue, we devised a recursive clustering approach in which each cluster is further re-clustered into sub-clus-ters upon calculation of its specific set of highly variable genes. This is recursively repeated (each output cluster becomes the input for a further clustering) until there is no more meaningful separation.
increase (in the previous example, 20th). This rule effect-ively manages to automatically divide the cells into bio-logically informative clusters.
Recursive clustering terminates when none of the ob-tained clusters can be sub-clustered in a meaningful way. Whether or not a cluster can be meaningfully sub-clus-tered is decided upon two elements: (1) a fixed parameter representing the lowest possible partition size (for ex-ample, set to 50 cells for datasets with less than 5000 cells) or (2) the hypothetical (unsupervised) cutting depth to which the cluster would be sub-clustered. Thus, small groups of cells can be further clustered only if they are very heterogeneous. The unsupervised cutting depth is used as a proxy for heterogeneity; the higher the cutting depth (i.e., the more we cut the tree down to its leaves), the more heterogeneity. If a given group of cells is hetero-geneous enough with respect to its size (large groups of cells are clustered anyway), then it is further clustered.
Confounding variables
Comparing healthy and type 2 diabetes (T2D) cells in DE reveals an extremely high number of differentially expressed genes. Specifically, 6716 genes are differen-tially expressed with p< 0.001. A portion of these DE genes is likely caused by confounding factors (sex, age,
weight). For example, PPP1CB is a gene expressed
ap-proximately 14 times higher in male than in female pa-tients, irrespectively of the disease. The same gene appears also upregulated in diabetes (p< 3.9e−80), sim-ply because healthy cells have a larger amount of male cells (healthy 80% male, T2D 48% male). Consistently, the entire male signature (approximately 700 genes) is upregulated in the diabetes dataset. Also, age and weight and other unknown confounding variables generate fur-ther biases in the same way. Disentangling confounding effects from disease-related effects in single-cell patient data is not straightforward. As for the present example, the groups will inevitably present unbalanced compos-ition, affecting DE analysis. In addcompos-ition, gene-level vari-ability (the mean and standard deviation) is very different for DE genes affected by confounding factors. Our GRN approach is stably inferring correlations, also across unbalanced sample cohorts, as long as the con-founding factors are present in both groups. The corre-lations are stable, and only functional shifts within expression values (change of phenotype) caused by an internal rewiring of the regulatory network are detected.
Measuring node centrality
The centrality of a node (gene) is used to quantify its importance in a network (in our case a gene regulatory network). There are different metrics to measure node centrality. Here, we used degree, betweenness, closeness,
pagerank, andeigenvalue. All these centralities were cal-culated with the package igraph 1.2.2.
Degree is the most basic measure of centrality: it is measured as the number of edges afferent to a given node. Our inferred networks are undirected; therefore, we do not distinguish between in-degree (incoming edges) and out-degree (outgoing edges).Betweennessis a centrality based on shortest paths. It is calculated by enumerating all shortest paths of a network and by quantifying the number of times each node falls in a
shortest path. Genes with high betweenness act as
brid-ges in the signaling cascades of the network. More spe-cifically, given that all our inferred networks showed a modular structure (Table 1), it is likely that genes with high betweenness serve as bridges between different
modules of the network. Closeness centrality measures
the mean distance from a node to all other nodes (by using shortest paths) of a network. Genes with high
closeness are located in a middle, central position in the network and have therefore quick access to influence or
detect the expression of any other gene. Both
between-nessand closeness scale with the size of the network. In this manuscript, we always used their normalized values to avoid biases based on the network size.Pagerank cen-trality results from a random walk of the network. In simple terms, this centrality is proportional to the aver-age time spent at a given node during all random walks. If we consider the genes as the aliases of the web pages
for which pagerank was initially conceived, then genes
with high pagerank can be seen as “popular” genes.
Eigenvaluecentrality uses the eigenvector corresponding to the largest eigenvalue of the graph adjacency matrix.
Pagerank andeigenvalue are very similar. In fact, pager-ankis a variation of an eigenvector-based problem. Both
pagerank and eigenvalue centralities exploit the notion that not all edges are equal. In particular, edges coming from nodes with higher degree are more important than edges coming from nodes with low degree. One of the
main differences between pagerank and eigenvalue is
that the first includes an additional term, called damping factor, which simulates the behavior of an imaginary web-surfer who will not continue clicking indefinitely, but he/she would rather continue clicking with a certain probability. This probability is represented by the damp-ing factor (typically 0.85).
Network densities and GO sub-setting
The large changes observed in the network densities (Table1) seem to be in contrast with the functioning of our adaptive correlation. In fact, the adaptive correlation threshold initially assigns the same (relative) amount of edges, hence density, to each network.
isolated components (sub-networks disconnected from the main one and smaller than 1% of total network size), which leads to a decrease in density depending on the
network structure. However, the subsequent GO
sub-setting is probably the major driver in the reduction of network density. GO sub-setting removes all the edges not linking to at least one “regulator of transcrip-tion.”In turn, GO sub-setting triggers a second passage of edge removal, in which the nodes and components becoming isolated after GO sub-setting are removed.
GO sub-setting creates larger losses of density when genes, which are not “regulators of transcription,” ini-tially attracted a large number of correlations. Consider-ing that the abundance of“regulators of transcription”is
stable across networks (Table 1), it means that having
more or less correlations driven by non-regulators of transcription is a functional, biological feature of the tis-sue. Tissues with signaling cascades reaching the regula-tor of transcription after passing through multiple other genes are more likely to end up with lower network density. This is because the GO sub-setting aims to re-move all intermediate actors that are not directly in-volved in the regulation of transcription.
Validation of network edges with external datasets
Our inferred regulatory links represent putative events of the transcriptional regulation on target gene(s). We chose to also include indirect regulation events that do not imply the direct binding of a transcription factor to the promoter of the target gene(s). By filtering the edges using the broad GO term “regulators of transcription,” we included all possible regulatory layers, including tran-scription co-factors, epigenetic mechanisms, regulation of RNA stability/degradation, and signaling cascades. Consequently, neighboring genes (genes connected by an edge) are likely to belong to a common pathway and should be similarly affected when the system is per-turbed. MSigDB contains an extensive collection of ex-perimental signatures associated with perturbation of biological systems, which we used to independently val-idate each edge in our networks.
Specifically, we used collections C4 (computational gene sets), C6 (oncogenic gene sets), and C7 (immunologic gene sets) all of which defined form experimental data.
To detect significant enrichment of co-occurrences, we applied Fisher’s exact test. Edges with significant p
values imply that the related genes are activated/deacti-vated together in experimentally perturbed systems sig-nificantly more often than expected by chance.
The distribution of edge-wise fold enrichment (i.e., how often the edges translate into co-occurrences in MSigDB signatures) was biased towards positive values for all mouse organs tested, indicating an overall
simul-taneous modulation of neighboring genes (Fig. 3e, f ).
Co-regulation was further supported by significant p
values (e.g., Fig. 3g, Additional file 1: Figure S3a), espe-cially when considering edges with higher numbers of as-sociated MSigDB signatures (small gene sets are less likely to yield significantpvalues in the Fisher exact test). Not-ably, we inferred organ-specific regulations, whereas the MSigDB signatures are collected from a highly heteroge-neous set of biological sources. Inevitably, some of our organ-specific regulatory links will be not backed-up by MSigDB signatures, which explains why we could not val-idate not all individual edges in our networks.
For all the GO (version 24/03/2017) and MSigDB (ver-sion v6.0) enrichment analyses, we used hypergeometric distribution withBonferronicorrection.
Validation of network hubs with gene essentiality
To elucidate whether the hubs in our networks repre-sent esrepre-sential regulatory factors, we took advantage of the Online GEne Essentiality (OGEE) database. This database provides an unbiased, comprehensive catalogue of the essentiality of experimentally tested genes across species. In this setting, we used theMus musculus
data-set (available at http://ogee.medgenius.info/browse/
Mus%20musculus), which lists the essentiality status for 9402 mouse genes. To quantify the essentiality of each set of hubs, we computed an essentiality score (ES), as:
ES¼ log2
Ehubs
NEhubs
Ebackground
NEbackground
where Ehubs and NEhubs are the number of essential
and non-essential hubs, andEbackground and NEbackground
are the number of essential and non-essential genes in the OGEE dataset, respectively.
To assess the significance of each ES, we computed the empirical probability of finding a score of the same
magnitude by chance. Specifically, given a set with N
hubs, we sampledNrandom genes from the OGEE
data-set and calculated the ES. We repeated this process 10,000 times, and from the resulting distribution, we
used the one-tailedpvalue as the proportion of random
ES that are equal to or greater than the observed ES.
After calculating one p value for each ES, we corrected
for multiple testing by applying a Benjamini–Hochberg
correction to the vector ofpvalues.
Detection of changes in centralities
we selected the 1000 nodes with the greatest change in centrality (either positive or negative). The change in
centrality was then integrated with the p values of the
DE analysis (bigSCale, standard parameters) to identify
genes undetected by DE (Additional file 1: Figure S8a).
In an alternative approach to identify relative changes in centrality, we searched for dispersed nodes lying outside the proportional relationship betweencaand cb. We per-formed non-linear fitting (smoothing spline) to derive a confidence interval of the dispersion. Nodes that showed overdispersion at p< 0.05 were defined as having altered centrality (Additional file 1: Figure S8b). Ultimately, we did not use this analysis in the manuscript, opting for the absolute change only (first approach). This is be-cause relative changes in centrality, as measured by over-dispersion, were biased towards small changes in centrality, which were important at a relative level, but irrelevant at the absolute level.
Organ-specific genes
The specificity of the genes in the network was quanti-fied using their connectivity and expression. For the former, nodes were considered as specific if they were ranked in the top 20% of a given centrality measure ex-clusively in a particular organ. The putative function of each set of organ-specific nodes was assessed by GO en-richment analysis using the GOstats package [62].
Alternatively, the expression multiplicity of each gene in the network (the number of organs in which it is exclusively expressed) was computed as described in [6]. Briefly, we calculated a modified Z-score for each gene in each net-work, in which the difference between the mean expression of a gene in a specific organ and its median expression across organs is divided by the interquartile range (IQR) of its expression across organs. The multiplicity is obtained by
counting how many organs have a Z-score > 2, and
organ-specific genes are those with a multiplicity = 1.
Additional files
Additional file 1:Figure S1.Benchmarking inferred correlations.Figure S2.Single-cell gene regulatory networks are scale-free.Figure S3. Valid-ation of inferred networks and analysis of multiplicity.Figure S4. Rela-tionship between degree and other centralities.Figure S5.The central genes of different metrics show marginal overlap.Figure S6.Relationship between gene centrality and biological essentiality.Figure S7.Monotone behavior of healthy and diseased pancreatic tissue.Figure S8.Detection of genes showing changes in centrality. (PDF 1880 kb)
Additional file 2:MSigDB enrichments for gene sets with altered centrality. (XLSX 14300 kb)
Funding
HH is a Miguel Servet (CP14/00229) researcher funded by the Spanish Institute of Health Carlos III (ISCIII). This work has received funding from the Ministerio de Ciencia, Innovación y Universidades (SAF2017-89109-P; AEI/ FEDER, UE). Core funding is from the ISCIII and the Generalitat de Catalunya. We acknowledge support of the Spanish Ministry of Economy, Industry and
Competitiveness(MEIC) to the EMBL partnership, the Centro de Excelencia Severo Ochoa, the CERCA Programme /Generalitat de Catalunya, the Spanish Ministry of Economy, Industry and Competitiveness (MEIC)through the Instituto de Salud Carlos III and the Generalitat de Catalunya through Departament deSalut and Departament d’Empresa i Coneixement. We also acknowledge the Co-financing by theSpanish Ministry of Economy, Industry and Competitiveness (MEIC) with funds from the EuropeanRegional Develop-ment Fund (ERDF) corresponding to the 2014-2020 Smart Growth
OperatingProgram.
Availability of data and materials
The code and tutorial for inferring and comparing regulatory networks are available in GitHub under the licenseCreative Commons Attribution 4.0 International[63].
The original code is also deposited in Zenodo (DOI:https://doi.org/10.5281/ zenodo.2662478) [64].
Analysis notebooks for the Tabula Muris network analysis are hosted at
https://github.com/massonix/tabula_muris_networks.
Datasets used include type II diabetes [11], microglia and Alzheimer’s [12], Tabula Muris [10], brain cells [14], 10x genomics 1.3 million dataset of mouse brain cells [18].
Authors’contributions
HH and GI conceived the study. GI developed the computational framework and performed the network and statistical analysis. RM conducted the network analysis of mouse organs. HH and GI wrote the manuscript. All authors read and approved the final manuscript.
Ethics approval and consent to participate Not applicable
Competing interests
The authors declare that they have no competing interests.
Publisher’s Note
Springer Nature remains neutral with regard to jurisdictional claims in published maps and institutional affiliations.
Author details
1CNAG-CRG, Centre for Genomic Regulation (CRG), The Barcelona Institute of
Science and Technology, Baldiri Reixac 4, 08028 Barcelona, Spain.2Universitat Pompeu Fabra (UPF), Barcelona, Spain.
Received: 14 November 2018 Accepted: 8 May 2019
References
1. Zappia L, Phipson B, Oshlack A. Exploring the single-cell RNA-seq analysis landscape with the scRNA-tools database. PLoS Comput Biol. 2018;14:e1006245. 2. Zeisel A, Hochgerner H, Lönnerberg P, Johnsson A, Memic F, van der
Zwan J, et al. Molecular architecture of the mouse nervous system. Cell. 2018;174:999–1014.e22.
3. Emmert-Streib F, Dehmer M, Haibe-Kains B. Gene regulatory networks and their applications: understanding biological and medical problems in terms of networks. Front Cell Dev Biol. 2014;2 [cited 2018 Oct 12]. Available from:
https://www.ncbi.nlm.nih.gov/pmc/articles/PMC4207011/.
4. Thompson D, Regev A, Roy S. Comparative analysis of gene regulatory networks: from network reconstruction to evolution. Annu Rev Cell Dev Biol. 2015;31:399–428.
5. Fiers MWEJ, Minnoye L, Aibar S, Bravo González-Blas C, Kalender Atak Z, Aerts S. Mapping gene regulatory networks from single-cell omics data. Brief Funct Genomics. 2018;17:246–54.
6. Sonawane AR, Platig J, Fagny M, Chen C-Y, Paulson JN, Lopes-Ramos CM, et al. Understanding tissue-specific gene regulation. Cell Rep. 2017;21:1077–88. 7. Guo M, Wang H, Potter SS, Whitsett JA, Xu Y. SINCERA: a pipeline for
single-cell RNA-Seq profiling analysis. PLoS Comput Biol. 2015;11:e1004575. 8. Lim CY, Wang H, Woodhouse S, Piterman N, Wernisch L, Fisher J, et al. BTR: