6
I
January 2018
A Survey on Different Techniques for Epilepsy
Seizures Detection in EEG
C.V. Banupriya1, Dr. D. Deviaruna2 1
PhD Scholar, Dr.NGP Arts and Science College, Department of Computer science, Coimbatore, India 2
Assistant Professor, Dr.NGP Arts and Science College, Department of Computer Applications, Coimbatore, India
Abstract: Epilepsy is a constant neurological disorder of the brain, described by regular seizures, i.e., abnormal activities.
Seizures are the most important indication of epilepsy, which is one of the most regular neurological disorders. An
electroencephalogram (EEG) is a test out used to evaluate the electrical activity in the brain, and is widely used in the detection
and study of epileptic seizures. Hence, it is critical to develop a quantitative method to automatically classify the normal and
epileptic brain activities. Several techniques have been developed for straightening out the important features of seizures present in EEGs. In the paper reviews epilepsy recognition algorithms developed in the last decade. In general terms, various techniques based on the wavelet transforms, entropy’s, decomposition, wavelet theory, and active analysis are surveyed in the field of epilepsy recognition. A presentation comparison of the reviewed algorithms is also performed. Epilepsy recognition research is oriented to build up non-persistent and accurate methods to allow precise and quick diagnoses. For this point, the occurrence components of the EEG are extracted by using the discrete wavelet transform (DWT) and parametric methods based on autoregressive (AR) model. Both these two feature extraction methods are apply to the input of machine learning classification algorithms such as some Neural Network algorithms, Support Vector Machines (SVM) and k-Means clustering. The need of regularity of the methods in the seizure detection field is an emerging problem that has to be solved to allow homogenous comparisons of detector performance.
Keywords: Epilepsy, EEG, Seizures, DWT, Classification, Performance
I. INTRODUCTION
Epilepsy is a constant neurological disorder of the brain that affects more or less 50 million people worldwide. According to the World Health Organization (WHO), epilepsy is characterized by frequent seizures, which are objective reactions to abrupt, usually concise, too much electrical discharges in a group of brain cells [1]. In the framework of epilepsy monitoring, two types of seizure have to be considered, namely behavioral and electrographic. A behavioral seizure is defined as the clinical manifestations of epilepsy, as alleged by the patient, seen by an observer, or recorded on video. An electrographic (or electroencephalographic (EEG)) seizure is defined as an abnormal paroxysmal EEG pattern. In several cases, there is dissociation between behavior and EEG signals [2]. In cooperation types of epileptic seizures can happen at all ages. Widespread epileptic seizures can be subdivided into nonexistence (petit mal) and tonic-clonic seizures [3]. In epilepsy the ordinary pattern of neuronal activity becomes disturbed, causing strange feelings, emotions, and behavior, or sometimes convulsions, muscle spasms and loss of consciousness [4]. There are various possible causes of epilepsy. Something that scares the normal sample of neuron activity ranging from infection to brain damage to abnormal brain development can lead to seizures .Epileptic seizures are manifestations of epilepsy [5].
Regular EEG seizure finding, quantification, and recognition have been areas of worry and study within the clinical, physics, and engineering communities since the 1970s. In the most recent couple of years, the EEG analysis was mostly focused on epilepsy seizure detection diagnosis. A seizure detection system can be separated into three stages: data acquisition and preprocessing, processing and feature extraction, and classification.
The rest of the paper is organized in a manner that each block of the classification framework is discussed in a separate section. Section II presents the description of the related methods as well as the EEG data used for the experiment. Finally, the last section provides conclusion of the work.
II. RELATEDWORK
saturation artifacts. Pressure group artifacts were discarded using a threshold; Intracranial EEG divisions containing a signal with amplitude of better than 1.5mV were considered as having pressure group artifacts. H. Adeli et.al [7], a wavelet filter that requires the frequency at ease to be limited to the 0-60 Hz band is used, so the EEG is band limited to the preferred band by convolving with a low-pass finite impulse response (FIR) filter.
S. Tong et.al [8], Independent component analysis (ICA) is particularly used for artifact cancellation. ICA identifies sources; in this case an artifact present in the EEG signal, based on screen source separation (BSS) and separates them from the EEG based on their geometric independence. Varsavsky. I et.al [9], the pre-processing slab also normalizes the signal to make the data equivalent with those recorded by another gaining system or from a dissimilar patient. An example of this is locating all the data in given amplitude range, permitting the signals to be measure up to directly.
S Sigurdsson et.al [10], in time-domain techniques to identify EEG seizures, there is a want to study discrete time sequences of EEG epochs. This study can be expert through histograms of the epochs. Runarsson and Sigurdsson offered a simple time-domain seizure finding method that is based on tracing repeated peaks and minima in the signal part at hand and calculate approximately the histograms for two variables: the amplitude variation and time division between peak values as well as minima. The features used for classification of an epoch as an attack (Seizure) or Non attack are the estimated values of the histogram tubs. The authors used a Machine Learning algorithm SVM Classifier for this assignment and reached an standard sensitivity of about 90% on self-recorded data.
J Yoo et.al [11], one more approach to compact with the EEG seizure recognition method in time domain is to compute the signal force during attack (seizure) and non-seizure periods. An improved treatment to the energy evaluation approach is to guess the energies of the signal sub-bands not the signal as a complete in order to assemble a more discriminative feature Vector. They used a collection of seven band-pass filters wrapping the frequency range from 2 to 26 Hz on eight channels of the development EEG signals. Eight highly active analog channels, classification processor, and a 64-KB SRAM have been incorporated in the SoC. A long-period seizure checking and storage tool was built. The authors used a Support Vector Machine as a classifier with a gain and bandwidth (GBW) controller to complete real-time gain and bandwidth edition to analog front end (AFE) in order to maintain a high accuracy. This classifier is well-matched for the hardware performance. The SoC was tested on CHB-MIT scalp EEG database and it was demonstrated in the existence of a rapid eyeball blink giving an accuracy of 84.4% with 2.03 μJ/classification power.
A Dalton et.al [12], another approach to pact with time-domain seizure finding is to develop some discriminating data between Seizure (attack) and non-seizure epochs. Developed a body senor network (BSN) that can examine and identify epileptic seizures based on data extracted from time-domain signals .These data include the mean, variance, zero-crossing rate, entropy, and autocorrelation with pattern signals. For autocorrelation evaluation, they adopted a dynamic time warping (DTW) move toward for best position between the signal segments to be tested and the template signal. The authors offered a network to be implanted in wearable kinematic sensors and an N810 Internet tablet. Statistics were recorded from the topics using kinematic sensors such as triaccelerometer, gyroscope, and magnetic sensor for physical movement monitoring. This method was, then, commercially spread and a Body Sensor Network (BSN) was residential on a Mercury platform. The sensitivity of the proposed method for a dataset of 21 seizures (attacks) was found to be 91% with a specificity of 84% and battery life span of 10.5 h.
Dr. P.K. Kulkarni et.al [13], the Fourier transform (FT) methods of repeated EEG processing are based on previous observations that the EEG scale contains some feature waveforms that decrease for the most part within four frequency bands. Such methods have verified positive for different EEG characterizations, but fast Fourier transform (FFT), go through from large noise understanding. Parametric methods for power scale evaluation such as autoregressive (AR), decreases the spectral loss problems and provides better frequency decision. Ever since the EEG signals are non-stationary, the parametric methods are not fitting for frequency decomposition of these signals.
Samanwoy Ghosh-Dastidar et al [15], a wavelet-chaos-neural network methodology for classification of electroencephalograms (EEGs) into well and interracial EEG. In sort to decompose the EEG into delta, theta, alpha, beta, and gamma sub-bands the wavelet study is utilized. Three factors are used for EEG representation: standard deviation (quantifying the signal variance), correlation dimension, and largest Lyapunov exponent (quantifying the non-linear chaotic dynamics of the signal). The classification precisions of the following techniques are compared: 1) unsupervised - means clustering; 2) linear-quadratic-discriminant analysis (LQDA); 3) radial-basis-function neural net-work (RBF); 4) Levenberg–Marquardt back propagation neural network (LMBPNN). The research was accepted out in two phases with the goal of minimizing the computing time and output scrutiny, band-specific scrutiny and mixed-band scrutiny. In the second part, over 500 different combinations of mixed-band feature spaces com-prising of promising parameters from part one of the research were examined. It is determined that all the three key components the wavelet-chaos-neural network methodologies are significant for enhancing the EEG classification accuracy. Sensible combinations of parameters and classifiers are essential to entirely discriminate between the three types of EEGs. The result of the methodology evidently let know that a exact mixed-band feature space consist of nine parameters and LMBPNN result in the maximum classification accuracy, a high rate of 96.7%.
William J et.al [16], the effectiveness of utilizing an ANN in order to conclude epileptic seizure occurrences for patients with lateralized bursts of theta (LBT) EEGs. By means of the inspection of records of 1,500 consecutive adult seizure patients training and test cases are achieved. Due to the enlargement of the ANN categorization models the small resulting group of 92 patients with LBT EEGs requisite the usage of a jackknife method. Evaluations of the ANNs are for accuracy, specificity, and sensitivity on categorization of each patient into the exact two-group categorization: epileptic seizure or non-epileptic seizure. By means of eight changeable of the innovative ANN model produced a categorization accuracy of 62%. Accordingly, an adapted factor analysis, an ANN model using just four of the original variables attained a categorization accuracy of 68%.
Donald Yu-Chun Lie et.al [17], begin a neural network algorithm that relies primarily on the point field distribution. Multi Layer Perceptron networks with the amount of input and hidden nodes equal to the amount of channels in the record and a single output node are used. Five bipolar 8 channel records from the EMU with durations ranging from 7.1 to 23.3 min are used for training and testing. Two networks are trained on only the angles of the spike’s half-waves, and there is no notion of background environment. The first uses the gradient of the half-wave before the spike’s apex for all 8 channels as inputs, and the second uses the gradient after the apex. The output of the algorithm is a slanted combination of the two network outputs with a rate near 1.0 representing a spike has been found. The time (not specified) of the spike half waves is permanent so that no waveform decomposition is required. The algorithm falls along the data one sample at a moment and identifies a point when the output is greater than a threshold value (e.g. 0.9). The method requires a separate network for each patient and spike foci, so 7 networks were trained because two of the patients had autonomous foci. The training required 4–6 example spikes and the non spikes were created by statistical variation resulting in 4 times additional nonspikes. Even though this method does not appear to be well matched for general detection, it might be a hopeful method for finding similar events.
Hojjat Adeli et.al [18], have presented a wavelet methodology for analysis of EEGs and delta, theta, alpha, beta, and gamma sub-bands of EEGs. In the appearance of the correlation dimensions (CD, representing system complexity) and the largest Lyapunov exponent (LLE, representing system chaoticity) the nonlinear dynamics of the original EEGs are computed. The innovative wavelet-based methodology isolated the changes in CD and LLE in specific sub-bands of the EEG. The methodology was valuable to three diverse groups of EEG signals: healthy subjects, epileptic subjects during a seizure-free interval (interictal EEG), and epileptic issues during a seizure (iEEG).The success of CD and LLE in distinguishing between the three groups is observed based on statistical consequence of the variations. It has been noted that in the values of the factors acquired from the original EEG there may not be important differences, differences may be recognized when the factors were employed in conjunction with particular EEG sub-bands and proficient that for the higher frequency beta and gamma sub-bands, the CD distinguished between the three groups, in dissimilarity to that the lower frequency alpha sub-band, the LLE distinguished between the three groups.
M. Akin et.al [19], have attempted to discover a new solution for diagnosing the epilepsy. For this aspire, the Wavelet Transform of the EEG signals have taken, and the delta (δ), theta (θ), alpha (α), and beta (β) sub frequencies are extracted. Depending on these subordinate frequencies an artificial neural network has been residential and trained. The accurateness of the neural network outputs is too elevated (97% for epileptic case, 98% for healthy case, and 93% for pathologic case that have been tested). This means that this neural network identifies the fitness conditions of the patients around as 90 of 100. From this point we can say that purpose of this theoretical study will be supportive for the neurologists when they diagnose the epilepsy.
based on a multi resolution, multi-level analysis and Artificial Neural Network (ANN) approach. The signal on every EEG channel is decomposed into six subordinate bands using a non-decimated Wavelet Transform. Each subordinate band is analyzed by using a nonlinear power operator, in order to identify spikes. A factor extraction stage extracts the factors of the detected spikes that can be given as the input to Artificial Neural Network (ANN) classifier. The classification is evaluated on testing data from 81 patients, totaling more than 800 hours of recordings. 90.0% of the epileptic measures were correctly detected and the finding rate of non epileptic seizure events was 98.0%.
Sutrisno et.al [21], have attempt to find the seizure prediction algorithm based on take out Shannon entropy from electroencephalography (EEG) signals. The K-nearest neighbor (KNN) technique is used to constantly monitor the EEG signals by comparing the existing sliding window with normal and pre-seizure baselines to predict the future seizure. Both baselines are always updated based on the most recent prediction result using distance-based (DB) method. This algorithm is capable to predict correctly 42 from 55 seizures (76 %), tested using up to 570 hours EEG taken from the MIT dataset. With its ease and fast processing time, the proposed system can be easily implemented in any embedded system such as in FPGA board or mobile devices.
Alejandro Baldominos et.al [22], have illustrated and implement an power-based seizure detection algorithm which runs over electroencephalography (EEG) signals. Because this technique covers different parameters that significantly affect the recognition performance, we will apply genetic algorithms (GAs) to optimize these parameters in order to get better the detection accuracy. They express the GA setup, including the encoding and fitness function. Finally, we calculate the implemented algorithm with the optimized parameters over a subset of the CHB-MIT Scalp EEG Database, a public data set available in PhysioNet’s. Results have shown to be very different, attaining almost ideal accuracy for some patients with very low false positive rate, but failing to correctly detect seizures in others. Thus, the restrictions found for power-based seizure detection are discussed and some measures are proposed to address these issues [22].
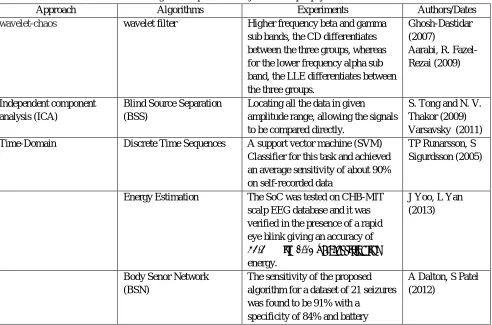
[image:5.612.64.556.403.728.2]Different data mining methods covered in this survey are listed in the following Table.I. The table also includes the approaches employed, the tentative results and the dates and authors of the approaches.
Table I
List Of Data Mining Techniques Currently Used In Epilepsy Seizures Detection
Approach Algorithms Experiments Authors/Dates
wavelet-chaos wavelet filter Higher frequency beta and gamma
sub bands, the CD differentiates between the three groups, whereas for the lower frequency alpha sub band, the LLE differentiates between the three groups.
Ghosh-Dastidar (2007)
Aarabi, R. Fazel-Rezai (2009)
Independent component analysis (ICA)
Blind Source Separation (BSS)
Locating all the data in given amplitude range, allowing the signals to be compared directly.
S. Tong and N. V. Thakor (2009) Varsavsky (2011)
Time-Domain Discrete Time Sequences A support vector machine (SVM)
Classifier for this task and achieved an average sensitivity of about 90% on self-recorded data
TP Runarsson, S Sigurdsson (2005)
Energy Estimation The SoC was tested on CHB-MIT
scalp EEG database and it was verified in the presence of a rapid eye blink giving an accuracy of 84.4% with 2.03 μJ/classification energy.
J Yoo, L Yan (2013)
Body Senor Network (BSN)
The sensitivity of the proposed algorithm for a dataset of 21 seizures was found to be 91% with a
specificity of 84% and battery
lifetime of 10.5 h.
Fourier Transform Artificial Neural Networks
(ANN)
The classification percentages of AR with MLE on test data are over 92%. As a result of employing FFT as preprocessing in the neural net an average of 91% classification is attained.
Abdulhamit Subasi (2005)
Wavelet-Chaos Neural Network The result of the methodology
clearly let know that a specific mixed-band feature space comprising of nine factors and LMBPNN result in the highest classification accuracy, a high value of 96.7%.
Samanwoy Ghosh-Dastidar (2007)
Spike Field Distribution Probabilistic Neural
Network
The algorithm slides along the data one sample at a time and identifies a spike when the output is greater than a threshold.
Gabor and Seyal (2010)
Wavelet Transform Artificial Neural Network
(ANN)
The accuracy of the neural network outputs is too high.
M.Akin, M.A.Arserim (2001) Artificial Neural Networks
(ANN)
The system is evaluated on testing data from 81 patients, totaling more than 800 hours of recordings. 90.0% of the epileptic events were correctly detected and the detection rate of non epileptic events was 98.0%.
Ganesan.M (2010)
Shannon Entropy K-Nearest Neighbor (KNN) With its simplicity and fast
processing time this method can be easily implemented in any embedded system such as in FPGA board or mobile devices.
Sutrisno (2017)
Energy-Based Genetic Algorithms Results have shown to be very
diverse, attaining almost perfect accuracy for some patients with very low false positive rate, but failing to properly detect seizures in others.
Alejandro Baldominos (2017)
III. CONCLUSIONS
few seconds that in a one of an hour long) used the implementation and testing the algorithms. In general terms, a good epilepsy detector should show at least 80% sensitivity and specificity.
REFERENCES
[1] World Health Organization, 2011.Available: http://www.who.int/mediacentre/?factsheets/fs999/en/. [2] J. Gotman, “Automatic detection of seizures and spikes,” J. Clin. Neurophysiol., 16: 130-140, 1999
[3] James, C. J. “Detection of epileptic form activity in the electroencephalogram using the electroencephalogram usingUniversity of Canterbury, Christchurch, 1997.
[4] J.D. Bronzino, “Biomedical Engineering Handbook”, New York: CRC Press LLC, Vol. I, 2nd edition 2000.
[5] Hojjat Adeli, Samanwoy Ghosh and Dastidat, “Automated EEG Based Diagnosis of Neurological Disorders”, CRC Press; 1 edition, 2010
[6] Aarabi, R. Fazel-Rezai and Y. Aghakhani, “A fuzzy rule-based system for epileptic seizure detection in intracranial EEG,” Clin. Neurophysiology, 120: 1648-1657, 2009.
[7] H. Adeli, S. Ghosh-Dastidar and N. Dadmehr, “A Wavelet-Chaos methodology for analysis of EEGs and EEG sub bands to detect seizure and epilepsy,” IEEE Trans. Biomed. Eng., 54: 205-211, 2007
[8] S. Tong and N. V. Thakor (Ed.), “Quantitative EEG Analysis Methods and Clinical Applications”, Norwood: Artech [9] Varsavsky, I., Mareels and M. Cook, “Epileptic seizures and the EEG”, Boca Raton: CRC Press, 201
[10] TP Runarsson, S Sigurdsson,” On-line detection of patient specific neonatal seizures using support vector machines and half-wave attribute histograms,in The International Conference on Computational Intelligence for Modelling,Control and Automation, and International Conference on Intelligent Agents”,Web Technologies and Internet Commerce,pp. 673–677. 28–30 Nov 200
[11] J Yoo, L Yan, D El-Damak, MA Bin Altaf, AH Shoeb, AP Chandrakasan,“An 8 channel scalable EEG acquisition SoC with patient-specific seizure
[12] A Dalton, S Patel, AR Chowdhury, M Welsh, T Pang, S Schachter, G Olaighin,P Bonato,“Development of a body sensor network to detect motor patterns of epileptic seizures”,IEEE Trans. Biomed. Eng. 59(11), 3204–3211,2012
[13] Sharanreddy.M and Dr.P.K.Kulkarni,“Review of Significant Research on EEG based Automated Detection of Epilepsy Seizures & Brain Tumor”,International Journal of Scientific & Engineering Research, Volume 2, Issue 8, August-2011
[14] Abdulhamit Subasi, M. Kemal Kiymik, Ahmet Alkan, and Etem Koklukaya, "Neural Network Classification Of EEG Signals By Using AR With MLE Preprocessing For Epileptic Seizure Detection", Journal of Mathematical and Computational Applications, Vol. 10, No. 1, pp. 57-70, 2005
[15] Samanwoy Ghosh-Dastidar, Hojjat Adeli, and Nahid Dadmehr, "Mixed-Band Wavelet-Chaos-Neural Network Methodology for Epilepsy and Epileptic Seizure Detection", IEEE Transactions On Biomedical Engineering, Vol. 54, No. 9, pp. 1545-1551, September 2007
[16] Steven Walczak and William J. Nowack,"An Artificial Neural Network Approach to Diagnosing Epilepsy Using Lateralized Bursts of Theta EEGs", Journal of Medical Systems, Vol. 25, No. 1, pp. 9-20, February 2001
[17] Forrest Sheng Bao, Donald Yu-Chun Lie, and Yuanlin Zhang, "A New Approach to Automated Epileptic Diagnosis Using EEG and Probabilistic Neural Network", in Proceedings of the 2008 20th IEEE International Conference on Tools with
[18] Hojjat Adeli, Samanwoy Ghosh – Dastidar and Nahid Dadmehr, “A Wavelet-Chaos Methodology for Analysis of EEGs and EEG Sub-Bands to Detect Seizure and Epilepsy”, IEEE Transactions on Biomedical Engineering, Vol. 54, No. 2, pp. 205-211, February 2007
[19] M.Akin, M.A.Arserim, M.K.Kiymik, I.Turkoglu, “A New Approach for Diagnosing Epilepsy by using Wavelet Transform and Neural works”, Proceedings – 23rd Annual Conference – IEEE/EMBS Oct.25-28, 2001
[20] Ganesan.M, Sumesh.E.P, Vidhyalavanya.R “Multi-Stage, Multi-Resolution Method for Automatic” International Journal of Signal Processing, Image Processing and Pattern Recognition, Vol 3, No 2, June, 2010
[21] Sutrisno Ibrahim, Ridha Djemal, Abdullah Alsuwailem, and Sofien Gannouni, “Electroencephalography (EEG)-based epileptic seizure prediction using Entropy and K-nearest neighbor (KNN)” Communications in Science and Technology in 2017.