Experimental Investigation of the Effect of Flow
Angle of Attack on the Rate of Scour around the
Slotted Bridge Pier at Different Levels of River
Bend
Ebrahim Nohani1*, Mohammad Heidarnejad2
1- Department of hydraulic Structures, Dezful Branch, Islamic Azad University, Dezful, Iran. 2- Department of Irrigation Structures, Ahvaz Branch, Islamic Azad University, Ahvaz, Iran.
Abstract—Scour around the bridge piers is known as a major risk that is followed by millions of dollars of costs in addition to the casualties for the replacement and improvement of bridges. Nowadays, there are different ways to control scour around the bridge pier such as using the riprap, collar, slot, or using a combination of them. In this study, the effect of slot on scour reduction around the bridge pier at 180° river bend was studied. Therefore, four models of bridge pier with slot and one without slot at three positions of 60°, 90°, and 120°from the bend of 180° and four flow angles of attack at pier as 0°, 15°, 30°, and 45°were studied. The results showed that as the flow angle of attack at pier increased, the scour depth increased. Moreover, with regard to the greater depth of scour in the first half of the bend, it is recommended to construct bridges in the second half of the bend if it is needed to construct bridge with slotted piers in the river bend.
Keywords— scour, bridge pier, river bend, slot, angle of attack.
I. INTRODUCTION
Bridge pier scour occurs when the fast flow of water carries away large amounts of earth materials from around the bridge pier so that the extreme removal of the materials can lead to the failure of this structure[1]. The main factors causing local scour are the secondary flows including wave vortex, trailing vortex, horseshoe vortex, and bow wave. Wake vortex system acts like a vortex and moves the sediments from the bed floor upwards. The power of this system depends on the shape of pier and water velocity. In case of the lack of horseshoe vortex system, this system creates a large hole in the downstream flow. Trailing vortex system is not actually very important and usually occurs in completely submerged piers. Horseshoe vortex system is developed by the rupture of flow along the upstream pier. In other words, this system is developed when a high pressure gradient is formed due to flow attack against the pier and the shape of pier is very important in the formation and strength of this system. Bow wave system is formed on the surface of water and its rotation direction is opposite to the horseshoe vortex system. The bow wave system is important in shallow flows where the flow hits the pier and modifies the strength of downward flow. Different types of systems available around the bridge pier are displayed in Figure 1.
Fig1. Flow pattern around the pier
1-Dissipator 2-Inlet canal 3-Outlet canal 4-Ground water reservoir 5-Tail Gate 6-Centerifugal Pump 7-Transition Pipe 8-Surge Tank 9-Stilling Basin 10-Triangular Weir
that the proposed method might severely reduce the required period of time for doing the experiments (from weeks to hours) and remove the lateral doubts about the equilibrium scour. Chiew[3] studied the protection of bridge piers against scour using slot and collar. The results of his experiments show that using a single slot by itself can reduce the rate of scour up to 20% especially if the slot is near the surface of water or bed, and using a combination of slot and collar can reduce the scour depth more. Heydarpour et al. [4] studied the scour of group piers of circular bridge using slots in direct channels. The results of their experiments showed that group piers of the bridge had a great influence on the scour depth in front of the pier compared to a single pier. They also concluded that the effect of slot in reducing the scour depth increased as the pier area increased. Kumar et al.[5] investigated the reduction of local scour around the bridge piers of a direct channel using slots and collars. The results of their experiment showed that a slot was effective in reducing the scour, but when the flow approaching the slotted pier had large deviation, the slotted pier would not be effective. Mohammed et al.[6] studied the physical model of local scour around the bridge piers in the erosive bed. They simulated the main variables in local scour around the bridge piers and found that selecting appropriate width of pier and its shape could help reduce the local scour. Zarrati et al.[7] studied the reduction of local scour adjacent to the bridge piers in a direct channel using collar and riprap groups. The results of their experiments showed that the continuous compounds of collar and riprap reduced the rate of bridge piers scour by 50% to 60%. Among the abovementioned methods, the slot near the bed by creating horizontal flow derives away from the pier the downward stream which is the main cause of horseshoe vortex and one of the causes of erosion around the pier and the slot near the water surface reduces the effective depth of stream and decreases the gradient pressure. As a result, the downward stream is reduced and the scour depth will reduce. Numerous studies have already been done in direct channels. However, in some special cases, due to the need for a specific project or due to the river changes the bridges are constructed over the river bend. This research aims at experimental investigation of the effect of bridge pier slots on the scour at different positions of 180° river bend.
II. MATERIALANDMETHOD
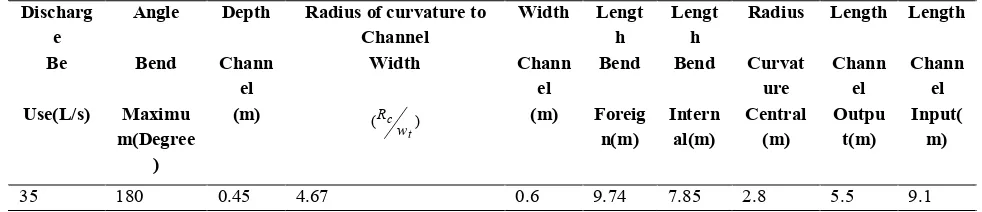
[image:3.612.119.495.388.518.2]In this research, in order to investigate the local scour, a physical hydraulic model was used under the conditions of clear water in cohesionless materials. The physical model consists of a rectangular flume with 180°bend. The model details including the length, width, radius of bend, etc are displayed in Figure 2 and Table 1.
Fig. 2 Layout of Physical hydraulic model
TABLE 1.DETAILS OF THE PHYSICAL HYDRAULIC MODEL
In all the experiments in order to remove the effect of channel walls on local scour, as recommended by Chiew and
Length Length
Radius Lengt
h Lengt
h Width Radius of curvature to
Channel Depth
Angle Discharg
e
Chann el Chann
el Curvat
ure Bend
Bend Chann
el Width
Chann el Bend
Be
Input( m) Outpu
t(m) Central
(m) Intern
al(m) Foreig
n(m) (m)
) (
t c
w R (m)
Maximu m(Degree
) Use(L/s)
9.1 5.5
2.8 7.85 9.74
0.6 4.67
0.45 180
[image:3.612.62.553.597.703.2]Melville[8], the pied diameter should not be more than 10% of the channel width. Therefore, in order to determine the effect of slot in reducing the local scour around the bridge pier, a cylinder with diameter of 60 mm (b) was used as the pier model. This model was designed based on clear water scour so that the maximum depth of scour could be seen[9]. Clear water scour mechanism is so that the bed sediments do not move as the upstream flow approaches. In other words, when the sediment goes off the scour hole it is not filled again with the sediments of approaching flow while in live bed scour the scour hole is filled again by the sediments which are transferred by upstream flows[10,11]. Clear water scour occurs for the average flow rate (u)
and the threshold speed for the bed sediment (uc) under the condition of 1
c
u
u On the contrary, the mobile bed scour occurs
when 1
c
u
u Melville and Chiew [12]. In contrast, moving bed scouring occurs under 1
c
u
u condition, however maximum
scour occurs when uucand in clear water conditions. In other words, the scour depth in clear water, unlike mobile bed
conditions, occurs at a longer period and reaches its maximum[13]. To calculate the critical velocity and the
c
u
u ratio, a
number of different experiments and methods have been proposed. However in this study, Chang,s[14] method was employed. According to this method, the curves and diagrams suggested by Neill [15] are transformed into a series of relationships to calculate the critical velocity based on the flow depth and the average diameter of the particles. These relationships are:
Ford500.03
m :
6 5013 15 .
11 y d
k
uc u (1)
For0.03(m)d500.0003(m):
0.35 50 111.5y dk
uc u x (2)
Value of x the relationship is to be calculated:
20 . 0 50 2
123 . 0
d k
x u (3)
For0.0003d50:
ucku y (4)
cu
Critical velocity,
ms y flow depth (m),50
d = average size of sediment particles
(m)ku 0.55217,ku10.30480.65x,ku2 0.788. All the parameters affecting the local scour around the slotted bridge pier and
at 180° river bend are considered as the following:
s t e c p l A
s f d ybw tt uu w y
d ,, , 50, , , , , , , , , , , (5)
s
d Scouring depth,Kinematics viscosity,Water density, d50sediment size (assumed uniform 50 s sediment),
s
sediment density, y = water depth, b = pier diameter, wt section width, t= time, te equilibrium time, uaverage flow
velocity, ucthreshold velocity for bed sediment, p 180-degree bend position, w = slot width, ylslot length and
A
angle of the flow approaching the slotted pier.
Creating perfect sand bed is the key point in experiments because any roughness or defect in the channel bed can cause the sudden and untimely development of bed. Researchers believe that if the ratio of pier depth to the size of particles is more than 25 the effect of particles size on the scour depth will be negligible[16]. In this research a layer of sand with a thickness of 15 cm and diameter of 2 mm was used. Using sediments in this size prevents the development of deformed bed such as ripple or dunes which might cause problems in estimating the scour depth. In addition, temperature and its effects on the changes in water density and viscosity which may influence the scouring depth have been assumed insignificant because studies have shown that there are not significant differences in scouring depth at different temperatures[17]. Consequently, with respect to the above-mentioned conditions, we can consider (ds) only as a function of the following parameters:
t e c p l A
s f y bw tt u u w y
d , , ,, , , , , , , (6)
p A
l t e c s
y y w w t t u u f b d
,
, , ,
, (7)
In order to investigate the effect of slot on the scour, four different slots were evaluated and the width of each slot was considered to be equal to 0.25 of pier diameter. The length of the desired slots is YL and the depth of uniform flow is Y (figure 3). The characteristics of different piers of the studied model and the slots are shown in Table 2 based on pier diameter (b). In this table, the bed level is considered as the base level.
Fig 3. Slotted bridge pier
TABLE 2: TYPES OF PIER MODEL
height slot pier status and slot
Number pier
0-2b slot pier and slot length of the bed surface to surface 0-2b
1
b/2-3/2b slot pier and slot length of 1 / 2 pier diameter of 3 / 2 diameter
pier b/2-3/2b 2
0-b slot pier and slot length of the bed surface to the pier diameter
0-b 3
b-2b slot pier and slot length of the pier diameter equal to two pier
diameter b-2b 4
0 regular pier without slot
0
The equilibrium time plays an important role in the results of a scour experiment[18]. This time due to the need to ensure the equilibrium conditions is a long time and the experiments take a long time to be done. The maximum time for doing the experiments was considered to be 2 hours and the increase of scour depth mainly after 2 hours is very trivial. Bozkus et al.[19] considered the maximum time for the experiments as two hours and found that the amount of increase in the depth of the scouring hole is insignificant after two hours. The scour equilibrium time should be considered in such a way that the scour depth won't increase more than 1 mm during a time period of 4 hours[20]. Melville[11] and Sheppard et al. [21] ended their experiments when the scouring depth was not more than 5% of the pier diameter over a 24-hour period. Kumar et al.[5] considered the time at which the changes in the scouring depth were not more than 1 mm, during a 3-hour period. In the present study, the equilibrium experiment was conducted under the most adverse conditions (discharge amounting to 31 liters per second and pier without slot). In the present research the mentioned slotted piers were experimented at an angle of attack (0°), in a position of the river bend (60°) and in different discharges of (22,25,28,31) litters per second. Then, among the four slots mentioned above, one of them was selected as the most appropriate considering the maximum reduction of scour rate. In order to investigate the effect of flow angle of attack at the scour depth around the slotted piers four different flow discharges (22, 25, 28, and 31 lit/sec) and each one at four angles of attack (0o, 15 o, 30 o, and 45 o) and three positions of the river bend (60 o, 90 o, 120 o) were used. Then the experiment was repeated for the pier without slot in the mentioned positions.
III.DISCUSSION
After doing the equilibrium experiment, its diagram shows that the maximum scour has nearly occurred after two hours and
then the curve is stable (figure 4). Table 3 illustrates the results of calculating the critical velocity and c
u
u ratio with the
Equilibrium Time 0 2 4 6 8 10 12
0 200 400 600 800 1000
Time(min) d s (c m ) ds(cm)main
FIG 4.EQUILIBRIUM TIME
TABLE 3:RESULTS OF THE CRITICAL VELOCITY RATIO
c
u
u CALCULATED BASED ON THE RELATIONSHIP 2
C U U C U 1 KU
X
2 KU
msU
2m A
cm H
ls Q N 0.69 0.79 0.88 0.97 0.44 0.44 0.44 0.44 0.688 0.688 0.688 0.688 0.336 0.336 0.336 0.336 0.788 0.788 0.788 0.788 0.305 0.347 0.388 0.430 0.072 0.072 0.072 0.072 23.43 24.67 25.82 26.89 22 25 28 31 1 2 3 4H is the height of equivalent flow resulted from the discharge stage in triangular weirs. Since the changes were
as
0.69 0.97
C
U
U , the clear water scour occurred. Time development diagram for the pier without slot and the piers with slot
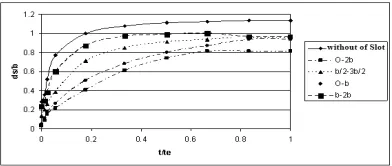
[image:6.612.152.461.72.207.2]at 60° position and flow discharge of 28 l/s is shown in Figure 5. Figure 5 shows that scour development is high in the first minutes and then gradually decreases until it reaches a stable state. As it is observed in Figure 5, among 4 types of slotted piers, type 1 (0-2b) has the lowest rate of scour. Moreover, comparison of the effect of piers slots shows that type 1 slot is more effective than the others. Scour depth change around the slotted piers at the angle of attack of 120° and bend of 180° is shown in Figure 6.
FIG 5.TIME DEVELOPMENT DIAGRAM FOR THE PIER WITHOUT SLOT AND THE PIERS WITH SLOT AT 60°POSITON AND FLOW DISCHARGE OF 28 L/S
0 0.2 0.4 0.6 0.8 1 1.2
0 15 30 45
Angle of attack,degree
d s /d s p U/Uc=0.97 U/Uc=0.88 U/Uc=0.79 U/Uc=0.69 kumar
FIG 6.SCOUR DEPTH CHANGE AROUND THE SLOTTED PIERS AT DIFFERENT ANGLES OF ATTACK
[image:6.612.136.552.260.334.2] [image:6.612.208.404.464.547.2] [image:6.612.192.422.586.689.2]Angle Of Attack:30 (Degree) 0 0.2 0.4 0.6 0.8 1 1.2 1.4
30 60 90 120 150
River Bend Position, Degree
d s/ b U/Uc=0.97 U/Uc=0.88 U/Uc=0.79 U/Uc=0.69
Angle Of Attack:45 (Degree)
0 0.2 0.4 0.6 0.8 1 1.2 1.4
30 60 90 120 150
River Bend Position, Degree
d s/ b U/Uc=0.97 U/Uc=0.88 U/Uc=0.79 U/Uc=0.69
Angle Of Attack:15 (Degree)
0 0.2 0.4 0.6 0.8 1 1.2 1.4
30 60 90 120 150
River Bend Position, Degree
d s/ b U/Uc=0.97 U/Uc=0.88 U/Uc=0.79 U/Uc=0.69
Angle Of Attack:0 (Degree)
0 0.2 0.4 0.6 0.8 1 1.2 1.4
30 60 90 120 150
River Bend Position, Degree
d s/ b U/Uc=0.97 U/Uc=0.88 U/Uc=0.79 U/Uc=0.69
increases, too which is consistent with the findings of Kumar[5] that if the flow approaching the slotted pier is derived a lot the slotted pier won't be effective. In order to investigate the interactive effect of flow angle of attack, the position of slotted bridge pier at 180°bend and different relative velocities, some experiments were carried out using type 1 slot at three positions of 60, 90, and 120° and different angles of attack as 0, 15, 30, and 45° the results of which are shown in Figure 7.
FIG7.MAXIMUM SCOUR DEPTH AT TYPE 1 SLOTTED PIER IN DIFFERENT POSITIONS AND FLOW ANGLES OF ATTACK
According to Figure 7, the maximum scour depth in all flow discharges occurred in the first half of the bend, i.e. at the level
of60and the minimum scour in all flow discharges occurred at the level of 120° with a tendency towards direct channel. This means that when the pier is placed into the bend the maximum scour depth around it increases compared to the straight direction. The point that should be noted about this diagram is that the maximum scour depth in the second half of the bend is largely close to the direct channel.
IV.CONCLUSION
In this study, the effect of flow angle of attack on the rate of scour around the slotted bridge pier at different levels of the river bend was investigated. The results showed that making slots in bridge piers would decrease the scour rate, so that among the four studied slots the slot which begins from the bed and continues to the water surface is more effective than the others. Moreover, the results showed that the scour depth is a function of time and at the primary times of the experiment the scour depth increases rapidly and then the increasing rate of scour depth slows down over time. The results also showed that as the flow angle of attack against the slotted pier increases from 0 to 45, the maximum rate of scour depth increases. In addition, the scour depth is a function of the ratio of average flow velocity
u to the threshold velocity of bed sediments movement
uc , sothat as the ratio increases, the performance of slots in reducing the scour decreases. Furthermore, with respect to the maximum amounts of scour depth in the first half of the river bend (60°position), it is recommended to construct bridges in the second half of the bend (angles between 90° until 120°) where the factors affecting the local scour are weaker, if it is needed to construct bridge with slotted piers in the river bend.
NOTATION
b Pier diameter
c
u Threshold velocity for sediment bed
y Flow depth
50
d The average particle size of sediment
s
d Depth Scouring
Kinematics viscosity Density of water
s
Density sedimentation
t
w Section width
t Time
e
t Equilibrium time
p
Position in bend
w Slot width
A
Flow-pier approach angle slot
l
y Slot length 4
c
R Curvature radius of the central bend
REFERENCES
[1] Annadale, GW, D.Ing. Scour Technology. MC Graw-Hill. 2006.419p.
[2] Chreties C, Simarro G, Teixeira L. New Experimental Method to Find Equilibrium Scour at Bridge Piers. Journal of Hydraulic Engineering. 2008; 134:1491-1495.
[3] Chiew YM. Scour Protection at Bridge Piers. Journal of Hydraulic Engineering. 1993; 118:1260-1269.
[4] Heydarpour M, Afzalimehr H, Khodarahmi Z. Local Scour Protection of Circular Bridge Pier Groups Using Slot. Journal of Agricultural Sciences and Natural Resources. 2007; 14:174-185.
[5] Kumar V, Rang Raju K G, Vittal N. Reduction of Local Scour around Bridge Piers Using Slots and Collars. Journal of Hydraulic Engineering. 1999; 125:1302-1305.
[6] Mohammed TA, Noor MJ, Ghazali AH, Yusuf B, Saed K. Physical Modeling of Local Scouring Around Bridge Piers in Erodable Bed. Journal of Engineering Science. 2007; 19:195-207.
[7] Zarrati AR, Nazariha M, Mashahir MB. Reduction of Local Scour in the Vicinity of Bridge Pier Groups Using Collars and Riprap. Journal of Hydraulic Engineering. 2006; 132:154-162.
[8] Chiew YM, Melville BW. Local scour around bridge piers. Journal of Hydraulic Research. 1987; 25(1):15-26.
[9] Breusers HNC, Nicollet G, Shen HW. Local scour around cylindrical piers. Journal of Hydraulic Research. 1977; 15(3):211-252.
[10] Dey S. Time-variation of scour in the vicinity of circular piers. Water & Maritime Engineering Journal, Proceedings of the Institution of Civil Engineers, Thomas Telford Journals, London. 1999; 136(2):67-75.
[11] Melville BW. Live bed scours at bridge piers. Journal of Hydraulic Engineering, ASCE. 1984; 110(9):1234-1247.
[12] Melville, BW, Chiew YM. Time scale for local scour at bridge piers. Journal of Hydraulic Engineering, ASCE. 1999; 125(1):59-65.
[13] Richardson EV, Davies SR. Evaluating scour at bridges. Rep. No. FHWA-IP- 90-017 (HEC 18), Federal Administration, U.S. Department of Transportation, Washington, D. C. 1995.
[14] Chang F, Maryland DOT. Maryland SHA Procedure for Estimating Scour at Bridge Abutment. Part 2-Clear Water Scour, ASCE, proc. Of the International Water Resources Engineering Conference, August, Water Resources Publications, LLC, Highlands Ranch.co. 1998.
[15] Neill CR. Guide to bridge hydraulics. Project Committee on Bridge Hydraulics, Roads and Transportation Association of Canada. University of Toronto Press, Toronto and Buffalo. 1973.
[16] Dennis A, Lyn E, Neseem A, Rama Chandra Rao, Altschaeffl AG. A Laboratory Sensitivity Study of Hydraulic Parameters Important in the Deployment of Fixed-in-Place Scour-Monitoring Devices. FHWA/IN/JTRP. 2000; 12. 37
[17] Melville BW, Coleman SE. Bridge scour. Water Resources Publications, LLC, Colorado, U.S.A. 2000.
[18] Fanzetti S, Larcan E, Mignosa P. Influence of tests duration on the evaluation of ultimate scour around circular piers. International Conference on the Hydraulic Modelling of Civil Engineering Structures, Organised and Sponsored by BHRA Fluid Engineering, University of Warwick , Coventry, England, September 22-24. 1982; 16 p.
[19] Bozkus Z, Osman Y. Effects of inclination of bridge piers on scouring depth. Journal of Hydraulic Engineering, ASCE. 2004; 130(8):827-832. [20] Ettema R. Scour at bridge piers. PhD Thesis, Auckland University, Auckland ,
[21] New Zealand. 1980.