DYNAMIC VIEWS OF STRUCTURE AND FUNCTION DURING HEART MORPHOGENESIS
Thesis by Arian S. Forouhar
In Partial Fulfillment of the Requirements for the Degree of Doctor of Philosophy
CALIFORNIA INSTITUTE OF TECHNOLOGY Pasadena, California
2006
Acknowledgments
The work presented here was generated from the efforts of an All-Star team. And since the game of basketball has taught me so much…here is my way of saying thank you.
The front office: Mory Gharib (Donald Sterling), Scott Fraser (John Wooden), Mary Dickinson (Shaquille O’Neal), Jay Hove (Antoine Walker), and Michael Dickinson (Rick Fox).
The starting lineup: Michael Liebling (Steve Nash), Julien Vermot (Manu Ginobili), John Dabiri (LeBron James), Reinhard Koster (Scottie Pippen), and Aaron Hawkey (Tim Duncan).
The bench: Mehrdad Zarandi (John Stockton), Anna Hickerson (Tracy McGrady),
Michele Milano (Ron Artest), Derek Rinderknecht (Gary Payton), Arash Kheradvar (Dirk Nowitzki), Sean Megason (Reggie Miller), David Koos (Ray Allen), Le Trinh (Karl Malone), Luca Caneparo (Jason Williams), Jian Lu (Smush Parker), Abbas Moghaddam (Vlade Divac), Ying Gong (Ed O’Bannon), Magdalena Bak (Gilbert Arenas), Chris Waters (Tony Parker), and Gabriel Acevedo-Bolton (Marcus Camby).
In the stands: Brian Zid (Dennis Rodman), Armin Sorooshian (Jason Terry), Danson Njoroge (Vince Carter), John Bird (Ben Wallace), Jordan Carlson (Jerry West), Marie Giron (Jason Richardson), Yezdan Badrakhan (Chris Anderson), and David Zito (Stephon Marbury)
Abstract
Congenital heart defects remain the most common birth defect in humans,
occurring in over 1% of live births. The high prevalence of cardiac malformations can be partially attributed to limited knowledge regarding the embryonic roots of the disease. A variety of congenital heart defects are thought to arise from combinations of genetic and epigenetic factors. In an effort to better understand this dynamic relationship, our study explores the structure and function of the developing heart and valves and examines hemodynamic factors influencing valvulogenesis. In order to study cardiac mechanics, we employed novel high-speed confocal microscopy and four-dimensional visualization techniques. A dynamic four-dimensional dataset describing heart and valve development along with blood flow patterns throughout cardiac morphogenesis is presented. Utilizing newly developed tools, we propose a novel pumping mechanism in the valveless
embryonic heart tube via elastic wave propagation and reflection. We show that this form of pumping leads to oscillatory shear stresses in the developing atrio-ventricular canal, a phenomenon that had not previously been documented. An in vivo method to modulate trans-valvular oscillatory flows is described and used to test our hypothesis that
Table of Contents
Acknowledgements iii
Dedication v
Abstract vi
Table of Contents vii
List of Figures x
CHAPTER 1: Prologue 1
1.1 Introduction 1
1.2 Organization 3
1.3 Goals 5
1.4 Chapter References 7
CHAPTER 2: Vertebrate Heart Development 8
2.1 Introduction 8
2.2 Vertebrate Heart Morphogenesis 8
2.3 Embryonic Zebrafish as a Model 9
2.4 Zebrafish Heart Morphogenesis 11
2.5 Factors Influencing Heart Morphogenesis 13
2.5.1 Genetic Contributions 13
2.5.2 Epigenetic Contributions 14
2.6 Discussion 17
2.7 Chapter References 19
CHAPTER 3: Zebrafish Cardiac Imaging Tools and Techniques 22
3.1 Introduction 22
3.2 Zebrafish Preparation 23
3.3 Fluorescent Contrast Agents 26
3.3.1 Transgenic Lines 26
3.3.1.1 Tg(gata1:GFP) 27
3.3.1.2 Tg(cmcl2:GFP) 28
3.3.1.3 Tg(tie2:GFP) 29
3.3.2 Vital Dyes 31
3.4 High Speed Confocal Microscopy 32
3.5 Four-Dimensional Reconstructions 34
3.5.1 Data Collection 35
3.5.2 Algorithm 36
3.5.3 Limitations 38
3.5.4 Conclusions 40
3.6 Four-Dimensional Data Analysis 41
3.6.1 Volume Measurements 41
3.6.2 Cardiac Cell Tracking 43
3.6.3 Qualitative Flow Analysis 45
3.7 Blood Flow Visualization 46
3.7.1 Digital Particle Imaging Velocimetry 47
3.8 Chapter References 51
CHAPTER 4: Embryonic Heart Tube Biomechanics 53
4.1 Introduction 54
4.2 Embryonic Heart Tube is Not Peristaltic 55
4.2.1 Bidirectional Wave 55
4.2.2 Blood Velocity Exceeds Heart Wall Wave Speed 57
4.2.3 Nonlinear Frequency-Flow Relationship 58
4.3 Embryonic Heart Tube is a Dynamic Suction Pump 59 4.3.1 Resonance Peaks in Frequency-Flow Relationship 59 4.3.2 Reflections at Mismatched Impedance Sites 60
4.3.3 Pressure-Flow Relationship 61
4.3.4 Net Flow Reversal 62
4.4 Materials and Methods 64
4.4.1 Imaging Parameters 64
4.4.2 Quantitative Flow Analysis 64
4.4.3 Pressure Variation Estimates 65
4.5 Discussion and Perspectives 68
4.6 Chapter References 71
Chapter 5: Oscillatory Flow and Valvulogenesis 72
5.1 Introduction 72
5.2 Methods 75
5.2.1 High-Speed Confocal Imaging 75
5.2.2 Brightfield Imaging 75
5.2.3 Discrete Flow Representation 75
5.2.4 Methods to Control Heart Rate 76
5.2.4.1 Lidocaine Treatment 76
5.2.4.2 Temperature 76
5.2.5 Valve Development Assay 76
5.3 Intracardiac Flow Patterns 77
5.4 Zebrafish Valvulogenesis 80
5.4.1 Valve Morphogenesis 80
5.4.2 Valve Dynamics 83
5.5 Frequency and Flow 89
5.5.1 Decreased Heart Rate 89
5.5.2 Oscillatory Flow Reduction Mechanism 91
5.5.2 Lidocaine Treatment 92
5.6 Reduced Oscillatory Flow Induces Valve Defects 93
5.6.1 Range of Valve Defects 94
5.6.2 Incidence of Valve Dysmorphology 95
5.7 Control Experiments 96
5.8 Discussion and Perspectives 99
5.9 Chapter References 102
Chapter 6: Conclusions 105
6.2 Challenges 107
6.3 Future Work 108
Appendix 110
A. Intracardiac Fluid Forces Are an Essential Epigentic Factor for
Embryonic Cardiogenesis 110
B. Viewing Angles for Cardiac Imaging 131
List of Figures
Figure 2.1 Embryonic zebrafish and heart development 11 Figure 2.2 Hemodynamic forces are essential for proper cardiogenesis 17 Figure 3.1 Blocked pigment formation in PTU-treated embryos 24 Figure 3.2 Heart morphogenesis in Tg(gata1:GFP) embryos 28 Figure 3.3 Heart morphogenesis in Tg(cmcl2:GFP) embryos 29 Figure 3.4 Heart morphogenesis in Tg(tie2:GFP) embryos 30 Figure 3.5 BODIPY-ceramdie stained embryos reveal non-tissue-specific
fluorescent contrast 32
Figure 3.6 Acquiring and synchronizing nongated motions in sequential
optical planes 36
Figure 3.7 Period determination in the zebrafish heart 37 Figure 3.8 Realignment artifacts due to non-periodic cardiac cycles 39 Figure 3.9 Four-dimensional data of heart contractions in Tg(cmlc2:GFP)
embryos 40
Figure 3.10 Embryonic cardiac volume renderings 43 Figure 3.11 Cardiac cell tracking in Tg(cmlc2:GFP) embryos 45 Figure 3.12 Quantitative description of endocardial cushion dynamics 45 Figure 3.13 First use of DPIV to characterize blood flow in the embryonic
zebrafish 48
Figure 3.14 Intracardiac blood flow characterization utilizing DPIV 49 Figure 3.15 Blood cell tracking through a Tg(gata1:GFP) heart tube 50 Figure 4.1 Biomechanics of embryonic heart tube contractions contradicts
peristalsis as the main pumping mechanism 56 Figure 4.2 Endocardial cell trajectories during heart tube contractions
contradict peristalsis 57
Figure 4.3 Blood cell velocities greatly exceed the traveling wave velocity 58 Figure 4.4 Non-linear frequency flow relationship for 26 hpf zebrafish
heart tube despite similar contraction amplitudes 59 Figure 4.5 Hydroelastic nature of the embryonic heart tube wall 61
Figure 4.6 Pressure gradient estimations 62
Figure 5.13 Incidence of valve dysmorphology 96 Figure 5.14 Valve dysmorphology rescue with elevated temperature 98 Figure 5.15 Heart valve dysmorphology rescue in embryos treated
with 0.15% lidocaine 98
Figure 5.16 Heart valve dysmorphology resuce in embryos treated
with 0.09% lidocaine 99
Figure A.1 Cardiac dynamics in the zebrafish embryonic heart at 4.5 dpf 125 Figure A.2 High-velocity, high-shear conditions generated in the 4.5 dpf
embryonic zebrafish heart 126
Figure A.3 Dynamics of valveless atrio-ventricular junction in the 37 hpf
embryonic zebrafish heart 128
Figure A.4 Impaired blood flow influences cardiogenesis 129
Figure B.1 30 hpf stack 132
Figure B.2 30 hpf left lateral progression 133
Figure B.3 30 hpf right lateral progression 134
Figure B.4 48 hpf stack 135
Figure B.5 48 hpf left lateral progression 136
Figure B.6 48 hpf right lateral progression 137
Figure B.7 72 hpf stack 138
Figure B.8 72 hpf left lateral progression 139
Figure B.9 72 hpf right lateral progression 140
Figure B.10 96 hpf stack 141
Figure B.11 96 hpf left lateral progression 142
Figure B.12 96 hpf right lateral progression 143
Figure B.13 144 hpf stack 144
Figure B.14 144 hpf left lateral progression 145
CHAPTER 1: Prologue
1.1 Introduction
Cardiogenesis is a dynamic process directed by numerous feedback loops. The
primary function of the adult heart is pumping blood through the circulatory system. In
relation to other organs, the heart is unique because it can perform its function throughout
development (i.e., the primitive heart tube, despite its rudimentary shape, can drive
circulation as well). One reason this is possible may be that the output of cardiac
function, blood flow, is also an input that regulates gene expression. It is widely accepted
that epigenetic factors, such as blood flow, combine with genetic programming to guide
normal and abnormal heart development. However, the details and extent of this
relationship continue to generate discussion and debate. Given the high prevalence of
congenital heart defects and the ambiguities surrounding developmental processes in
general, the conclusions are of practical importance to the medical and biological
communities.
The main motivation for this research was to enhance our understanding of
cardiogenesis by studying the development of cardiac structure and function. Our
approach was to evaluate the dynamic relationship between cardiac contractile
mechanics, hemodynamics, and morphogenesis. These efforts necessitated high
resolution (both temporal and spatial) imaging of in vivo cardiac cell motions within a
single heart beat and throughout cardiac development. Acquiring and analyzing data
required demonstrations of principles from interdisciplinary studies, including biology,
engineering, optics, and image processing to provide several quantitative measurements
Utilizing novel imaging tools and four-dimensional visualization protocols
(Liebling et al. 2005), we propose a new mechanism of valveless pumping in the
embryonic heart tube via elastic wave propagation and reflection (Forouhar et al. 2006).
We arrived at this conclusion by studying the structure of the embryonic heart tube, the
dynamic motions of endocardial and myocardial cells, the natural relationship between
heart wall motions and blood cell motions, and the experimental response of blood cell
motions to changes in contractile dynamics. This comprehensive analysis of cardiac
function at one stage of development provides a protocol for extending studies to more
advanced stages and more complicated structures. It also provides one step in
establishing the dynamic relationship between structure and function.
In order to connect how fluid dynamics may help orchestrate cardiac
morphogenesis, we studied one region of the zebrafish (Danio rerio) heart, the
developing atrio-ventricular (AV) canal, exposed to amplified hemodynamic forces. Our
initial observations of blood flow through this region, the eventual site of the AV valve,
revealed a clear transition from pulsatile unidirectional flow to oscillatory flow prior to
valve formation, and then a return to unidirectional flow after the formation of functional
valve leaflets. This was a particularly interesting phenomena for two reasons; (i)
oscillatory flows are extremely biologically active, stimulating cell adhesion,
proliferation, and death (Chappell et al. 1998; Haga et al. 2003; Sorescu et al. 2003;
Sorescu et al. 2004), and (ii) the function of the derived structure, the AV valve, is to
specifically prevent oscillatory flow. These two relationships furthered our curiosity,
eventually prompting the question: do heart valves form in response to intracardiac
Many studies have successfully analyzed gene expression patterns in response to
flow-induced forces in vitro but none has successfully duplicated the fidelity of these
experiments in vivo. One significant challenge in studying fluid forces in vivo is
non-invasively and acutely controlling blood flow through the intact heart. Several methods of
manipulating blood flow in vivo include ligating vessels and chambers (Hogers et al.
1997; Hogers et al. 1999), occluding flow by inserting beads into the circulatory path
(Hove et al. 2003), and studying mutants with altered cardiac contractile properties
(Bartman et al. 2004). However, none of these specifically modulate oscillatory flow.
Here we identify a relationship between oscillatory flow and contractile frequency, and
manipulate embryonic heart rates to modulate oscillatory flow patterns through the
developing AV canal. Our results suggest that oscillatory flows are essential for normal
AV valve formation in the embryonic zebrafish heart. These results, along with the
frequency-dependent nature of oscillatory flow, provide a mode for designing
hemodynamic therapies to rescue congenital heart valve defects.
1.2 Organization
This thesis is a compilation of methods, data, and perspectives, some of which has
been previously published in peer-reviewed journals. In cases where the thesis author is
the sole first author of the published work, the text and figures have been included with
appropriate references. In cases where the thesis author is either joint first author or a
secondary author, the included text has been re-written but figures and figure legends
Chapter 2 provides essential background information for the research presented.
We review heart development in vertebrates and explain why zebrafish are the model
system of choice to study dynamic cardiac function. We provide evidence that
hemodynamic forces contribute to normal and abnormal heart development and consider
some of the questions that remain unanswered.
Chapter 3 introduces a number of tools and techniques used to study zebrafish
heart biomechanics and hemodynamics. We describe protocols for imaging zebrafish
hearts in vivo with brightfield and confocal microscopy. During the course of this study,
technological improvements in confocal microscopy increased scan rates by two orders
of magnitude, permitting observation of a wide range of dynamic cardiac motions. We
briefly describe the technology employed by Carl Zeiss GmbH. in their preproduction
prototype of the Zeiss LSM 5 LIVE high-speed confocal microscope (Liebling et al. in
preparation). This prototype was used to obtain high speed two-dimensional scans of the
beating zebrafish heart and blood flow through the heart. Next, we describe the
correlation algorithm used to synchronize sequential two-dimensional scans to create
dynamic four-dimensional cardiac data (Liebling et al. 2005). Among other things, this
data can then be used to track cardiac cell motions, extract volume changes during the
cardiac cycle, and analyze intracardiac flow patterns. Examples are provided.
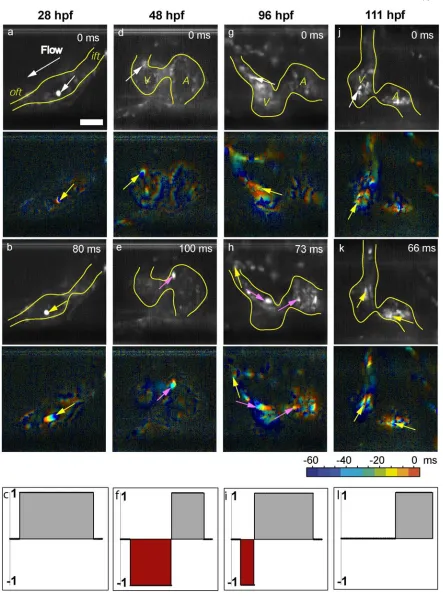
In chapter 4 we examine endocardial, myocardial, and blood cell motions during
early heart tube contractions and present evidence that contradicts peristalsis as a
pumping mechanism in the embryonic heart. Instead, we propose a more likely
explanation of early cardiac dynamics in which the pumping action is caused by suction
We provide some perspective on how this pumping mechanism may be evolutionarily
advantageous to peristalsis and may necessitate heart valve formation.
In chapter 5 we provide evidence in support of our hypothesis that oscillatory
shear stress in the developing heart stimulates AV valve formation. We begin with a
description of flow patterns throughout cardiogenesis, and illustrate the transition from
unidirectional flow to bidirectional flow prior to valve formation (Leibling et al. in
preparation). We identify and utilize an interesting relationship between heart rate and
oscillatory flow to study the role of oscillatory shear stress on valve formation. Our
results show that oscillatory flow is critical for normal AV valve formation (Forouhar et
al. in preparation).
In chapter 6, we summarize the primary contributions of this work and discuss
challenges and future opportunities in the field.
1.3 Goals
The major goal of this research is to improve our understanding of cardiac
morphogenesis by studying the dynamic relationship between structure and function in
the developing heart. Along the way, a number of intermediate goals were also
established, including (i) quantitatively describing early heart wall and blood cell motions
to understand how the heart tube pumps blood, (ii) extending our study of blood flow
through the heart tube to later stages of cardiogenesis in order to describe blood flow
patterns along with pumping mechanisms throughout heart development, (iii) deriving a
performing functional assays on heart valve formation to identify the results of altered
1.4 Chapter References
Bartman T, EC Walsh, KK Wen, M McKane, J Ren, J Alexander, PA Rubenstein, DY Stainier, PLoS Biol. 2, E129 (2004).
Chappell DC, SE Varner, RM Nerem, RM Medford, RW Alexander, Circ Res. 82, 532 (1998).
Forouhar AS, M Liebling, AI Hickerson, A Naisrei-Moghaddam, HJ Tsai, JR Hove, SE Fraser, ME Dickinson, M Gharib, Science. 312, 751 (2006).
Forouhar AS, M Liebling, J Vermot, JR Hove, SE Fraser, M Gharib. Oscillatory Flow and Valvulogenesis, In preparation.
Haga H, A Yamashita, J Paszkowiak, BE Sumpio, AJ Dardik, J Vasc Surg. 37, 1277 (2003).
Hogers B, MC DeRuiter, AC Gittenberger-de Groot, RE Poelmann, Circ Res. 80, 473 (1997).
Hogers B, MC De Ruiter, AC Gittenberger-de Groot, RE Poelmann, Cardiovasc Res. 41, 87 (1999).
Hove JR, RW Koster, AS Forouhar, G Acevedo-Bolton, SE Fraser, M Gharib, Nature. 421, 172 (2003).
Liebling M, AS Forouhar, M Gharib, SE Fraser, ME Dickinson, J Biomed Opt. 10, 054001 (2005).
Liebling M, AS Forouhar, R Wolleschensky, B Zimmermann, R Ankerhold, SE Fraser, M Gharib, ME Dickinson. Rapid three-dimensional imaging and analysis of
the beating embryonic heart reveals functional changes during development, In preparation.
Sorescu GP, M Sykes, D Weiss, MO Platt, A Saha, J Hwang, N Boyd, YC Boo, JD Vega, WR Taylor, HJ Jo, Biol Chem. 278, 31128 (2003).
CHAPTER 2: Vertebrate Heart Development
2.1 Introduction
Understanding the root of congenital heart and valve defects requires precise
knowledge of the processes involved in cardiogenesis. Research in this field has been
motivated by medicine and embryology alike. Current descriptions of heart and valve
morphogenesis are largely composed from snapshots of static hearts. As Christine
Seidman cleverly illustrated (Harvey and Rosenthal, 1999), this is like watching a play in
which you can view the performance of the actors but can not hear the dialogue. In the
context of heart morphogenesis, the dialogue is the interplay between structure and
function: how the cellular components of the heart compile genetic and epigenetic
information to design blueprints for the cardiac pump. In this chapter we introduce a few
things we do know, many we do not know, and some we hope to find out regarding heart
and valve development.
2.2 Vertebrate Heart Morphogenesis
The structure and function of the vertebrate heart has been the subject of studies
for centuries. Some of the earliest contributions to the field were made by Leonardo
DaVinci (1452-1519) in the 15th century. His drawings illustrate the anatomy of the
mature human heart and valves. DaVinci created models of the heart and documented the
flow patterns of millet seeded water through his models (Keele 1979). Since then, a
wealth of knowledge on heart morphogenesis has been acquired, but much less is known
As perhaps expected, the complexity of vertebrate heart development has
increased throughout evolution. However, despite the differences in adult cardiac
structure, many of the genes involved in regulating heart development are conserved
amongst vertebrates, suggesting many features of cardiogenesis are also conserved
(Cripps et al. 2002; Zheng et al. 2003). In a very brief description of heart
morphogenesis, we consider vertebrate species above, and including, fish on the
evolutionary ladder (i.e., amphibians, reptiles, and mammals). Heart development
consists of four conserved stages: (i) heart tube formation, (ii) looping, (iii) chamber
formation, and (iv) valve formation (reviewed by Moorman et al. 2003). The first
functional shape of the heart is a linear tube composed of enodocardium and
myocardium. Peridic myocardial contractions begin shortly after the tube is formed and
blood circulation commences. The next stage of cardiogenesis consists of right-handed
bending of this tube into a “C” shape. Chamber boundaries become marked first by
endocardial cushions (ECs) and finally by valve leaflets, aiding the unidirectional flow of
blood through the heart. The duration of cardiac morphogenesis, number of chambers,
and final shape of the mature heart are specific to each species.
2.3 Embryonic Zebrafish as a Model
The zebrafish, named appropriately for its black-and-white stripes, is a tropical
fresh water fish native to the Ganges River. This species has recently garnered significant
interest in the clinical and biological communities as a model to study normal and
abnormal vertebrate heart development. Eggs are externally fertilized and embryos can be
(Fig. 2.1A-C). The small size of the embryo also makes it a candidate for confocal laser
scanning microscopy (CLSM). Zebrafish embryos develop extremely rapidly (the heart
reaches its mature configuration within 5 dpf (days post fertilization) and matings can
produce several hundred embryos at a time, considerably enhancing the experimental
throughput in comparison to other vertebrate models such as chicks or mice.
Zebrafish do not become critically dependent on a functional heart for several dpf,
relying instead on diffusion alone to attain nutrients. Unlike in other larger vertebrate
models, this unique characteristic of the zebrafish facilitates the study of heart
malformations for a considerable period of development since the mutations are not
immediately embryonic lethal. Perhaps the most generally appealing characteristic of
zebrafish is their use as a genetic tool. The genome has been sequenced, and two large
scale mutant screens have produced hundreds of mutants with a variety of cardiac
phenotypes (Stainier et al. 1996; Chen et al. 1996), many of which resemble human
cardiac malformations.In addition, a number of transgenic strains have been derived
expressing fluorescent proteins (i.e, GFP, RFP, etc.) in tissue specific cell types (Long et
al. 1997; Huang et al. 2003; Motoike et al. 2000), making zebrafish a powerful model for
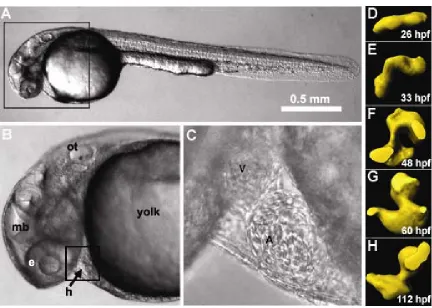
Figure 2.1. Embryonic zebrafish and heart development. (A,B) The small size and optical clarity of the embryonic zebrafish are evident through brightfield
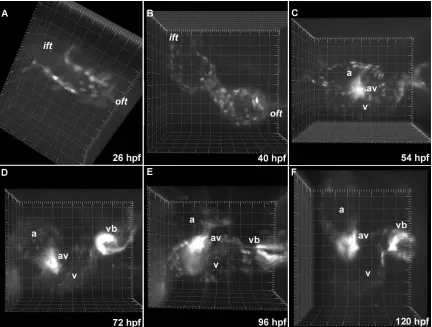
microscopy. The heart (h), midbrain (md), otic vesicle (ot), and eye (e) are labeled. (C) In a higher magnification image of the heart, the atrium (a), and ventricle (v) are visible. (D-H) Rapid heart development is illustrated by molds of the zebrafish heart throughout cardiogenesis. The zebrafish heart matures in 5 dpf. Stages of development in hours post fertilization (hpf) are included. (adapted from Liebling et al. 2005).
2.3 Zebrafish Heart Morphogenesis
The cardiovascular system is the first functional organ system to develop in
vertebrate embryos. In its earliest stages is consists of a primitive heart tube that drives
blood through a simple vascular network. During zebrafish heart morphogenesis, the
linear heart tube rapidly loops and bends into a dynamic multichambered organ, all the
morphology of the adult zebrafish heart and the adult human heart, many fundamental
features of cardiac morphogenesis are conserved between the two vertebrate species.
The embryonic zebrafish heart tube originates from myocardial precursors that
converge at the midline and fuse to form a cone by the 21 somite stage (19.5 hours post
fertilization, hpf) (Yelon et al 1999; Stainier et al. 1993). This cone transforms into a
linear heart tube consisting of concentric rings of endocardium and myocardium
separated by an elastic cardiac jelly, and moves from the dorsal-ventral axis (D-V) to the
anterior-posterior (A-P) axis of the embryo along the ventral midline (Trinh and Stainier,
2004). The A-P polarity conveniently positions the heart near the ventral plane of the
embryo and within the light scattering limits of confocal microscopy. The initial
myocardial contractions (22 hpf) are sporadic and do not effectively drive circulation. By
24 hpf, cells near the inflow tract adopt a pacemaker role and initiate periodic
contractions (~1 Hz) that suck blood through the heart tube.
During the next 24 hours of development, the zebrafish heart undergoes rapid
morphological changes. The linear heart tube loops to the right (31 hpf) and adopts an
intermediate “C” shape. Several hours later (~36 hpf), distinct chambers begin to emerge.
The ventricle is positioned to the right of the atrium and the heart transforms from a “C”
to a more advanced “S” configuration. The ventricle becomes lined by an additional layer
of myocardial cells (Hu et al. 2000) (48 hpf) and the boundary between the two chambers
becomes defined bya constriction known as the AV canal, the site of the future AV
valve. Over the course of heart development, pacemaker cells that initiate atrial
contractions increase their firing rate, causing the heart rate to increase from ~1Hz to
By 5 dpf, the zebrafish heart matures to its adult configuration. The atrium and
ventricle are separated by a functional bicuspid valve, supporting unidirectional
circulation through the heart. The ventricle transforms from a hollow structure to a
densely trabeculated chamber. The atrium remains untrabeculated and repositions dorsal
to the ventricle. The rapid and well-characterized development of the zebrafish heart is an
asset for cardiogenetic studies.
2.5 Factors Influencing Cardiogenesis 2.5.1 Genetic Contributions
Explant studies in the early 20th century showed that information guiding specific
stages of heart formation was pre-programmed in cardiac cells. Some of the earliest
experiments were performed in amphibians in the 1920’s (Ekman 1921, 1924; Stohr
1924; Copenhaver, 1926) and have since been extended to chicks (Rudy et al. 2001) and
mice (reviewed by Zaffran et al. 2003). These studies demonstrated that many
characteristics of normal cardiac development (i.e., looping and chamber formation) and
dynamics (i.e., contractions) could be maintained despite removing the heart from its
natural environment.
With contemporary molecular biology, specific genes influencing cardiogenesis
have been identified through random mutation screens, gene ablations, and mRNA knock
downs. In zebrafish, random mutations through chemical mutagenesis (Solnica-Krezel et
al. 1994; Driever et al. 1996) are used to isolate fish with single gene mutations.
Individuals with mutant phenotypes of interest are selected to retrospectively identify the
through two large scale screens published in 1996 (Stainier et al 1996; Chen et al 1996).
Some of the creatively named cardiac mutants derived from these screens include santa
(enlarged heart, no valves), hip hop (cardiac rhythm mutation), dead beat (reduced
ventricular contractility), and silent heart (no heart beat). In cases where the sequence of
a gene is known, gene ablations (reviewed by Rajewsky et al. 1996) and knockdowns
(reviewed by Heasman 2002) can identify the developmental role of the targeted gene.
Specific genes can be removed or inactivated at particular stages using conditional
knockout strategies in mice (reviewed by Rajewsky et al. 1996). This class of studies has
similarly revealed a number of genes necessary for normal heart development in mice
(McFadden et al. 2005).
Collectively, explant studies, random mutation screens, and specific gene
ablations provide a large body of evidence supporting the genetic basis for cardiogenesis,
a platform that does not generate much debate. However, all aspects of heart
development cannot be explained through genetic programming alone.
2.5.2 Epigenetic Contributions
The contributions of hemodynamic forces in cardiogenesis have been debated for
some time. Early experiments examining cultured endothelial cell responses to fluid
forces found that endothelial cells, which form the interface between the lumen of the
developing heart and flowing blood cells, can sense their fluid dynamic environment and
transduce mechanical stimuli, such as shear stress, into changes in gene expression, cell
shape, and cell arrangement (reviewed by Davies, 1995; Davies et al. 1984, 1986;
exposed to laminar shear stresses of 5 dynes/cm2 for 24 hours changed from a polygonal
to ellipsoidal shape and oriented in the direction of flow. Since then, experiments have
explored the magnitudes and types (laminar, turbulent, oscillatory) of shear stresses that
induce cellular responses. With the advent of microarray chips, studies now compliment
morphological investigations with global gene expression responses to fluid dynamic
forces (Ohura et al. 2003; reviewed by McCormick et al. 2003). Many of the genes
known to influence cardiogenesis have independently been shown to respond to shear
stresses.
A series of in vivo experiments have further validated claims that fluid dynamic
forces influence cardiogenesis. Endocardial cells near the atrial boundary of the AV canal
and in the developing AV cushions (Icardo, 1989) in the chick heart orient with the
direction of flow. Fluid forces in these regions of the heart are amplified due to increased
blood velocities. Consistent with “flow molding” theories, the two faces (ventricular and
atrial) of the semilunar valve in chicks (Hurle and Colvee, 1983) and humans (Maroon
and Hutchins, 1974) are marked by distinct cell shapes and alignments. During systole,
blood jets across the semilunar valve generating large shear stresses on the ventricular
surface of the leaflets. Elongated endocardial cells on the ventricular surface orient
parallel to the flow direction. In contrast, systolic blood flow creates vortices on the
arterial side of the leaflets, leaving endocardial cells irregularly shaped and without any
recognizable orientation.
A number of techniques have also been utilized to perturb blood flow in vivo to
study flow related cardiac anomalies. Some studies have included ligating vessels or
technique employed to alter flow in vivo is the injection of magnetic particles into the
blood stream (Acevedo-Bolton, 2005). The position of the particles can be manipulated
through an external magnet. This technique still requires refinement for precise control of
blood flow, but results indicate blocking flow into the heart stunts development at the
heart tube stage. In addition, the silent heart (sih) zebrafish mutant has been used to show
that the absence of blood flow through the heart leads to incomplete heart development
and the absence of heart valve leaflets (Bartman et al. 2004). The consensus result is that
abnormal blood flow through the intact heart leads to abnormal heart and valve
development.
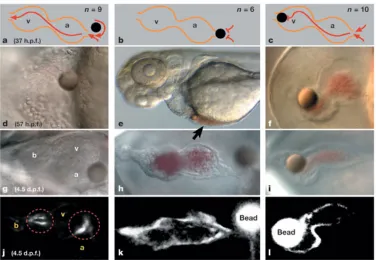
In another case specifically involving zebrafish cardiogenesis, Hove et al (2003)
demonstrated that occluding flow out of and into the 37 hpf heart tube with 50 µm glass
beads caused the heart to develop abnormally (Fig. 2.2; Appendix A). In both cases,
generating high and low cardiac pressures respectively, chambers and valves did not form
completely, the inflow and outflow tracts fused, and the heart did not reposition to its
mature configuration. Control embryos with inserted beads not blocking blood flow
through the heart developed normally. These results again demonstrate hemodynamic
forces are an essential epigenetic factor in cardiogenesis. One of the common threads
shared among embryos exposed to a variety of hemodynamic perturbations is that many
Figure 2.2. Hemodynamic forces are essential for proper cardiogenesis. (A-C) Schematic illustrating three different bead positions. (A) Control embryo with bead not blocking flow into or out of heart. (B) Embryo with bead blocking flow into heart (low pressure). (C) Embryo with bead blocking flow out of heart (high pressure). (D-F) Brightfield images of wild type zebrafish hearts with implanted beads at two developmental stages. (J-I) Fluorescent images of Tg(tie2:GFP) fish show blood flow is also critical for normal valve development. (adapted from Hove el al, 2003).
2.6 Discussion
The nature of the experiments implicating hemodynamic forces as contributing
factors towards cardiogenesis have understandably generated heated debate and raised
many more questions. They have also motivated a number of follow-up studies. For
example, in response to the experiments described by Hove et al (2003), Bartman et al
(2004) attempted to differentiate between myocardial function and abnormal
hemodynamics by studying two cardiac contractile mutants (sih and cardiofunk, cfk) that
lack EC formation. They complemented these experiments by pharmacologically altering
myocardial function was more influential in cardiogenesis than blood flow, however they
concluded that the distinct contributions of myocardial function and hemodynamics could
not be definitively separated. We extend their results to propose that the cardiogenetic
effects of myocardial function and blood flow are indistinguishable because myocardial
function and hemodynamics themselves are inseparable.
The dynamic relationship between structure and function in the developing heart
imposes many constraints on the types of experiments that can be performed. Often
times, experimental manipulations provoke questions regarding which effects are
primary. Any hemodynamic perturbations using the intact heart in wild type embryos will
undoubtedly cause changes in contractile mechanics, since the two are causally related.
The challenge is to conduct experiments through relatively subtle changes in mechanics
and flow.
In this work, we show that heart valve anomalies result from small perturbations
in cardiac mechanics that lead to significant changes in intracardiac flow. We think these
results will continue to advance the running dialogue surrounding the genetic and
2.7 Chapter References
Acevedo-Bolton G, Blood flow effects on heart development and a minimally invasive technique for in vivo flow manipulation. PhD thesis, California Institute of Technology (2005).
Balcells M, MF Suarez, M Vazquez, ER Edelman, J Cell Physiol. 204, 329 (2005).
Bartman T, EC Walsh, K Wen, M McKane, J Ren, J Alexander, PA Rubenstein, DY Stainier, PLoS Biol. 2, 673 (2004).
Chappell DC, SE Varner, RM Nerem, RM Medford, RW Alexander, Circ Res. 82, 532 (1998).
Chen JN, P Haffter, J Odenthal, E Vogelsang, M Brand, FJ van Eeden, M Furutani-Seiki, M Granato et al., Development. 123, 293 (1996).
Copenhaver WM, Amblystoma punctatum J. Exp. Zool. 43, 321 (1926).
Cripps RM, EN Olson, Dev Biol. 246, 14 (2002).
Davies PF, CF Dewey, SR Bussolari, EJ Gordon, MA Gimbrone, J Clin Invest. 73, 1121 (1984).
Davies PF, A Remuzzi, EJ Gordon, CF Dewey, MA Gimbrone, Proc Natl Acad Sci USA. 83, 2114 (1986).
Davies PF, Physiol Rev. 75, 519 (1995).
Dewey CF, SR Bussolari, MA Gimbrone, PF Davies, J Biomech Eng. 103, 177 (1981).
Driever W, L Solnica-Krenzel, AF Schier, SC Neuhauss, J Malicki, DL Stemple, DY Stainier, et al., Development. 123, 37 (1996).
Ekman G, Oevers. Fin. Vetensk. Soci. Foerh. A. 63, 1 (1921).
Ekman G, Wilhelm Roux’ Arch. Entwicklungsmech. Org. 106, 320 (1924).
Forouhar AS, Liebling M, Hickerson A, Nasiraei-Moghaddam A, Tsai HJ, Hove JR, Fraser SE, Dickinson ME, Gharib M, Science. 312, 751 (2006).
Garcia-Cardena G, J Comander, KR Anderson, BR Blackman, MA Gimbrone, Proc Natl Acad Sci USA. 98, 4478 (2001).
Harvey RP, N Rosenthal, Heart Development. (Canada: Academic Press, 1999).
Heasman J, Dev. Biol. 243, 209 (2002).
Hogers B, MC DeRuiter, AC Gittenberger-de Groot, RE Poelmann, Circ. Res. 80, 473 (1997).
Hogers B, MC DeRuiter, AC Gittenberger-de Groot, RE Poelmann, Cardio. Res. 41, 87 (1999).
Hove JR, RW Koster, AS Forouhar, G Acevedo-Bolton, SE Fraser, M Gharib, Nature. 421, 172 (2003).
Hu N, D Sedmera, JH Yost, EB Clark, Anat. Rec. 260, 148 (2000).
Huang CJ, CT Tu, CD Hsiao, FJ Hsieh, HJ Tsai, Dev. Dyn. 228, 30 (2003).
Hurle JM, E Colvee, Anat. Embryol. 167, 67 (1983).
Icardo JM, Anat. Rec. 225, 150 (1989).
Jaffee OC, Anat. Rec. 151, 69 (1965).
Keele KD, Yale Journal of Biology and Medicine. 52, 376 (1979).
Liebling M, AS Forouhar, M Gharib, SE Fraser, ME Dickinson, J. Biomed. Optics 10, 054001 (2005).
Liebling M, AS Forouhar, R Wolleschensky, B Zimmermann, R Ankerhold, SE Fraser, M Gharib, ME Dickinson, Rapid three-dimensional imaging and analysis of
the beating embryonic heart reveals functional changes during development, in preparation.
Long Q, A Meng, H Wang, JR Jessen, MJ Farrell, S Lin, Development. 124, 4105 (1997).
Maroon BJ, GM Hutchins, Am. J. Pathol. 74,331 (1974).
McCormick SM, SR Frye, SG Eskin, CL Teng, CM Lu, CG Russell, KK Chittur, LV McIntire, Biorheology. 40, 5 (2003).
Moorman AF, VM Christoffels, Physiol Rev. 83, 1223 (2003).
Motoike T, S Loughna, E Perens, BL Roman, W Liao, TC Chau, CD Richardson, Genesis. 28, 75 (2000).
Ohura N, K Yamamota, S Ichioka, T Sokabe, H Nakatsuka, A Baba, M Shibata, J Atheroscler Thromb. 10, 304 (2003)
Rajewsky K, H Gu, R Kühn, UAK Betz, W Müller, J Roes, F Schwenk, J Clin Invest. 98, 600 (1996).
Remuzzi A, CF Dewey, PF Davies, MA Gimbrone, Biorheology. 21, 617 (1984).
Rudy DE, TA Yatskievych, PB Antin, CC Gregorio, Dev Dyn. 221, 61 (2001).
Sato M, N Ohshima, Biorheology. 31, 143 (1994).
Solnica-Krezel L, AF Schier, W Driever, Genetics. 136, 1401 (1994).
Sorescu GP, H Song, SL Tressel, J Hwang, S Dikalov, DA Smith, NL Boyd, MO Platt, et al., Circ Res. 95, 773 (2004).
Sorescu GP, M Sykes, D Weiss, MO Platt, A Saha, J Hwang, N Boyd, et al., J Biol Chem. 278, 31128 (2003).
Stainier DY, RK Lee, MC Fishman, Development. 119, 31 (1993).
Stainier DY, B Foquet, JN Chen, KS Warren, BM Weinstein, SE Meiler, MA Mohideen, et al., Development. 123, 285 (1996).
Stoh P, Arch. Mikrosk. Anat. Entwicklungsmech. 102, 426 (1924).
Trinh LA, DY Stainier, Methods Cell Biology. 76, 455 (2004).
Yelon D, SA Horne, DY Stainier, Dev Biol. 214, 23 (1999).
Zaffran S, R Kelly, A Munk, N Brown, M Buckingham, Journal de la Societe de Biologie. 197, 187 (2003).
Chapter 3: Cardiac Imaging Tools and Techniques
3.1 Introduction
In vivo three-dimensional data can provide structural information on genes, cells,
and organ systems. Dynamic data provide information on how things move. Collectively,
they can teach us how proteins fold, cells move, and organs form. Optimal live imaging
requires tools and techniques specifically tailored to the observed model system. The
zebrafish naturally offers a beautiful window to view cardiogenesis and valvulogenesis,
but the dynamic nature of heart contractions and morphogenesis presents a number of
imaging challenges. Simply put, hearts are microscopic and cardiac cell motions are
rapid. Here, we discuss techniques employed to optimize in vivo cardiac imaging using
contemporary confocal microscopy and four-dimensional visualization tools. Together
they allow us to view dynamic cardiac motions at previously unmatched spatial and
temporal resolutions and acquire novel qualitative and quantitative data to assess early
cardiac structure and function. In this chapter we present diagnostic tools and techniques
used to study heart morphogenesis and the effects of blood flow through the developing
heart.
We begin our discussion with a general protocol on zebrafish embryo collection
and preparation for imaging. Three transgenic zebrafish strains that fluorescently label
endocardium, myocardium, and blood cells, along with a vital dye that provides contrast
to simultaneously view cardiac tissue and blood cells are introduced. We briefly describe
the technology behind the pre-production prototype of the Zeiss LSM 5 LIVE employed
implemented to obtain dynamic four-dimensional (three-spatial dimensions and time)
data of the beating heart. These tools enabled us to assemble a unique library of heart
development data. As a result, we now have access to a number of embryonic cardiac
diagnostics, including cardiac volume estimations, four-dimensional cardiac cell tracking,
and more complete descriptions of blood flow throughout cardiogenesis. We end this
chapter with a discussion of two quantitative methods, digital particle imaging
velocimetry (DPIV) and particle tracking, to describe intracardiac flow in zebrafish.
3.2 Zebrafish Preparation
Adult zebrafish are housed in the biological imaging center and cared for by
faculty, staff, and students in accordance with Westerfield (2000). Wild type, transgenic,
and mutant zebrafish lines are separated into small tanks and fed brine shrimp and flake
food multiple times daily. The fish room is maintained at 28.5 ºC and under a strict
photoperiod (14 hours of light, 10 hours of darkness). Zebrafish embryos can be
spawned from a pair of adults multiple times per week, with each mating producing
hundreds of offspring. Externally fertilized embryos are collected in the morning in
mating cages designed to separate fertilized eggs from adults, preventing adults from
feeding on embryos. Embryos are raised in artificial pond water and staged according to
(Kimmel et al. 1995).
A number of techniques are available to facilitate in vivo zebrafish imaging.
Embryos can be treated with 0.003% phenylthiourea (PTU) between 12 and 24 hpf to
prevent pigment formation (Fig. 3.1). In order to specifically prevent pigment formation
late as 40 hpf. Experimental embryos imaged prior to 48 hpf are manually dechorionated
using forceps. If desired, dechorionated embryos can be stained with vital dyes
illuminating specific structures. Minutes prior to imaging, embryos are anesthetized in
0.0175% tricaine methanesulfonate (Argent). Embryos can remain anesthetized for up to
24 hours with no adverse affects.
Figure 3.1. Blocked pigment formation in PTU-treated zebrafish embryos. (A) 72 hpf embryo with normal pigment formation. Often times pigment obscures views of internal structures. (B) Embryo treated with PTU does not form pigment.
Multiple techniques are available for immobilizing zebrafish for cardiac imaging.
The appropriate technique depends on the imaging method, imaging duration, and
developmental stage of the embryo. In the simplest case, for brightfield imaging done on
an inverted microscope with an adjustable stage, embryos can be placed in a small drop
of artificial pond water on a cover slip and directly viewed without anesthesia. Embryos
older than 72 hpf are stable on their ventral surface. Simply touching an embryo’s tail
with a small Eppendorf microloader will cause the fish to swim briefly and eventually
come to rest on the ventral surface. The liquid drop size restricts the motion of the
swimming embryo. The stage is then adjusted so that the heart is in the field of view.
For confocal imaging, alternate methods are used since laser light causes the fish
anesthetized. When multiple views of a single embryo are desired from an upright
confocal micrscope, the best positioning method is to place embryos in small wells
etched in agarose. Wells are made by pouring 30 mL of 1.5% molten agarose (Invitrogen)
into a Petri dish (100 x 15 mm, VWR). A plastic mold is then placed on the molten
agarose before it cools. When the agarose cools to room temperature (20 ºC) and hardens,
the plastic mold is removed, leaving the desired pattern etched into the agarose gel. An
elaborate series of plastic molds are available with patterns designed for a variety of
developmental stages and embryo orientations (Megason et al. in preparation). In our
case, simple block wells etched into agarose (750-900 µm wide) are sufficient. Embryos
are placed into these wells and anesthetized with tricaine. Until ~5 dpf, embryos are
negatively buoyant and sink to the bottom of the wells. The embryos can then be
positioned manually using a small Eppendorf microloader. A detailed analysis of the best
viewing angles for cardiac imaging at various developmental stages, along with detailed
positions of the chambers and valves, is provided in Appendix B. One convenient feature
of this positioning method is that a single embryo can be viewed from multiple angles.
The major drawback is that if the embryo moves during imaging, z-sections cannot be
correctly registered.
If a more rigid immobilization is desired, embryos can be positioned in small
beads of agarose that fix the embryo in a single position. In this method, embryos are
contained in a small drop of low melting point agarose (Sigma) stored at 28.5 ºC and
placed on a Petri dish. An Eppendorf microloader is used to position the embryo before
the agarose gels (20ºC). Once the agarose hardens, the embryo position is fixed. Artificial
throughout immobilization. Embryos can be immobilized in agarose beads for up to 24
hours. The main advantage of this method is that the embryo position is fixed during
imaging and can be maintained throughout long imaging periods. The drawback is that
only one position can be viewed without removing the embryo from the bead.
3.3 Fluorescent Contrast Agents
In order to optically visualize static or dynamic structures, contrasting spectral
properties between the observed structures and background must exist. Light focused on
a sample is absorbed, transmitted or reflected, and this combination defines the
appearance. Sometimes cells and structures are autofluorescent, but often times contrast
is artificially enhanced by adding fluorescent molecules into specific cells of interest. The
spectral properties of the fluorescent markers determine the excitation and emission
wavelengths of the fluorophores and appropriate filters are utilized to collect emitted light
from the sample. Multiple fluorophores can be used in a single sample as long as their
spectral properties are sufficiently discernable. Two common ways to label cellular, or
subcellular, structures in a living organism are through transgenic strains with fluorescent
proteins inserted into the genome and fluorescent vital dyes. We employ both to visualize
cardiac structures in the developing zebrafish.
3.3.1 Transgenics
Deriving transgenic strains offers the opportunity to acutely label tissue specific
cell types. This can be achieved by integrating a DNA sequence coding a fluorescent
expression is driven by a selected promoter. The primary requirement to create a
transgenic is that the promoter sequence must be known. When this is the case, a much
wider variety of cells can be labeled in comparison to vital dyes. Deriving transgenic
lines requires a significant initial investment to create stable strains, but requires no
additional sample preparation since the fluorescent proteins are expressed in the
offspring. Stable transgenic lines can also be crossed with mutant strains to label specific
cells in mutant embryos. A variety of zebrafish transgenic strains has been derived to
observe cardiac cells, some of which we describe in the following sections.
3.3.1.1 Tg(gata1:GFP)
In order to observe intracardiac blood flow patterns with confocal microscopy, we
imaged Tg(gata1:GFP) zebrafish provided by Shuo Lin (UCLA). These fish express GFP
behind the GATA-1 promoter, an erythroid-specific transcription factor (Long et al.
1997). We visualized GFP in blood cells throughout development (Fig. 3.2), and to a
lesser extent, endocardial and myocardial cells early in heart development (until ~72 hpf).
GFP expression within an individual embryo varied greatly, some blood cells appeared
large and bright while others appeared smaller and dimmer. The variations in brightness
and size may be partially due to imaging thin sections with confocal microscopy. The
ellipsoidal blood cells with the long axis in the imaging plane appear brighter and larger.
Imaging blood flow in Tg(gata1:GFP) embryos allowed us to connect cardiac structure
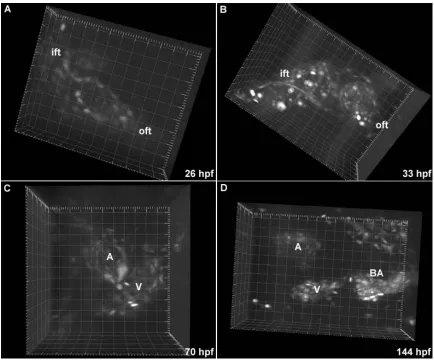
Figure 3.2. Heart morphogenesis in Tg(gata1:GFP) embryos. (A-D) Blood cells are fluorescently labeled, permitting visualization of blood flow and intracardiac volumes. The inflow tract (ift), outflow tract (oft), atrium (A), ventricle (V) and bulbus arteriosus (BA) are labeled. Grid spacing is 20 µm.
3.3.1.2 Tg(cmlc2:GFP)
In order to observe cardiac mechanics, we imaged Tg(cmlc2:GFP) provided by
Huai-Jen Tsai (National Taiwan University). These fish express GFP behind the myosin
light chain-2 (MLC-2) promoter, a myocardial specific gene (Huang et al. 2003). GFP
expression was consistenly bright in myocardial cells throughout cardiogenesis and
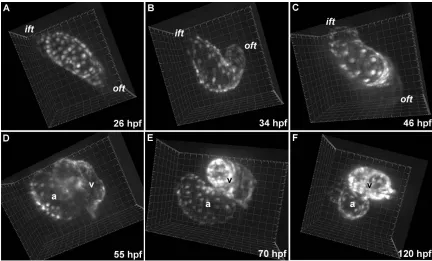
visualization of morphological changes during cardiogenesis (i.e., looping in Fig. 3.3A,B,
trabeculation in Fig. 3.3E,F) as well as biomechanics within a single cardiac cycle (i.e.,
[image:40.612.107.539.153.414.2]myocardial strain, etc.).
Figure 3.3 Heart morphogenesis in Tg(cmlc2:GFP) embryos. Fluorescently labeled myocardium permits visualization of cardiogenesis and contractile mechanics. (A-C) Observing embryonic hearts between 26 and 46 hpf provides a detailed description of heart tube looping in vivo. The primitive heart tube loops to the right, forms a “C” by 34 hpf and eventually forms an “S” by 46 hpf. (D) Well defined chambers are evident by 55 hpf. (E,F) Ventricular trabeculation is evident between 70 and 120 hpf. Grid spacing is 20 µm.
3.3.1.3 Tg(tie2:GFP)
In order to observe endocardial cell motions and valve dynamics, we imaged
Tg(tie2:GFP) zebrafish provided by the Stainier Lab (UCSF). These fish express GFP behind an endothelial-specific receptor tyrosine kinase, tyrosine kinase with
immunoglobulin and epidermal growth factor homology domain-2, tie2 (Motoike et al.
the lumen of the primitive heart tube. Endothelial cells later invade the ECs, making the
AV canal significantly brighter. Endocardial cells in growing valve cushions, and
eventually leaflets, continue to express GFP throughout valvulogenesis. GFP expression
in valves is much brighter than endocardium, and poses a problem for dynamic imaging.
In order to observe the atrial and ventricular endocardium, the laser must be operated at
high power which saturates the signal in the valve regions, making fine structures and
[image:41.612.109.541.264.591.2]delicate motions challenging to resolve.
3.3.2 Vital Dyes
Vital dyes are an important tool for labeling cells and structures in wild type
animals. For zebrafish heart imaging, it provides a method to label cells within the
beating heart with a variety of colors. The major advantage in using vital dyes is the short
sample preparation time, and for our purposes, non-tissue-specific staining. Since the
fluorescent marker is not integrated into the genome, it permits viewing structures in wild
type, transgenic, and mutant embryos in the short time it takes the dye to penetrate the
cells.
In order to provide contrast between the heart, serum, and blood cells, we soaked
embryos in BODIPYFL C5-ceramide (Molecular Probes), a fluorescent lipid membrane
dye (Fig. 3.5). We initially suspected the dye would stain blood cell membranes, but
instead it fluorescently labeled the blood serum, leaving the blood cells and cardiac tissue
unlabeled. Despite creating the inverse of what we expected, BODIPY-ceramide staining
allowed simultaneous visualization of dynamic heart wall, heart valve, and blood cell
motions in the beating heart at all stages of development (Fig. 3.5B). The protocol for this
technique is to place 1 µl of 4mM BODIPY-ceramide in a centrifuge tube with 0.2 ml of
artificial pond water along with up to ten embryos. Embryos are soaked for at least 4
Figure 3.5. BODIPY-ceramide stained embryos reveal non-tissue specific fluorescent contrast. (A) 20X view of a 96 hpf zebrafish embryo illustrates the variety of observable structures. The atrium (a), ventricle (v), and eye (e) are
labeled. Grid spacing is 50 µm. (B) 63X view of the heart shows fluorescently labeled blood serum. Serum labeling provides contrast to view the atrium (a), ventricle (v), inner ventricular leaflet (ivl) and outer ventricular cushion (ovc). Unlabeled blood cells can be seen in the ventricle.
3.4 High Speed Confocal Microscopy (adapted from Liebling et al. in preparation)
A significant amount of data presented in this work has been collected through
high-speed confocal microscopy, specifically acquired from a pre-production prototype
of the Zeiss LSM 5 LIVE, Carl Zeiss GmbH. Therefore, it is appropriate to briefly
discuss some specifications of this prototype along with the technology that has increased
confocal scan rates by two orders of magnitude.
Confocal microscopy has significantly improved three-dimensional imaging by
allowing high resolution scans to be acquired in vivo. The basic principle of confocal
fluorescently marked sample. The thickness of the field of view is controlled by a pinhole
aperture that limits signal contribution from out of focus light (i.e., from a plane other
than the desired imaging plane). Traditional laser scanning confocal microscopes employ
a laser that illuminates a single point on the specimen and, with a pair of vibrating
mirrors, scan this point across the imaging plane (scan time is approximately 1 frame per
second, fps, for a 512x512 pixel image). The collected light is then detected by a
photomultiplier and used to create the image.
The rate-limiting step in acquiring confocal scans is the laser scan time. The
LIVE prototype employs a novel line-scanning, as opposed to point-scanning, technique
that significantly increases frame rates without sacrificing resolution. Rather than
focusing light to a point, the laser beam is shaped to illuminate a full line of pixels and
the galvanometer-based mirror is required to scan in only one direction to image a plane,
significantly increasing frame rates to 175 fps for a 256x256 pixels image.
Confocal imaging parameters and techniques specific to our applications are
presented here. In most cases, we were interested in collecting rapid two-dimensional
scans at various optical planes. Using the Zeiss LSM AIM software, a specified number
of planar confocal scans were taken at a fixed frame rate (typically between 85 and 175
fps) and time interval between scans (0 seconds). The z-positions were registered with the
stage control feature of the software, and the z-plane could be adjusted by moving the
stage manually or through the computer, to optically section through the sample. Before
acquiring scans, the excitation wavelength (488 nm for GFP) and appropriate filters (505
nm long pass filter for GFP) were specified. The laser power used depended on the
frame rates depended on the scan mode (bidirectional or unidirectional) and image size
(256x256, 512x512, or 1024x1024 pixels). The fastest frame rates possible on the Zeiss
LSM 5 LIVE prototype were 175 fps for a 256x256 pixels bidirectional scan. All imaging
was done with water-immersion lenses (Achroplan 20x/0.5, 40x/0.8, 63x/0.9). The x,y
aspect ratio for each pixel was approximately 1:1.4. The x,y sampling step for the
256x256 pixels image taken with the 40x objective was 0.9 µm x 1.3 µm.
3.5 Four-Dimensional Reconstructions (adapted from Liebling et al. 2005)
Although embryonic ECGs are available for synchronizing confocal scans, they
are cumbersome to acquire while imaging. Short working distance objectives put tight
spatial restrictions on electrode positions and orientations, and acquiring ECG data
requires additional apparatus to collect and record signals. Therefore, a more convenient
method for synchronizing confocal scans acquired at unknown intervals was desired. This
is a common challenge in four-dimensional cardiac MR imaging and many solutions have
been developed. Some solutions rely on secondary signals such as ECGs to gate slice
sequences (prospective gating), and others are capable of synchronizing non-gated data
retrospectively by acquiring a reference signal along with the image signal, via specific
pulse sequences.
For our purposes, an ideal candidate would (i) not put any additional constraints
on imaging logistics, (ii) be robust enough to process large amounts of data quickly, (iii)
specifically handle imaging artifacts due to confocal microscopy (i.e., noise,
used (i.e., GFP, BODIPY-ceramide, etc.) and cell type labeled (i.e., myocardium, heart
valves, blood cells, etc). The solution came through an in-house, wavelet based,
post-acquisition synchronization program. A brief summary of the procedure, requirements,
and limitations of the synchronization process are provided here, but details can be found
in Liebling et al. (2005).
3.5.1 Data Collection
First and foremost, the four-dimensional reconstruction algorithm processes data
post-acquisition, increasing experimental throughput and placing no additional
restrictions on the imaging setup. High-speed confocal scans (x,y,t) are acquired at one
imaging plane (z1), starting at an arbitrary time in the cardiac cycle. The imaging plane is
then moved manually to a proximal imaging plane (z2) of known distance (∆z) and the
scan is repeated, again starting at some unknown time in the cardiac cycle (Fig. 3.6). At
least two periods must be recorded at each z-section, preferably many. The sections must
be named in an ordered fashion that describes their z-position (i.e., 30hpfGATA_100,
30hpfGATA_105, etc.) so the software can recognize sequential sections. The data are
recorded using the LSM AIM software which also records the frame rate, number of
Figure 3.6. Acquiring and synchronizing nongated motions in sequential optical planes (A) Non-synchronized scans at sequential optical sections (z1, z2) are recorded. (B) The time interval between recordings at different optical planes is unknown, leaving data naturally unsynchronized. (C) After synchronization, data are shifted to produce aligned volumes. (adapted from Liebling et al. 2005).
3.5.2 Algorithm
The first step in synchronizing slice sequences is to determine the period. An
initial guess of the number of frames corresponding to one period (±10%) must be
provided by the user and can be obtained utilizing the region of interest (ROI) (Fig.
3.7A,B) function in the AIM software. This function takes the average intensity of a
selected group of pixels over time. If the motion is periodic and the region of interest is
fixed, the average intensity plot will also be periodic with a small decay due to
photobleaching. This first approximation provided by the user is not precise enough to
compute the real period. The synchronization software uses the entered period length
(number of frames) along with a phase dispersion minimization technique (Stellingwerf
et al. 1978) to determine a closer estimate of the period. Briefly, this technique computes
the mean intensity of a region at every time point over several periods. For a candidate
period. A function, f(t), is computed that connects the phase locked intensity values. A
close estimate of the period is obtained when f(t) is minimized (Fig. 3.7C).
Figure 3.7. Period determination in the zebrafish heart. (A) When heartbeats are periodic, the average pixel intensity of a region of interest (ROI) as a function of time is also periodic, with a small decay due to photobleaching. (B) The ROI should be placed over a bright structure. Here, the ROI is over the AV valve. (C) Period estimations from the ROI are used to determine the actual period. (adapted from Liebling et al. 2005)
Before the relative time shifts between slice sequences are computed, the image
data, which is defined by the local intensity I(x,y,z,t), undergo a spatial two-dimensional
wavelet transform. The wavelet transform is a multiresolution technique that decomposes
periodic functions into space and frequency components. Unlike the Fourier transform,
which can only reveal what frequencies are present, the wavelet transform can provide
information on where these frequencies occur. One advantage of working in the wavelet
domain is that representation of natural images is sparse (i.e., most of the signal energy is
concentrated in a small number of coefficients). Data can be greatly reduced in size
(roughly corresponding to band pass filtering) by removing specific wavelet coefficients,
while preserving relevant image features. For our specific application, we remove fine
resolution coefficients corresponding to sharp variations in intensity, such as at the edges
decreases the computation time. We also discard low resolution coefficients thus
removing artifacts associated with confocal microscopy (i.e., non-uniform background,
photobleaching, etc.).
The computed wavelet coefficients are then used in conjunction with an image
registration technique based on the minimization of image intensity differences in a
least-squares sense (Thevenaz et al. 1988) to determine the similarities between sequential
slice sequences. Time shifts are computed to maximize the similarity between sequential
slice sequences. Once the appropriate time shifts are chosen, the slices are shifted in time
and reconstructed to four-dimensional datasets.
3.5.3 Limitations
The implemented synchronization technique is very robust, can handle large
amounts of information quickly, and is particularly suitable for use with confocal
imaging. However, existing limitations need to be considered. The dataset, I(x,y,z,t), must
be periodic, and the period must remain constant throughout the different slice sequences.
Reconstructed datasets with non-periodic motions can easily be recognized since they are
Figure 3.8. Realignment artifacts due to non-periodic cardiac cylces. In this 72 hpf heart, the heart rate was not consistent. While the initial part of the reconstructed cycle is aligned, the non-periodic nature of the data causes the later phases to become unaligned. This is evident by the discernable layers in the atrium and ventricle at the time point shown.
The second limitation restricts the axial sampling step. Sequential scans acquired
at different depths must be separated by intervals (∆z) smaller than the axial extent of the
point spread function (PSF) (in our case, just over 5 µm). When this case holds,
sequential slice sequences share fluorophore excitation information. When the axial
sampling step is larger than the axial PSF, sequential slice sequences can be considered
disconnected.
Alternatively deformations in the z-axis, between sequential optical planes, need
to be homogeneous. For example, the algorithm might not accurately re-align two
sequences if one sequence is shrinking while the other is expanding and the two samples
are larger than the point spread function extent. Future modeling simulations are required
3.5.4 Conclusions
Four-dimensional data of the beating embryonic heart provide a new perspective
to view cardiac biomechanics throughout cardiogenesis. Transforming data into the
wavelet domain provides a number of advantages including robustness in dealing with a
variety of four-dimensional datasets. Dynamic heart data from three transgenic lines,
Tg(gata1:GFP), Tg(tie2:GFP), and Tg(cmlc2:GFP), with GFP-labeled blood cells, endocardium, and myocardium, respectively as well as BODIPY-ceramide stained
embryos has been studied. The versatile synchronization method filters data so that
various imaging resolutions are analyzed. In cases where motions are not strictly periodic
(i.e., blood cells occupy different positions during different periods), filtering the
appropriate wavelet coefficients provides acceptable correlation functions. Data extracted
from four-dimensional reconstructions are used to characterize cardiac dynamics
throughout this work.
3.6 Four-Dimensional Data Analysis
The range of dynamic processes that can be observed depends on the spatial and
temporal resolutions of the imaging system. With high speed confocal microscopy and
four-dimensional reconstruction techniques (Liebling et al. 2005) we can study a variety
of dynamic cardiac motions. With the appropriate analysis software, a wealth of data
relating structure and function in the developing heart is now available. We present a
very small sample of the possibilities here.
3.6.1 Volume Measurements
Heart volume measurements are essential for a number of characteristic cardiac
parameters including cardiac output, stroke volume, and ejection fraction. These metrics
are often associated with clinical diagnoses. Less direct information on cardiac structure,
such as muscle fiber orientation, can also be gleaned from volume data. In the embryonic
heart, cardiac volume data could be used to estimate the efficiency of the developing
heart as a function of morphology and dynamics.
Through the use of appropriate fluorescent markers, and in conjunction with in
vivo four-dimensional reconstructions, atrial and ventricular volume curves can now be
calculated in the developing heart. These data can be attained when there is adequate
contrast between the intracardiac volume (i.e., blood cells and plasma) and the heart wall.
Two candidates for imaging cardiac volumes are Tg(gata1:GFP) embryos with
GFP-labeled blood cells and BODIPY-ceramide stained embryos with fluorescently GFP-labeled
plasma. In both cases, the heart wall is much darker than the intracardiac volume. With