Georgia State University Georgia State University
ScholarWorks @ Georgia State University
ScholarWorks @ Georgia State University
Public Health Theses School of Public Health
1-10-2020
Examining the Risk and Prevalence of Gestational Diabetes
Examining the Risk and Prevalence of Gestational Diabetes
Mellitus Among Hispanic Population Subgroups in the United
Mellitus Among Hispanic Population Subgroups in the United
States
States
Natalie Tripp
Follow this and additional works at: https://scholarworks.gsu.edu/iph_theses
Recommended Citation Recommended Citation
Tripp, Natalie, "Examining the Risk and Prevalence of Gestational Diabetes Mellitus Among Hispanic Population Subgroups in the United States." Thesis, Georgia State University, 2020.
https://scholarworks.gsu.edu/iph_theses/679
1
ABSTRACT
Examining the Risk and Prevalence of Gestational Diabetes Mellitus Among Hispanic Population Subgroups in the United States
By
Natalie Elizabeth Tripp
December 13th, 2019
INTRODUCTION: Gestational diabetes mellitus (GDM) is a significant public health problem in the United States because of its implications for both maternal and child health. While it is well documented that Hispanic women are disproportionately impacted by GDM, research and surveillance about GDM among ethnic subgroups is limited. Understanding how racial and ethnic subgroups differ from the general population, and from each other, have important research, policy, prevention and treatment implications.
AIM: This project will determine which Hispanic subgroups in the U.S. have the highest prevalence of GDM and if the associated risk factors for GDM vary among different Hispanic subgroups.
METHODS: Data from the National Vital Statistics System were analyzed using R version 3.5. Vital birth statistics from 2017 were used to determine prevalence rates among Hispanic
subgroups. Hispanic group-specific multiple logistic regression analyses were used to test and compare factors associated with GDM.
RESULTS: Among the Hispanic subgroups analyzed, Mexican American women (7.4%) had the highest prevalence of GDM, compared to Central/South Americans (6.5%), Puerto Ricans Americans (6.5%) and Cuban Americans (5.7%). In multivariable models, the risk factors
showing greatest variation for GDM among Hispanic ethnic subgroups were maternal age (being 25 years or older), BMI (having an overweight/obese BMI), and nativity (being born outside the U.S.).
CONCLUSION: Maternal age, BMI, and nativity were most strongly, and positively, associated with GDM status among women in all Hispanic subgroups. Nativity is of particular importance, as being born outside of the U.S. has traditionally been recognized as a protective factor against many chronic illnesses. Given that there are higher percentages of Hispanic women having babies who are foreign-born, researchers should strive to promote recruitment and inclusion of minority populations in health research to better inform prevention and treatment programs, and reduce the need to consolidate subgroups for statistical analysis. Ultimately, identifying at-risk populations though subgroup analysis may lead to reductions in disease prevalence and
2
Examining the Risk and Prevalence of Gestational Diabetes Mellitus Among Hispanic Population Subgroups in the United States
by
Natalie Elizabeth Tripp
B.S., University of Georgia
A Thesis Submitted to the Graduate Faculty of Georgia State University in Partial Fulfillment
of the
Requirements for the Degree
MASTER OF PUBLIC HEALTH
3
APPROVAL PAGE
Examining the Risk and Prevalence of Gestational Diabetes Mellitus Among Hispanic Population Subgroups in the United States
by
Natalie Elizabeth Tripp
Approved:
Dr. Harry J. Heiman Committee Chair
Dr. Brian Barger Committee Member
Dr. Ike S. Okosun Committee Member
4
Author’s Statement Page
In presenting this thesis as a partial fulfillment of the requirements for an advanced degree from Georgia State University, I agree that the Library of the University shall make it available for inspection and circulation in accordance with its regulations governing materials of this type. I agree that permission to quote from, to copy from, or to publish this thesis may be granted by the author or, in his/her absence, by the professor under whose direction it was written, or in his/her absence, by the Associate Dean, School of Public Health. Such quoting, copying, or publishing must be solely for scholarly purposes and will not involve potential financial gain. It is understood that any copying from or publication of this dissertation which involves potential financial gain will not be allowed without written permission of the author.
5
TABLE OF CONTENTS
LIST OF TABLES………...6
LIST OF FIGURES……….7
INTRODUCTION………...8
1.1 Description of the public health problem….…………..………...8
1.2 Racial and ethnic health disparities……….………...9
1.3 Obesity epidemic………..………..11
1.4 Gestational diabetes mellitus (GDM)………..………...12
1.5 GDM and Hispanic health………..………..………..13
1.6 Research questions………..…………...………15
REVIEW OF THE LITERATURE………...16
2.1 Health disparities and disparities in minority representation in health research…16 2.2 Obesity as a confounder for chronic and adverse pregnancy outcomes....……….18
2.3 GDM and disparities in minority health.……….………...……20
2.4 GDM and Hispanic subgroups………...…22
METHODS AND PROCEDURES………...25
3.1 Data source and approval………....25
3.2 Inclusion/exclusion criteria………….………...……….25
3.3 Independent/dependent variables……….………...26
3.4 Statistical analysis………...27
RESULTS………..29
4.1 Population of women having live births for analysis……….29
4.2 Percent of demographic and behavioral characteristics.…………..………..31
4.3 Unadjusted logistic regression models..……….34
4.4 Adjusted logistic regression models………...36
4.5 Comparison of odds ratios………..45
DISCUSSION AND CONCLUSION………...48
5.1 Discussion of research questions………48
5.2 Strengths and limitations………51
5.3 Implications of study findings and recommendations for future research ...…….51
5.4 Conclusion………..52
REFERENCES………..54
6
List of Tables
Table 4.1. Inclusion and exclusion criteria and missing responses.
Table 4.2. Demographic and behavioral characteristics of NHW and Hispanic subgroups of women.
Table 4.3. Results of unadjusted univariate logistic regression models exploring relationships between each study variable and GDM status among all women.
Table 4.4. Results of adjusted multivariate logistic regression model exploring relationships between study variables and GDM status among all women.
Table 4.5. Results of adjusted multivariate logistic regression model exploring relationships between each study variable and GDM status among NHW women.
Table 4.6. Results of adjusted multivariate logistic regression model exploring relationships between each study variable and GDM status among CSA women.
Table 4.7. Results of adjusted multivariate logistic regression model exploring relationships between each study variable and GDM status among Cuban American women.
Table 4.8. Results of adjusted multivariate logistic regression model exploring relationships between each study variable and GDM status among Mexican American women.
Table 4.9. Results of adjusted multivariate logistic regression model exploring relationships between each study variable and GDM status among Puerto Rican American women.
Table 4.10. Comparison of odds ratios for each independent study variable by Hispanic subgroups.
Table 4.11. Demographic and behavioral characteristics of NHW and Hispanic subgroups of women without GDM.
7
List of Figures
8
CHAPTER I
INTRODUCTION
I. Description of the public health problem
Racial and ethnic minority populations in the United States continue to experience significant
health disparities. Compared to the general population, minority communities often experience
lower socioeconomic status, greater barriers to healthcare access, and greater risks for disease
(CDC, 2013). Disparities also impact health and healthcare research, including challenges related
to poor minority representation and subgroup consolidation (Oh et al., 2015). Consequently,
inadequate research diminishes opportunities for improvements to minority health. One of the
most prominent health problems disproportionately affecting minority populations in the U.S. is
obesity. Hispanics (47.0%) and Non-Hispanic Blacks (NHB) (46.8%) have the highest
prevalence rates of obesity (Hales, 2017). The relationship between obesity and minority health
is complex; obesity is associated with increased risk for several comorbidities and chronic health
conditions, such as hypertension, diabetes, and cardiovascular disease (CDC, 2018a). A common
comorbidity associated with obesity in pregnant women is gestational diabetes mellitus (GDM).
Currently, an estimated 2% to 10% of pregnancies in the U.S. are affected by GDM and the
percentage of women with GDM increased by 56% from 2000 to 2010 (CDC, 2018b; CDC,
2017). Among other complications, GDM increases risk for developing type 2 diabetes mellitus
(T2DM) for both mother and child postpartum; T2DM is a chronic condition associated with
serious health consequences, such as kidney and heart disease (CDC, 2019a).
Hispanic women, among other minority populations, are disproportionately impacted by
GDM, yet research on GDM by Hispanic ethnic subgroup is limited (Fujimoto, Samoa, &
9
help identify specific populations at greater risk. Ultimately, identifying at-risk ethnic
sub-populations can lead to targeted strategies and interventions to reduce disease prevalence,
healthcare costs, and improve outcomes in maternal and child health.
II. Racial and ethnic health disparities
Racial and ethnic health disparities are a persistent challenge in the U.S. Many minority
populations are at higher risk for both worse health outcomes and lack of access to healthcare
(USDHHS, 2008). The consequences of disparities not only affect minority groups, but also limit
improvements in quality of life and health for the U.S. population overall (USDHHS, 2008).
Racial and ethnic minority populations in the U.S. include Asians, NHBs, Hispanics, Native
Hawaiians or Other Pacific Islanders, and American Indians or and Alaska Natives (AI/AN)
(CMA, 2019). Each minority population can be further divided into subgroups. For example, the
U.S. Census uses the term “Hispanic” to describe individuals of Mexican, Puerto Rican, Cuban,
South or Central American, or other Spanish origin, regardless of race (USCB, 2019). As the
U.S. population becomes more diverse, addressing health disparities is increasingly important.
According to the US Department of Health and Human Services, a health disparity is “… a
type of health difference that is closely linked with social, economic, and/or environmental
disadvantage. Health disparities adversely affect groups of people who have systematically
experienced greater social or economic obstacles to health based on … characteristics
historically linked to discrimination or exclusion” (USDHHS, 2008). Examples of these
characteristics include race, gender, and sexual orientation. In addition to health disparities,
minority health outcomes are influenced by a variety of other factors known as social
determinants of health (SDOH); SDOH are “…economic and social conditions that influence
10
conditions that influence health outcomes include economic stability, safe neighborhoods, access
to healthy foods, quality education, and access to healthcare. Minorities are disproportionately
represented in disadvantaged environments where SDOH are unequally distributed or shaped by
poor public policy (Orgera & Artiga, 2018).
Another factor contributing to health outcomes for minority groups are disparities in
healthcare. Healthcare disparities are defined as “…differences or gaps in care experienced by
one population compared with another population” (AHRQ, 2009). Disparities in healthcare are
measured by differences in access to care, quality of care, and cost; examples of these measures
include provider availability, patient safety, and timeliness (AHRQ, 2009).
The Affordable Care Act (ACA), through Medicaid expansion and subsidies in the health
insurance marketplace, helps to reduce health disparities by providing more affordable healthcare
coverage options for people of color and low-income individuals (Orgera & Artiga, 2018). The
ACA also has several provisions designed to reduce health and healthcare disparities, including
managed care plans, cultural competency training, and community-focused educational outreach
(Orgera & Artiga, 2018). Minority populations encounter many barriers to obtaining quality
health and healthcare. As a result, individuals may experience poorer health outcomes and
greater financial burdens. (Oh et al., 2015). Minority populations are also underrepresented in
medical research; they often experience barriers to inclusion, such as cultural and linguistic
differences, time and financial restraints, fear of exploitation, and racial/ethnic biases or
discrimination (Oh et al., 2015). Researchers may also be poorly trained to conduct studies in
minority communities or lack the desire to recruit and retain enough minority participants;
funders may even offer less funding to support minority researchers compared to non-Hispanic
11
missed opportunity to inform research of all factors contributing to health status. Ultimately, this
knowledge can improve both prevention and treatment.
III. Obesity epidemic
Obesity in the U.S. is a complex and multifactorial disease that is a significant challenge for
chronic disease prevention and positive health outcomes for adults and children (Hruby & Hu,
2015). The obesity epidemic has been a growing concern since the mid-1980s; as the country
developed economically, so did urbanization, sedentary lifestyles, and the consumption of
processed foods (Hruby & Hu, 2015). The prevalence of obesity for adults in the U.S. in
2015-2016 was 39.8% (Hales, 2017). Classifications of obesity for adults are derived from body mass
index criteria (BMI). BMI is a measure of an individual’s weight relative to height; the
measurement scale ranges from underweight (<18.5 kg/m2) to severe obesity (≥40 kg/m2) (Hruby
& Hu, 2015). Obesity classification for children differs from adults. Children experience rapid
changes in body composition and sexual development and require a separate measurement scale
(Hruby & Hu, 2015). The U.S. utilizes the CDC’s growth charts to determine age and
sex-specific BMI percentiles for children aged 2-19 years; childhood obesity is classified as greater
than or equal to the 95th percentile (Hruby & Hu, 2015). Specialized growth charts from the
World Health Organization (WHO) are used to determine BMI for U.S. children under the age of
2 years (WHO, 2019).
There are numerous health complications resulting from obesity. Chronic conditions include
hypertension, diabetes, cardiovascular disease, colon and pancreatic cancer, and mental health
disorders (Hruby & Hu, 2015). Minority populations are disparately impacted by obesity and,
consequently, have higher rates of obesity-related complications (Golden, Brown, & Anton,
socio-12
ecological levels. Methods of prevention at the individual level include changes to dietary habits,
increased physical activity, and counseling (CDC, 2019b). Policies and programs to address
obesity range from taxes on unhealthy foods and safety measures to promote physical activity in
urbanized areas to nutrition education for high-risk populations, such as pregnant women and
children (Hruby & Hu, 2015).
IV. Gestational diabetes mellitus (GDM)
Obesity increases the risk for both GDM and T2DM and is an important factor affecting the
health of women and children. GDM is “…any degree of glucose intolerance with onset or first
recognition during pregnancy” (Kim, Deputy, & Robbins, 2018). As the body gains weight to
support the development of the fetus, a shift in hormonal balance may result in insulin resistance.
The body’s need for insulin increases, as does its risk for developing GDM. Current guidelines
recommend that women at risk for preexisting diabetes be screened at their first prenatal visit; all
women should be routinely tested for GDM at 24 weeks gestation (Garrison, 2015). Primary risk
factors for GDM include maternal age and weight at conception, family history of diabetes, and
race or ethnicity. Women who are older than 25, have a BMI greater than 25.0, or have a
first-degree relative with diabetes are at risk for GDM; women of specific minority populations,
including NHB, Hispanic American, AI/AN, Native Hawaiian, or Pacific Islander, are also at
risk (CDC, 2019b). Additional risk factors include diagnosis of polycystic ovarian syndrome
(PCOS), a previous GDM diagnosis, and a history of delivering an infant weighing more than
nine pounds (CDC, 2019b).
Complications resulting from GDM can occur during and after pregnancy. High maternal
blood glucose levels may cause the fetus to store excessive amounts of fat during development;
13
damage (ACOG, 2017). Additional complications include respiratory distress syndrome,
jaundice, hypoglycemia, seizures, and increased risk for stillbirth (ADA, 2019). Women with
GDM may develop high blood pressure and preeclampsia and are more likely to undergo
cesarean delivery (Kim et al., 2018). Postpartum complications resulting from GDM for infants
include increased risk for childhood obesity and T2DM; women are also at increased risk for
T2DM and developing GDM in a future pregnancy (Kim et al., 2018).
Treatment for GDM includes lifestyle modification and pharmacologic treatment. Initial
approaches used to lower abnormal blood glucose values are lifestyle modifications, including
regular physical activity and dietary changes, such as Medical Nutrition Therapy (MNT) (Yuen,
Wong, & Simmons, 2018). Subsequent methods include medication; traditionally, insulin has
been the primary medication used to treat GDM, but other oral medications are now in use, such
as metformin and glyburide (Garrison, 2015). Management of GDM during pregnancy may
require more doctor visits and monitoring of blood sugar levels, while postpartum management
requires both short- and long-term follow-up (Garrison, 2015). Women with GDM should be
screened at 6 to 12 weeks postpartum and then once every three years for T2DM (Garrison,
2015). Key strategies for preventing GDM include starting preconception care early and
maintaining a healthy weight during pregnancy (CDC, 2019b). As minority populations are
disparately impacted by GDM, greater efforts should be introduced to improve surveillance and
research on GDM by racial and ethnic subgroups.
V. GDM and Hispanic health
Hispanic Americans comprise the largest ethnic minority population (18.1%) in the U.S.
(ACS, 2017). All federal agencies, in accordance with the U.S. Office of Management and
14
for collecting and reporting data (USCB, 2019). The OMB recognizes distinct subgroups of the
Hispanic population; the term “Hispanic” is defined as an individual of Mexican, Puerto Rican,
Cuban, South or Central American, or other Spanish origin, regardless of race (USCB, 2019).
Research conducted on Hispanic populations is often consolidated due to insufficient data (Oh et
al., 2015). As a result, important health information is often lost when subgroups are combined
into a single category, reducing the potential impact and ability to target prevention efforts.
Analysis of subgroups is critical for both surveillance and research in Hispanic health.
There are a number of identified risk and protective factors associated with increased risk for
disease among Hispanic populations, including genetic predisposition, health behaviors, and
social/cultural influences; each factor varies by Hispanic subgroup. For example, South
American women were more likely to eat greater quantities of vegetables compared to other
subgroups (Noia et al., 2016). Hispanic Americans of Mexican descent have greater rates of
hyperinsulinemia and insulin resistance compared to NHWs (Golden et al., 2012). Puerto Rican
(30%) and Cuban Americans (29%) attain high school diplomas at higher rates than Mexican
Americans (26%) (PRC, 2012). Puerto Ricans are more likely to smoke cigarettes compared to
other Hispanic subgroups (Kaplan et al., 2014). Obesity rates are significantly higher among
U.S.-born compared to immigrant Hispanic Americans (Golden et al., 2012). Interestingly, some
research shows that immigrant Hispanic women have higher prevalence of GDM than U.S.-born
women (Yuen & Wong, 2015; Hedderson, Darbinian, &Ferrara, 2010; Savitz, Janevic, Engel,
Kaufman, & Herring, 2008). Acculturation and maternal nativity are important predictors of
Hispanic health outcomes and help explain the Hispanic paradox. This phenomenon refers to the
finding that some Hispanic subgroups tend to experience equal or better health outcomes than
15
insurance (CDC, 2015). According to a 2015 report from the CDC, Hispanics showed a 24%
lower all-cause mortality rate compared to NHWs (CDC, 2015). Although Hispanic Americans
have lower overall rates of mortality, they have higher rates of morbidity compared to NHWs,
especially for chronic conditions, including obesity, T2DM, liver disease, and kidney disease
(PRC, 2012). As previously discussed, the relationship between obesity and diabetes is complex.
Conducting research on GDM by Hispanic subgroup will help provide more accurate
information to inform and target prevention efforts, reduce the incidence of GDM, and help
minimize other chronic diseases among Hispanic populations.
VI. Research questions
This study will address the following research questions using data from the National Vital
Statistic System: 1) Does GDM occur at different rates among different Hispanic subgroups? 2)
16
CHAPTER II
LITERATURE REVIEW
I. Health disparities and disparities in minority representation in health research Achieving health equity requires addressing disparities in health and healthcare. Numerous
reports have documented disparities based on race and ethnicity, geography, socioeconomic
status, and other social determinants of health (CMA, 2019; Orgera & Artiga, 2018; USDHHS,
2008). A study by Singh, et al. (2017), looking at national survey data from 1935 to 2016,
reviews many of these disparities. The study points out the 12-year gap in life expectancy
between Asian/Pacific Islanders and NHBs as well as the 2.3-fold higher infant mortality rate for
NHB infants (11.7 per 1,000 live births) compared to NHW infants (4.9). Infant and child
mortality rates were also higher in rural areas compared to urban areas (Singh et al., 2017). They
pointed out that diabetes prevalence was also highest among AIANs (20.9%), NHBs (13.1%),
and Hispanics (12.2%), and these higher rates were also associated with lower socioeconomic
status and southern geographical location (Singh et al., 2017).
Other reports also document disparities in healthcare access and quality. Minority
populations experience more barriers to healthcare access and are also less likely to feel satisfied
with healthcare provider interactions, compared with NHWs (Hall et al., 2015). The 2013
National Healthcare Disparities Report revealed that minority patients receive worse quality care
than NHW patients, including less patient-centered patient- providers interactions (AHRQ,
2013). While advances in healthcare have continued to develop, disparities in health and
healthcare by race and ethnicity persist.
Improving minority representation in healthcare research is a critical step to informing and
17
recruitment and retention strategies for low-income, minority, and underserved populations in
clinical research studies with health outcomes from 2004 to 2014. During this period,
improvements were made in the inclusion of racial/ethnic minorities, but the authors reported
significant remaining deficiencies. Of the 165 articles included in their study, 41.8% focused on
NHB populations, followed by Latinos/Latinas/Hispanics (29.1%), and Native Americans
(2.4%); other articles focused more generally on minority (25.5%), low-income/underserved
(12.1%), rural (6.7%), and multiethnic (1.2%) populations (Nicholson et al., 2015). The study
also highlighted prominent themes discovered in their literature review. Barriers to recruitment
and retention was among the most prominent themes, specifically minority participation,
language barriers, and participant perceptions (trust/mistrust). Several studies illustrated
minorities’ perceptions regarding informed consent, believing that it renounces an individual’s
rights rather than protecting them (Nicholson et al., 2014). Other identified barriers to
participation in health research by minorities include lack of access to information, fear of
discrimination, stigma surrounding mental or genetic disorders, fear of deportation, and
time/financial constraints (George, Duran, & Norris, 2014).
Disparities in minority research participation are also the result of poor promotion by
principal investigators and poorly trained researchers. A 2014 study, conducted in South
Carolina, disseminated an online survey to clinical trial principal investigators (PIs) working at
the state’s main academic medical centers. PIs were asked to rate their experience in recruiting
and retaining patients for clinical trials in general, from NHB communities, and from rural
communities. PIs reported recruiting and retaining patients from rural communities the most
difficult, followed by the general public, and then NHB communities (Tanner, Kim, Friedman,
18
their existing patient pool and local doctors, compared to other modes of communication, such as
community organizations, social service providers, health centers, or faith-based organizations
(Tanner et al., 2014). This study portrays the importance of educating investigators and other
members of research teams about best practices for promoting clinical trials to underrepresented
communities.
II. Obesity as a confounder for chronic and adverse pregnancy outcomes
Obesity is a major confounding factor for many chronic diseases, especially among minority
populations (CDC, 2018a). Linked to increased risk for hypertension, diabetes, cardiovascular
disease, and metabolic syndrome, obesity is a serious condition from which minority populations
are disparately affected (CDC, 2018a). For example, a population-based retrospective cohort
study, utilizing data from the 1985 to 2011 California Behavioral Risk Factor Survey (CA
BRFS), observed trends in the prevalence of obesity and its association with chronic conditions
among minority populations. The CDC partnered with the California Department of Public
Health (CDPH) to develop CABRFS, which evaluates trends in health-related behaviors among
Californians 18 years or older. The study found that obesity prevalence was highest in NHBs
(33.3%) and Hispanics (28.8%) and lowest in Asians (9.0%) (Wong, Chou, & Ahmed, 2014).
Additionally, compared to NHWs, the odds of obesity were greater for NHBs (OR = 1.51) and
Hispanics (OR= 1.18), and lower for Asians (OR =0.37) (Wong et al., 2014). Higher odds of
obesity were significantly associated with the presence of diabetes (OR =2.35) and hypertension
(OR =2.28) (Wong et al., 2014).
Not only does obesity prevalence vary by race and ethnicity, it also affects these populations
throughout the lifespan. A study of repeated cross-sections of the National Health and Nutrition
19
prevalence among children, ages 2 to 19, by race/ethnicity (Skinner & Skelton, 2014). Increasing
obesity prevalence rates among Hispanic females and NHB males showed a linear trend (Skinner
& Skelton, 2014). Sarathy, et al. (2016) analyzed NHANES data from 1999 to 2010 to observe
the relationships between race, abdominal obesity, and chronic kidney disease (CKD) among
young adults aged 20 to 40 years. The study also reports that abdominal obesity is present in
one-third of all young adults but more prevalent among NHBs (45.4%) and Mexican Americans
(40.6%) than NHWs (37.4%) (Sarathy et al., 2016). Additionally, Mexican American young
adults with abdominal obesity had higher odds of having albuminuria (OR= 4.5), a marker for
CKD, compared to NHWs (Sarathy et al., 2016). Yang & Zhang (2014) evaluated the impact of
overweight and obesity on long-term care (LTC) and Medicaid financing using nationally
representative Cost and Use Files of the Medicare Current Beneficiary Survey from 1997 to
2005. Based on their analysis, the authors predict that, at the population level, overweight and
obesity would generate 1.3 billion or more LTC patient days and $68 billion or more in Medicaid
costs among baby boomers in 2012 (Yang & Zhang, 2014). In addition, regression model results
indicated that race (NHB versus NHW) is a predictor for increased use of a LTC facility and
increased Medicaid costs (Yang & Zhang, 2014).
Among minority populations, obesity is also a risk factor for complications during pregnancy
and adverse pregnancy outcomes. Cavicchia, et al. (2014) assessed race-specific proportions of
GDM attributable to overweight and obesity in South Carolina. Birth certificate and hospital
discharge data from 2004 to 2006 were analyzed. The prevalence of GDM was higher among
NHB women (18.1%), compared to NHW (14.0%) and Hispanic women (9.6%) (Cavicchia et
al., 2014). The percent of GDM attributable to obesity for all racial groups was approximately
pre-20
pregnancy obesity and gestational weight gain on adverse pregnancy outcomes among women
who visited the OB/GYN Treatment Center at the Advocate Illinois Masonic Medical Center in
Chicago. Women with a singleton pregnancy and pre-pregnancy BMI of 30 or greater were
included in the analysis. After stratification for ethnicity, they found that NHB women (58.6%)
and Mexican American women (44.3%) had higher rates of obesity, compared to NHW women
(18.3%) (Tien et al., 2014). NHB women also had the highest BMI at delivery, were more likely
to have 1 or more maternal complications (37.8%), and were more likely to have 1 or more fetal
complications (30.9%) than NHW women (Tien et al., 2014). Lastly, Anderson, Spicer, &
Peercy (2016) examined the relationship between obesity, diabetes, and birth outcomes among
AI/AN populations using U.S. birth data from 2009 to 2013. The rates of obesity (26.4%),
pre-pregnancy diabetes (1.1%), and GDM (4.3%) were higher among AI/AN than NHW (obese =
19.2%, diabetes= 0.6%, GDM= 4.0%). Additionally, obese AI/AN women (11.3%) were more
likely to have preterm births than NHW (8.8%) and Hispanic women (10.3%), and were more
likely to have infants with macrosomia than all other groups (AI/AN=8.7%, NHW=8.2%,
NHB=3.8%, Hispanic=5.5%) (Anderson et al., 2016).
III. GDM and disparities in minority health
GDM disproportionately impacts minority populations in the U.S., especially among Asian
and Hispanic populations. For instance, a retrospective cohort study examined the racial/ethnic
differences in GDM prevalence and the contribution of common risk factors among pregnant
women, aged 18 to 45, in California between 2007 and 2012 (Pu et al., 2015). Data was
identified through California birth certificates and linked with electronic health records from the
study healthcare organization. In addition to examining NHB and Hispanic populations, the
21
Japanese, Korean, and Vietnamese). With the exception of those from Korea (12.9%) and Japan
(9.7%), age-adjusted GDM prevalence was highest among Asian Americans (Asian Indians
(19.3%), Filipinos (19.0%), Vietnamese (18.8%), and Chinese (15.3%)), followed by Hispanics
(13.3%), NHW (7.0%), and NHBs (4.9%) (Pu et al., 2015). Relative risk of GDM was still
higher for Asian subgroups and Hispanics compared to NHWs after controlling for maternal
education, parity, smoking, and insurance type; NHBs had a significantly lower risk of GDM
compared with NHWs (Pu et al., 2015).
Other minority population group risk factors analyzed in research of GDM assessed maternal
age, initiation of prenatal care, and insurance coverage. Liu, Lamerato, & Misra (2019) analyzed
the relationship between race/ethnicity, maternal age at delivery, and the risk of GDM. Female
patients of the Henry Ford Health System who were diagnosed with GDM and delivered a
singleton infant between 2010 to 2015 were included in the analysis. Older maternal age at
delivery was associated with significantly higher odds of GDM (OR= 5.02) (Liu et al., 2019).
GDM diagnosis, after controlling for age, BMI, parity, previous GDM, smoking status, and
neighborhood family income, was significantly higher among Asians (OR= 2.81), Hispanics
(OR= 1.27), and Arab Americans (OR= 1.46), and lower among NHBs (OR =0.64) compared to
NHWs (Liu et al., 2019). Other studies, though not including Hispanic populations, demonstrate
the variation in GDM risk factors and prevalence among other minority subpopulations.
Sanchalicka & Teresa (2015) examined the difference in prevalence, risk factors, and
complications of GDM among South Asian immigrants living in New Jersey (NJ), including
immigrants from India, Bangladesh, Pakistan, and Sri Lanka. Hospitalization data from 1999 to
2002 was linked to NJ birth certificates. The authors found minor differences in prevalence and
22
compared to other South Asian subgroups (Sanchalicka & Teresa, 2015). A retrospective cohort
study was conducted using Hawaiian Pregnancy Risk Assessment Monitoring System (PRAMS)
data from 2009 to 2011, linked with Hawaiian birth certificates to examine the associations
between GDM, macrosomia, and race/ethnicity (Tsai, Roberson, & Dye, 2013). Asian and
Pacific Islander (API) subpopulations included in analysis were Hawaiian, Samoan, Guamanian,
Filipina, Japanese, Chinese, Korean, Vietnamese, Asian Indian, and other Asian women. Minor
differences in prevalence of GDM existed between subgroups; Filipina women had the highest
prevalence of GDM (13.1%) compared to other API subgroups (Tsai et al., 2013).
IV. GDM and Hispanic subgroups
Hispanic women are disproportionately impacted by GDM. U.S. Hispanic women experience
GDM rates two to four times higher than NHW women (Perera et al., 2018; DeSisto, Kim, &
Sharma, 2014). Race and ethnicity are non-modifiable risk factors that directly and indirectly
impact risk for GDM and contribute to maternal and child health. Among 12 states reporting
GDM by race/ethnicity in 2015, Hispanic women had the highest relative increase in GDM
deliveries (66%) from 2000 to 2010 (Bardenheier et al., 2015). Research conducted on the
prevalence of GDM by Hispanic subgroups is limited, but previous subgroup analysis does
demonstrate differences among Hispanic populations. A cross-sectional study from the 2008 to
2011 Hispanic Community Health Study/Study of Latinos (HCHS/SOL) examined the
prevalence of GDM and cardiovascular risk factors among U.S. Hispanics/Latinas. Subgroups
included in this analysis identified as Mexican, Dominican, Puerto Rican, Cuban, Central
American, and South American. Dominican women had the highest prevalence of GDM (5.1%),
23
(1.8%), and Cuban (1.8%) (Perera et al., 2018). In this study, cardiovascular risk factors for
GDM were not analyzed by Hispanic subgroup, but by history of GDM.
Examining risk factors by Hispanic subgroups is important because Hispanic women are
expected to have the largest increase in births during the next decade compared to other ethnic
groups in the U.S. (Kim et al., 2013). Kim, et al. (2013) calculated the percentages of
racial/ethnic-specific GDM attributable to overweight and obesity in California during 2007 to
2009. Data from birth certificates linked with hospital discharge records of women aged 20 years
or older with live, singleton births and diagnosis of GDM were used for analysis. Among other
minority subgroups, Hispanics were categorized as Mexican, Central/South American, Puerto
Rican, and Cuban. The highest prevalence of GDM was found among Mexicans (8.7%),
followed by Central/South Americans (7.4%), Puerto Ricans (6.6%), and Cubans (5.5%) (Kim et
al., 2013). After adjusting for age, parity, and nativity, Cubans (RR =3.3) had the highest risk of
GDM attributable to obesity compared to other Hispanic subgroups (Kim et al., 2013). Another
study in Florida observed similar prevalence among Hispanic subgroups after analyzing birth
certificate and hospital discharge data from 2004 to 2007 (Kim et al., 2012). Race/ethnicity
subgroups included Mexican, Puerto Rican, Central/South American, and Cuban. Prevalence of
GDM was highest for Mexicans (6.0%), followed by Puerto Ricans (5.3%), Central/South
American (4.6%), and Cubans (4.4%) (Kim et al., 2012). After adjusting for age and parity,
Puerto Rican women (RR =3.2) had consistently higher risk of GDM attributable to obesity
compared to other Hispanic subgroups (Kim et al., 2012).
Other risk factors, such as maternal nativity, vary by Hispanic subgroup. Hedderson et al.
(2010) examined the associations between maternal country of birth and risk factors for GDM.
24
Hispanics category included Central/South Americans, Puerto Ricans, Cubans, and other
Hispanic origin not stated. Mexicans had a higher prevalence rate (7.1%) compared to the other
combined subgroups (5.4%) (Hedderson et al., 2010). Mexican women born outside the U.S.
were also more likely to have GDM (31.4%) than U.S. born Mexican women (17.5%)
(Hedderson et al., 2010).
Adverse pregnancy outcomes also vary by Hispanic group. Mocarski & Savitz (2012)
examined the ethnic variation in the impact of GDM on birth outcomes using 2001 to 2006 birth
certificate data from New York City. Hispanic ethnicities included Mexican, Caribbean (i.e.
Cuban and Puerto Rican), and Central/South American. Prevalence of GDM was highest among
Central/South Americans (17.9%), followed by Mexicans (11.0%), and Caribbean women
(8.4%) (Mocarski & Savitz, 2012). Four major birth outcomes were included in analysis:
pregnancy-induced hypertensive disorder (PIHD), macrosomia, preterm birth, and cesarean
delivery. Among Hispanic women with GDM, Caribbean women had the highest adjusted odds
for all birth outcomes analyzed, except for preterm birth, compared to other Hispanic subgroups
without GDM (PIHD: aOR= 2.9; macrosomia: aOR =1.8; cesarean delivery: aOR =1.8). The
adjusted odds for preterm birth among women with GDM was the same for all three Hispanic
subgroups (aOR =1.8), compared to women without GDM (Mocarski & Savitz, 2012). More
research on GDM by Hispanic subgroup is needed to understand all the factors contributing to
25
CHAPTER III
METHODS AND PROCEDURES
I. Data source and approval
Data used for this analysis were obtained from the 2017 vital birth statistics datafile from the
National Vital Statistics System (NVSS). The NVSS is a division within the National Center for
Health Statistics (NCHS). The data is collected by vital registration systems throughout the U.S.
and compiled by the NVSS. Registration systems are established in all 50 states, 2 cities
(Washington D.C. and New York City), and 5 territories (Puerto Rico, the Virgin Islands, Guam,
American Samoa, and the Commonwealth of the Northern Mariana Islands) (CDC, 2016). Vital
birth statistics from 2017, the data utilized for this project, were collected from live birth
certificates. The file contains information on demographic characteristics of the mother and
father and the medical/public services utilized throughout the pregnancy, as well as maternal and
infant health characteristics, such as mother’s BMI, cigarette smoking during pregnancy, and
congenital abnormalities of the infant (NCHS, 2017). The file utilized for this thesis contains
secondary public use data and does not require International Review Board (IRB) approval. Vital
birth statistics from the NVSS is an exempt data source, as established by the IRB policies and
procedures at Georgia State University (GSU, 2019).
II. Inclusion/exclusion criteria
The 2017 datafile of vital birth statistics contained 3,864,754 observations and 240 variables.
The population of interest included women of Hispanic origin whose report indicated they were
diagnosed with, or without, GDM. As a point of comparison, NHW women whose report
indicated they were diagnosed with, or without, GDM were also included in the final sample.
26
analysis. Additionally, women whose report indicated unknown information regarding other
study variables were excluded from analysis. The final sample size used for this project included
2,575,271 observations.
III. Independent/dependent variables
The independent variables used for this project included race/ethnicity, nativity (U.S. or
foreign born), maternal age, maternal education level, BMI category, month of gestation prenatal
care began, number of prenatal visits, cigarette use during pregnancy, and enrollment in WIC
(Special Supplemental Nutrition Program for Women, Infants, and Children) services.
Race/ethnicity categories included NHW, Mexican, Puerto Rican, Cuban, and Central/South
American. NHW was the reference category. The age range for mothers was 10 to 54 years;
maternal age was recoded into three categories: less than 25 years, 25 to 34 years, greater than 35
years. The reference category for maternal age was less than 25 years. Maternal education level
was recoded into three categories: less than high school, high school graduate/GED, and greater
than high school. Greater than high school was the reference category.
BMI was recoded into two categories: under/normal weight, overweight/obese; BMI data
was determined using pre-pregnancy weight. The BMI range for the under/normal weight
category was <18.5 to 24.9 kg/m2 and the BMI range for overweight/obese category was 25.0 to
>40 kg/m2. The reference category for BMI was under/normal weight. Cigarette use and WIC
enrollment were dichotomous variables coded as either Yes or No and the reference category for
both variables was No. Month prenatal care began was divided into three categories: No prenatal
care, 1st trimester (prior to week 13 of gestation), and later than 1st trimester (week 13 or later).
27
numeric variable, with a range of 0 to 98. The dependent variable for this study was GDM
diagnosis.
Recognizing that there can be overlap and multiple associations between variables for this
analysis, they’ve been classified into two groups: critical and non-critical covariates. Critical
covariates are variables expected to be causal or expected to have a strong relationship with the
dependent variable based on review of the literature. The critical covariates included for this
analysis are race/ethnicity, maternal age, education level, BMI, and enrollment in WIC services.
Enrollment in WIC services is used as a proxy for income level, as individuals enrolled in WIC
services tend to come from low-income families. A non-critical covariate is a variable expected
to be considered in the model based on research convention, rather than review of the literature
or a priori reasoning. The non-critical covariates included for this analysis are cigarette use
during pregnancy, month prenatal care began and number of prenatal visits.
IV. Statistical analysis
Exploratory analysis included frequency distributions for categorical variables and measures
of central tendency and dispersion for numeric variables. Pearson’s chi-square (X2) test was used
to compare rates of categorical study variables across racial/ethnic subgroups. Kruskal-Wallis
with Mann-Whitney U post-hoc was used to compare mean values of continuous study variables
across racial/ethnic groups. Odds ratios from univariate logistic regression analysis were
calculated to estimate risk of GDM due to each independent study variable. NHW and Hispanic
group-specific multiple logistic regression analyses were used to test and compare factors
associated with GDM. Multivariate regression analyses only included statistically significant
variables in the model. Multivariate regression models allow for the control of confounders by
28
techniques allow for adjustment of different independent variables, such as age, in the model to
determine the prevalence of GDM. Odds ratios from each multivariate regression table were
compiled into one table to compare how risk factors for developing GDM varied by racial/ethnic
group. Odds ratios greater than 2 were considered to have substantive magnitude for this project.
Statistical analysis for this study was conducted using R, version 3.5. Statistical significance was
29
CHAPTER IV
RESULTS
I. Population of women having live births for analysis
The inclusion and exclusion criteria for this project are reflected in Table 4.1. For the
purposes of this project, racial/ethnic groups were divided into four categories: non-Hispanic
White, Hispanic, other non-Hispanic, and those with unknown Hispanic origin. As reflected in
Table 4.1, among the 3,864,754 women having live births in 2017, 1,993,312 (51.6%) were
NHW, 932,771 (24.1%) were other non-Hispanic, 759,008 (25.3%) were Hispanic, and 179,663
(4.7%) were women with unknown Hispanic origin. Women categorized as other non-Hispanic
or having unknown Hispanic origin were excluded from analysis. As reflected in Table 4.1, both
NHW and Hispanic women with unknown values for any study variable were excluded from
analysis. The proportions of unknown values for each study variable category were
approximately the same for NHW and Hispanic women; additionally, for both categories, the
highest percentages of missing information were found among BMI, month prenatal care began,
and number of prenatal visits. In total, approximately one-third of the observations, 1,361,655
(35.3%), were excluded due to alternate racial/ethnic categories (24.1%) and missing information
(11.2%). The final sample size for this project was 2,575,271, and included NHW and Hispanic
women, both diagnosed with, and without, GDM. The total number of live births among NHW
women after excluding all missing study variable observations was 1,873,192. Among the total
number of live births for NHW women, 1,765,519 (68.6%) were not diagnosed with GDM, and
107,673 (4.2%) were diagnosed with GDM. The total number of live births among Hispanic
30
number of live births for Hispanic women, 652,381 (25.2%) were not diagnosed with GDM, and
[image:31.612.79.541.162.657.2]49,698 (1.9%) were diagnosed with GDM.
Table 4.1. Inclusion and exclusion criteria and missing responses.
Race/ethnicity (n=3,864,754) Count (%)
Total number of Non-Hispanic White (NHW) women 1,993,312 (51.6) Total number of other Non-Hispanic women (Black, Asian, etc.) 932,771 (24.1) Total number of Hispanic women 759,008 (19.6) Total number of women with unknown/unstated Hispanic origin 179,663 (4.7)
NHW women with missing observations, by variable* (n=1,993,312)
Total number of NHW women with unknown nativity 2,517 (0.1) Total number of NHW women with unknown education level 9,983 (0.5) Total number of NHW women with unknown BMI status 39,083 (2.0) Total number of NHW women with unknown cigarette use during pregnancy 8342 (0.4) Total number of NHW women with unknown WIC status 19,777 (1.0) Total number of NHW women where month prenatal care began is unknown 42,238 (2.1) Total number of NHW women where number of prenatal visits is unknown 44,531 (2.2) Total number of NHW women with unknown GDM status 1,702 (0.1) Total number of missing observations for NHW women 168,173 (8.4)
Hispanic women with missing observations, by variable* (n=759,008)
Total number of Hispanic women with unknown nativity 789 (0.1) Total number of Hispanic women with unknown education level 9,480 (1.3) Total number of Hispanic women with unknown BMI status 21,707 (2.9) Total number of Hispanic women with unknown cigarette use during pregnancy 3530 (0.5) Total number of Hispanic women with unknown WIC status 7,070 (0.9) Total number of Hispanic women where month prenatal care began is unknown 19,133 (2.5) Total number of Hispanic women where number of prenatal visits is unknown 18,784 (2.5) Total number of Hispanic women with unknown GDM status 555 (0.1) Total number of missing observations for Hispanic women 81,048 (10.7)
NHW women GDM cases after removal (n=1,873,192)
Total number of NHW women without GDM 1,765,519 (94.3) Total number of NHW women with GDM 107,673 (5.7)
Hispanic women GDM cases after removal (n=702,079)
31
II. Percent of demographic and behavioral characteristics
Demographic and behavioral characteristics among all women included in the study were
different between Hispanic subgroups and compared with NHWs (see Table 4.2). Mexican
American women had the highest percentage of GDM (7.4%) compared to NHWs (5.8%), and
Cubans (5.7%), with the lowest percentage. Foreign-born status was highest among CSA women
(82.5%) but was substantially higher compared to other Hispanic subgroups (range 28%-55.9%)
and NHWs (6.6%). Puerto Rican American women (36.2%) had the highest percentage of
women under the age of 25 and NHWs reported the lowest (20.8%). Cuban American women
(62.6%) had the greatest percentage of women aged 25 to 34, while Puerto Rican Americans
(50.5%) had the lowest. CSA women (22.3%) had the highest percentage of women aged 35 or
older, compared to the lowest among Puerto Rican Americans (13.3%). CSA women (37.7%)
also had the greatest percentage of women who had less than a high school education, while
NHWs (7.1%) had the lowest. Among women who completed high school, Cuban American
(34.5%) and Mexican American (34.4%) had the highest percentages, compared to the lowest
among NHWs (21.1%). NHW women (71.8%) had the greatest percentage of women who
pursued education after high school and Mexican American women (36.8%) had the lowest.
Sixty-two percent of Mexican American women were classified as overweight/obese based
on their BMI. In other Hispanic subgroups this ranged from 50.2%-59.7%, compared to NHWs
at 49.9%. NHW women had considerably higher percentages of smoking during pregnancy
(10%), compared to 0.5%-5.9% for Hispanic subgroups. Hispanic subgroups also had higher
percentages for use of WIC services during pregnancy. This was greatest for Mexican American
women (59.1%), ranging from 52.3%-57.2% for other Hispanic subgroups compared to 25% for
32
Cuban American women (82.4%) had the highest percentages, compared to the lowest among
CSA women (68.3%). CSA women (29.5%) had the highest percentage of women who began
prenatal care later than the first trimester, compared to the lowest among Cuban Americans
(16.5%) and NHWs (16.3%). Mexican American women (2.4%) had the highest percentage of
women who did not receive prenatal care during pregnancy and NHWs (1%) had the lowest. The
median number of prenatal visits was highest among NHW (12) and Cuban American women
(12), compared to the lowest among CSA women (11). Differences across racial/ethnic groups
for all study characteristics exceeded traditional thresholds for statistical significance (p<0.05).
Additional tables comparing racial/ethnic groups among women who were diagnosed with GDM
and women who were not diagnosed with GDM were generated to evaluate the data from
33
Table 4.2. Demographic and behavioral characteristics of NHW and Hispanic subgroups of women (n=2,575,271).
Count (%) Non-Hispanic White 1,873,192 (72.7) Central/South American 130,907 (5.1) Cuban 21,527 (0.8) Mexican 485,479 (18.9) Puerto Rican 64,166 (2.5) Total 2,575.271 p-value*
Gestational Diabetes <.0001
No 1,765,519 (94.3) 122,346 (93.5) 20,293 (94.3) 449,730 (92.6) 60,012 (93.5) 2,417,900 (93.9) Yes 107,673 (5.8) 8,561 (6.5) 1,234 (5.7) 35,749 (7.4) 4154 (6.5) 157,371 (6.1)
Nativity <.0001
U.S. born 1,748,990 (93.4) 22,851 (17.5) 9,489 (44.1) 266,501 (54.9) 46,196 (72.0) 2,094,027 (81.3) Foreign born 124,202 (6.6) 108,056 (82.5) 12,038 (55.9) 218,978 (45.1) 17,970 (28.0) 481,244 (18.7)
Maternal age <.0001
Less than 25 389,505 (20.8) 31,797 (24.3) 4,516 (21.0) 162,657 (33.5) 23,250 (36.2) 611,725 (23.8)
25 to 34 1,150,663 (61.4) 69,958 (53.4) 13,478 (62.6) 247,415 (51.0) 32,395 (50.5) 1,513,909 (58.8) 35 or older 333,024 (17.8) 29,152 (22.3) 3,533 (16.4) 75,407 (15.5) 8,521 (13.3) 449,637 (17.5)
Education <.0001
Greater than high school 1,345,889 (71.8) 50,500 (38.6) 12,299 (57.1) 178,645 (36.8) 32,210 (50.2) 1,619,543 (62.9) High school grad/GED 394,821 (21.1) 30,988 (23.7) 7,418 (34.5) 167,052 (34.4) 21,188 (33.0) 621,467 (24.1)
Less than high school 132,482(7.1) 49,419 (37.7) 1,810 (8.4) 139,782 (28.8) 10,768 (16.8) 334,261 (12.9)
Body mass index (BMI) <.0001
Under/Normal weight 938,999 (50.1) 59,195 (45.2) 10,714 (49.8) 183,759 (37.9) 25,838 (40.3) 1,218,505 (47.3)
Overweight/Obese 934,193 (49.9) 71,712 (54.8) 10,813 (50.2) 301,720 (62.1) 38,328 (59.7) 1,356,766 (52.7)
Cigarette use during pregnancy <.0001
No 1,685,747 (90.0) 130,270 (99.5) 21,127 (98.1) 478,720 (98.6) 60,404 (94.1) 2,376,268 (92.3) Yes 187,445 (10.0) 637 (0.5) 400 (1.9) 6,759 (1.4) 3,762 (5.9) 199,003 (7.7)
Enrollment in WIC services <.0001
No 1,405,292 (75.0) 56,059 (42.8) 10,267 (47.7) 198,476 (40.9) 28,035 (43.7) 1,698,129 (65.9) Yes 467,900 (25.0) 74,848 (57.2) 11,260 (52.3) 287,003 (59.1) 36,131 (56.3) 877,142 (34.1)
Month prenatal care began <.0001
1st trimester 1,549,754 (82.7) 89,379 (68.3) 17,740 (82.4) 348,705 (71.8) 48,957 (76.3) 2,054,535 (79.8)
Later than 1st trimester 304,152 (16.3) 38,646 (29.5) 3,553 (16.5) 125,223 (25.8) 14,373 (22.4) 485,947 (18.9) No prenatal care 19,286 (1.0) 2,882 (2.2) 234 (1.1) 11,551 (2.4) 836 (1.3) 34,789 (1.3)
Median (IQR)
Number prenatal visits 12 (10-14) 11 (8-13) 12 (10-15) 11 (9-13) 11 (9-13) 12 (10-14) <.0001
34
III. Unadjusted univariate logistic regression models
The odds of GDM among all women were estimated for each study variable using several
unadjusted univariate logistic regression models (see Table 4.3). Compared to NHWs, the odds
of GDM were higher among Mexican American (OR = 1.30), CSA (OR = 1.15), and Puerto
Rican American women (OR = 1.14), and lower among Cuban American women (OR = 0.99).
Maternal age and BMI had the highest odds ratios of each independent study variable among all
women. Compared to women under the age of 25, the odds of GDM were higher among women
aged 25 to 34 (OR = 1.86) and women 35 or older (OR = 3.25). Similarly, overweight and obese
women had greater odds of GDM compared to women classified as underweight or normal
weight (OR = 2.84). Women who used cigarettes had lower odds of GDM compared to women
who did not (OR = 0.97). Study variables identified as having a less strong association with
GDM included: nativity, education, enrollment in WIC services, month prenatal care began, and
35
Table 4.3. Results of unadjusted univariate logistic regression models exploring relationships between each study variable and GDM status among all women.
Variable Odds Ratio 95% Confidence Interval
Lower Upper
Race/ethnicity
Non-Hispanic White Reference
Central/South American 1.147 1.122 1.174 Cuban 0.997 0.941 1.056 Mexican 1.304 1.288 1.320 Puerto Rican 1.135 1.099 1.172
Nativity
Born in the U.S. Reference
Born outside the U.S. 1.416 1.399 1.433 Maternal age
Less than 25 Reference
25 to 34 1.859 1.831 1.888 35 or greater 3.253 3.198 3.308 Education
Greater than high school Reference
High school grad/GED 1.003 0.990 1.015 Less than high school 1.164 1.147 1.181 Body mass index (BMI)
Under/Normal weight Reference
Overweight/Obese 2.836 2.804 2.870 Cigarette use during pregnancy
No Reference
Yes 0.967 0.948 0.985
Enrollment in WIC services
No Reference
Yes 1.156 1.143 1.168
Month prenatal care began
1st trimester Reference
36
IV. Adjusted multivariate logistic regression models
The odds of GDM among all women were estimated for all study variables using an
adjusted multivariate logistic regression model as reflected in Table 4.4. Compared to
NHWs, Cuban American and CSA women had lower odds of GDM (Cuban: OR = 0.85;
CSA: OR = 0.87) while Mexican and Puerto Rican American women had greater odds of
GDM (Mexican: OR = 1.08; Puerto Rican: OR = 1.05). Maternal age, BMI, and nativity had
the strongest association with GDM among the study variables for all women. Compared to
women under the age of 25, the odds of GDM were higher among women aged 25 to 34 (OR
= 1.93) and women 35 or older (OR = 3.26). Women with lower educational attainment also
had greater odds of GDM. Compared to women born in the U.S. with an underweight/normal
BMI, the odds of GDM was higher for foreign-born women with underweight/normal BMI
(OR = 1.45), higher for U.S.-born women with overweight/obese BMI (OR = 2.78), and
highest for foreign-born women with overweight/obese BMI (OR = 3.33). Study variables
identified as having less strong associations with GDM included: education, cigarette use
during pregnancy, enrollment in WIC services, month prenatal care began, and number of
37
Table 4.4. Results of adjusted multivariate logistic regression model exploring relationships between each study variable and GDM status among all women.*
95% Confidence Interval
Variables Odds Ratio Lower Upper
Race/ethnicity
Non-Hispanic White Reference
Central/South American 0.872 0.849 0.895
Cuban 0.845 0.797 0.897
Mexican 1.080 1.063 1.097 Puerto Rican 1.052 1.017 1.087 Maternal age
Less than 25 Reference
25 to 34 1.926 1.895 1.957 35 or greater 3.263 3.204 3.323 Education
Greater than high school Reference
High school/GED 1.101 1.086 1.117 Less than high school 1.163 1.142 1.184 Cigarette use during pregnancy
No Reference
Yes 1.120 1.097 1.143
Enrollment in WIC services
No Reference
Yes 1.137 1.123 1.152
Month prenatal care began
1st trimester Reference
Later than 1st trimester 1.129 1.113 1.145 No prenatal care 0.895 0.835 0.959 Number of prenatal visits 1.067 1.065 1.068 Nativity_BMI**
U.S. Born and Under/Normal weight Reference
Foreign Born and Under/Normal weight 1.446 1.411 1.482 U.S. Born and Overweight/Obese 2.782 2.744 2.820 Foreign Born and Overweight/Obese 3.330 3.263 3.399
*Multivariate model adjusted for nativity, maternal age, education, BMI,
cigarette use during pregnancy, WIC services, month prenatal care began, and
number of prenatal visits
38
The odds of GDM among NHW women were estimated for each study variable using an
adjusted multivariate logistic regression model (see Table 4.5). Maternal age, BMI, and nativity
had the highest odds ratios among all study variables for NHW women. Compared to women
under the age of 25, the odds of GDM were higher for both women aged 25 to 34 and women
aged 35 years or older (OR = 1.77 and 2.86, respectively). Compared to women born in the U.S.
with an underweight/normal BMI, the odds of GDM was higher for foreign-born women with
underweight/normal BMI (OR = 1.42), higher for U.S.-born women with overweight/obese BMI
(OR = 2.78), and highest for foreign-born women with overweight/obese BMI (OR = 3.32).
Study variables identified as having less strong associations with GDM included: education,
cigarette use during pregnancy, enrollment in WIC services, month prenatal care began, and
39
Table 4.5. Results of adjusted multivariate logistic regression model exploring relationships between each study variable and GDM status among NHW women.*
95% Confidence Interval
Variables Odds Ratio Lower Upper
Maternal age
Less than 25 Reference
25 to 34 1.767 1.732 1.804
35 or greater 2.857 2.792 2.923 Education
Greater than high school Reference
High school/GED 1.075 1.057 1.093 Less than high school 1.021 0.992 1.051 Cigarette use during pregnancy
No Reference
Yes 1.118 1.094 1.143
Enrollment in WIC services
No Reference
Yes 1.169 1.150 1.187
Month prenatal care began
1st trimester Reference
Later than 1st trimester 1.109 1.088 1.130 No prenatal care 0.917 0.832 1.010 Number of prenatal visits 1.067 1.065 1.069 Nativity_BMI**
U.S. Born and Under/Normal weight Reference
Foreign Born and Under/Normal weight 1.424 1.373 1.477 U.S. Born and Overweight/Obese 2.779 2.739 2.820 Foreign Born and Overweight/Obese 3.315 3.210 3.425
*Multivariable model adjusted for nativity, maternal age, education, BMI,
cigarette use during pregnancy, WIC services, month prenatal care began, and
number of prenatal visits
**Interaction term between nativity and BMI
The odds of GDM among CSA women were estimated for each study variable using an
adjusted multivariate logistic regression model (see Table 4.6). Maternal age, BMI, and nativity
had the highest odds ratios among all study variables for CSA women. Compared to women
40
women aged 35 years or older (OR = 4.27). Compared to CSA women born in the U.S. with an
underweight/normal BMI, the odds of GDM was higher for foreign-born women with
underweight/normal BMI (OR = 1.30), higher for U.S.-born women with overweight/obese BMI
(OR = 2.65), and highest for foreign-born women with overweight/obese BMI (OR = 2.88).
Study variables identified as having less strong associations with GDM included: education,
[image:41.612.80.526.290.634.2]cigarette use during pregnancy, month prenatal care began, and number of prenatal visits.
Table 4.6. Adjusted multivariate logistic regression model results exploring relationships between each study variable and GDM status among Central/South
American women.*
95% Confidence Interval
Variables Odds Ratio Lower Upper
Maternal age
Less than 25 Reference
25 to 34 2.357 2.183 2.545
35 or greater 4.274 3.943 4.633 Education
Greater than high school Reference
High school grad/GED 1.294 1.217 1.376 Less than high school 1.420 1.343 1.501 Cigarette use during pregnancy
No Reference
Yes 1.743 1.317 2.309
Month prenatal care began
1st trimester Reference
Later than 1st trimester 1.209 1.146 1.275 No prenatal care 0.759 0.583 0.989 Number of prenatal visits 1.073 1.067 1.079 Nativity_BMI**
U.S. Born and Under/Normal weight Reference
Foreign Born and Under/Normal weight 1.295 1.126 1.490 U.S. Born and Overweight/Obese 2.648 2.286 3.069 Foreign Born and Overweight/Obese 2.883 2.514 3.306 *Multivariate model adjusted for nativity, maternal age, education, BMI,
cigarette use during pregnancy, month prenatal care began, and number of prenatal visits.
41
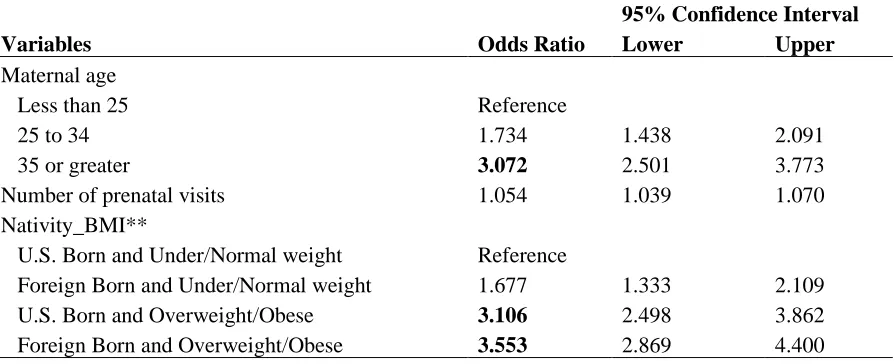
The odds of GDM among Cuban American women were estimated for each study
variable using an adjusted multivariate logistic regression model (see Table 4.7). Maternal age,
BMI, and nativity had the highest odds ratios among all study variables for Cuban American
women. Compared to women under the age of 25, the odds of GDM was higher among women
aged 25 to 34 and women aged 35 years or older (OR = 1.73 and 3.07, respectively). Compared
to Cuban American women born in the U.S. with an underweight/normal BMI, the odds of GDM
were higher for foreign-born women with underweight/normal BMI (OR = 1.68), higher for
U.S.-born women with overweight/obese BMI (OR = 3.11), and highest for foreign-born women
with overweight/obese BMI (OR = 3.55). Additionally, among Cuban American women, for
every one-unit increase in number of prenatal visits, the odds of GDM increased by 0.053 (OR =
[image:42.612.77.524.462.644.2]1.05).
Table 4.7. Adjusted multivariate logistic regression model results exploring relationships between each study variable and GDM status among Cuban
American women.*
95% Confidence Interval
Variables Odds Ratio Lower Upper
Maternal age
Less than 25 Reference
25 to 34 1.734 1.438 2.091
35 or greater 3.072 2.501 3.773 Number of prenatal visits 1.054 1.039 1.070 Nativity_BMI**
U.S. Born and Under/Normal weight Reference
Foreign Born and Under/Normal weight 1.677 1.333 2.109 U.S. Born and Overweight/Obese 3.106 2.498 3.862 Foreign Born and Overweight/Obese 3.553 2.869 4.400
*Multivariable models adjusted for nativity, maternal age, BMI,
and number of prenatal visits
42
The odds of GDM among Mexican American women were estimated for each study
variable using an adjusted multivariate logistic regression model (see table 4.8). Maternal age,
BMI, and nativity had the strongest associations with GDM. Compared to women under the age
of 25, the odds of GDM are higher for women aged 25 to 34 (OR = 2.18) and for women aged 35
years or older (OR = 4.10). Compared to Mexican American women born in the U.S. with an
underweight/normal BMI, the odds of GDM were higher for foreign-born women with
underweight/normal BMI (OR = 1.46), higher for U.S.-born women with overweight/obese BMI
(OR = 2.77), and highest for foreign-born women with overweight/obese BMI (OR = 3.33).
Study variables identified as having less strong associations with GDM included: education,
43
Table 4.8. Results of adjusted multivariate logistic regression model exploring relationships between each study variable and GDM status among Mexican
American women.*
95% Confidence Interval
Variables Odds Ratio Lower Upper
Maternal age
Less than 25 Reference
25 to 34 2.182 2.113 2.254
35 or greater 4.103 3.957 4.253 Education
Greater than high school Reference
High school grad/GED 1.137 1.106 1.170 Less than high school 1.259 1.221 1.297 Cigarette use during pregnancy
No Reference
Yes 1.208 1.097 1.330
Enrollment in WIC services
No Reference
Yes 1.085 1.059 1.111
Month prenatal care began
1st trimester Reference
Later than 1st trimester 1.166 1.135 1.199 No prenatal care 0.919 0.821 1.029 Number of prenatal visits 1.065 1.062 1.068 Nativity_BMI**
U.S. Born and Under/Normal weight Reference
Foreign Born and Under/Normal weight 1.463 1.389 1.540 U.S. Born and Overweight/Obese 2.772 2.654 2.896 Foreign Born and Overweight/Obese 3.261 3.117 3.413
*Multivariable models adjusted for nativity, maternal age, education, BMI,
cigarette use during pregnancy, WIC services, month prenatal care began, and
number of prenatal visits