Citation:
Denovan, A and Dagnall, N and Dhingra, K and Grogan, S (2017) Evaluating the Per-ceived Stress Scale among UK university students: Implications for stress measurement and management. Studies in Higher Education, 4 (1). pp. 120-133. ISSN 1470-174X DOI: https://doi.org/10.1080/03075079.2017.1340445
Link to Leeds Beckett Repository record: http://eprints.leedsbeckett.ac.uk/3839/
Document Version: Article
The aim of the Leeds Beckett Repository is to provide open access to our research, as required by funder policies and permitted by publishers and copyright law.
The Leeds Beckett repository holds a wide range of publications, each of which has been checked for copyright and the relevant embargo period has been applied by the Research Services team.
We operate on a standard take-down policy. If you are the author or publisher of an output and you would like it removed from the repository, please contact us and we will investigate on a case-by-case basis.
Evaluating the Perceived Stress Scale among UK university students:
implications for stress measurement and management
Andrew Denovana, Neil Dagnalla, Katie Dhingrab & Sarah Grogana
a Department of Psychology, Manchester Metropolitan University, Manchester, UK; b Department of Social Sciences, Leeds Beckett University, Leeds, UK
Version accepted for publication in Studies in Higher Education
ABSTRACT
University life can be stressful, and accurate measurement of perceived stress is important for research and practice. However, despite widespread use, disagreement persists regarding the latent structure of the Perceived Stress Scale (PSS), which poses serious consequences for how the measure should be administered. Furthermore, factorial invariance between genders has not been established with the 10-item PSS, though gender differences in perceived stress have been detected. This study examined the factor structure, composite reliability,
convergent validity, and gender invariance of the PSS-10 among 524 UK university students. Four distinct factor models (one-factor, correlated two-factor, correlated three-factor, and bifactor) were examined using confirmatory factor analysis. The totality of results supported a bifactor solution. Multi-group analysis established configural, metric, and scalar invariance of this model across gender. This study supports the use of total PSS-10 scores with UK university students and suggests the scale is not significantly affected by gender bias.
KEYWORDS: Confirmatory factor analysis; factorial invariance; Perceived Stress Scale;
Introduction
The Perceived Stress Scale (PSS; Cohen, Kamarck, and Mermelstein 1983) is a global stress measure that assesses the extent to which respondents perceive life to be unpredictable, uncontrollable, and overloading (Golden-Kreutz et al. 2004). The PSS contains general rather than event-specific items and is sensitive to background extraneous stressors and existing stressful circumstances. The original PSS contained 14 items. However, subsequent scrutiny produced a modified 10-item version (PSS-10), which possesses superior psychometric properties (internal consistency and factor structure) (Cohen and Williamson 1988)
(Appendix). Consequently, Cohen and Williamson (1988) recommended that researchers use the PSS-10 rather than the original version.
While the PSS-10 is a widely used, succinct measure of perceived stress, its factorial
structure is a source of contention. Particularly, debate centres on whether the PSS-10 is uni- or multidimensional. During initial development of the original measure, Cohen and
Williamson (1988) identified an item distinction related to statement directionality (negative vs. positive). Acknowledging this, the authors concluded that the PSS-10 assessed a single construct, explaining 41.6% of data variance. Other studies, however, argue that the distinction represents separate factors (negative items assess Perceived Helplessness, and positive, Perceived Self-Efficacy) (Barbosa-Leiker et al. 2013; GoldenKreutz et al. 2004; Roberti, Harrington, and Storch 2006).
Further work advances an alternative bifactor model (Jovanović and Gavrilov-Jerković 2015; Wu and Amtmann 2013). Bifactor modelling assessed whether the PSS-10 was sufficiently unidimensional to warrant the use of total scores, and examined the additional contribution of orthogonal factors to specific scale items (Reise, Morizot, and Hays 2007). The PSS-10 bifactor solution comprises an underlying general perceived stress factor with two domain specific factors (Factor 1, negatively and Factor 2, positively worded items). Wu and Amtmann (2013) found this solution produced superior fit to previously advanced one- and two-factor models.
the diverse range of samples included within psychometric validation studies. Illustratively, several student-based studies support the twofactor structure. Wongpakaran and
Wongpakaran (2010) tested 479 Thai medical students, Örücü and Demir (2009) assessed 508 Turkish undergraduates, and Roberti, Harrington, and Storch (2006) collected data from 285 American undergraduates. Contrastingly, support for the bifactor model originates from 446 participants with multiple sclerosis. Furthermore, Bradbury (2013), using a non-clinical Australian sample (N = 194), found superior fit for a correlated three-factor model
(comprising Distress, Coping, and Emotional Reactivity factors).
Another important issue concerns the extent to which emergent factorial solutions apply similarly to men and women; an issue that has received limited attention despite reports that women score significantly higher (Gitchel, Roessler, and Turner 2011; Martin, Kazarian, and Breiter 1995). Indeed, most models assume gender invariance. Studies examining factor scores have found that women score significantly higher on Distress, but not Coping (Gitchel, Roessler, and Turner 2011; Martin, Kazarian, and Breiter 1995). A potential explanation is that gender differences arise from measurement bias rather than true differences between men and women. Bias in measurement occurs when one gender is more likely to endorse
particular items, leading to artificial inflation of scores for specific items. Gitchel, Roessler, and Turner (2011) investigated this issue using 1310 individuals with multiple sclerosis and discovered that women typically endorsed items on the Distress factor. Lavoie and Douglas (2012), however, using the PSS, found support for configural, metric, and scalar invariance of Distress and Coping factors across gender (N = 1636). Results can be criticised for reliance on correlating errors (see Brown 2006).
Smith, Rosenberg, and Haight (2014) found gender invariance for the PSS-10 among 557 US undergraduates, but practiced factor cross-loading, which can pose problems for discriminant validity (Farrell 2010). Taylor (2015) examined gender invariance of the PSS-10 and
obtained mixed results, invariance in relation to factor loadings and intercepts for a correlated two-factor model was not established. Clearly, factorial analysis of the PSS-10 needs to consider gender invariance to elucidate the source of gender differences.
Issues arising from analytical and conceptual inconsistencies (i.e. structural ambiguity, sample heterogeneity, and gender invariance) potentially limit PSS-10 application,
requires an appreciation of its psychometric properties within specific groups. Correspondingly, the present study examined PSS-10 factorial structural and gender
invariance within a UK university sample. A similar approach generated normative English-sample data for the Short Form Perceived Stress Scale (PSS-4) (Warttig et al. 2013). This focus was required for several reasons. Explicitly, to date few studies have examined the applicability of the PSS-10 to UK students. Hence, the measure is frequently used, but its effectiveness (with this group) is not fully evaluated. Indeed, researchers in other countries have recently conducted similar country specific analyses (e.g. Denmark, Nielsen et al. 2016; and Germany, Klein et al. 2016).
The present study used UK university students because they are a significant, frequently studied group, who encounter myriad stressors (i.e. university transition, combining employment with study, self-funding of education, and academic demands) (Denovan and Macaskill 2016). Though university is largely a positive, challenging experience, evidence indicates that UK university students report higher levels of stress than general population averages (Turner et al. 2015). Research shows that the high stress levels among students are not restricted to the UK, with reported stress levels exceeding general population averages in Sweden (Vaez, Kristenson, and Laflamme 2004), Canada (Adlaf, Demers, and Gliksman 2005), the US (Blanco et al. 2008), and Australia (Stallman 2010). Key elements predicting stress are coping ability and the degree to which individuals view events as threatening (Lazarus and Folkman 1984).
Within the UK student group accurate measurement and conceptualisation of perceived stress is vital because high stress levels are associated with a range of negative outcomes, including depression (Zhang et al. 2015), suicidal ideation (Abdollahi et al. 2015), and lower subjective wellbeing (Denovan and Macaskill 2016). Problems appear particularly acute within students below the age of 26 because they are undertaking the transition to adulthood (Macaskill 2013). Thus, informed measurement of perceived stress is fundamental to facilitate
The PSS-10 was studied as a measure of student stress rather than other established student-stress scales, such as the Inventory of College Students’ Recent Life Experiences (ICSRLE; Kohn, Lafreniere, and Gurevich 1990), for various reasons. Specifically, the PSS-10 is simple to administer, easy to complete, and scale brevity facilitates the inclusion of additional
measures which might otherwise be excluded due to test battery length (Smith, Rosenberg, and Haight 2014); a concern with measures including the ICSRLE (a 49-item scale). Alongside pragmatic expedience, the PSS-10 is versatile and can be used in a number of important educational contexts, for instance, to evaluate progress during counselling and to measure student distress. Conceptually, researchers and practitioners value the PSS-10 because items are non-specific and context free, and it can be used across a range of settings. The present study
This study evaluated the psychometric properties of the PSS-10 with a UK university student sample. Comparison of factorial model fit indicated which solution was most applicable to the target sample. Measures of invariance investigated whether construct measurement varied as a function of gender (tests assessed configural, metric, and scalar invariance).
Additionally, composite reliability provided a robust examination of internal measurement integrity. Lastly, correlations between PSS-10 scores (total and subscale), and measures of student hassle exposure and affective well-being (positive and negative emotion) acted as validity measures. Given the perception of stress is related to both the frequency of hassle exposure (Kohn, Lafreniere, and Gurevich 1990) and affective well-being (Schiffrin and Nelson 2010), it was hypothesised that PSS-10 scores would correlate positively with greater hassles and lower well-being.
Method
Participants
range of 18–23, while the remainder (10%) were in the age range of 24–42. The mean age for women was 19.45, SD = 2.80; range of 18–42, and the mean age for men was 20.94, SD = 4.51; range of 18–41. The difference between mean ages in relation to gender was significant, t(522) = −4.67, p < .001. While at university, 204 (39%) lived at home, 320 (61%) lived in halls of residence or student houses/flats, and 236 (45%) worked in paid employment.
Measures
The PSS-10 (Cohen and Williamson 1988) measures important components of stress by assessing how uncontrollable, overloaded, and unpredictable individuals find their lives. The PSS-10 asks about thoughts and feelings over the last month using a response scale from 0 (never) to 4 (very often). Cohen and Williamson (1988) reported good internal reliability (α = 0.78) with two-day test– retest reliability of 0.85. In the current study α = 0.86 for the total scale, 0.84 for the Distress factor, and 0.76 for the Coping factor. An example Distress item is ‘how often have you felt nervous and “stressed”?’ (item 3), and an example Coping item is ‘how often have you felt that things were going your way?’ (item 5).
The ICSRLE (Kohn, Lafreniere, and Gurevich 1990) assesses university student stress as hassle exposure and contains seven subscales (developmental challenge, time pressure, academic alienation, romantic problems, assorted annoyances, general social mistreatment, and friendship problems). Respondents rate hassle exposure frequency over the past month from 1 (not at all part of my life) to 4 (very much part of my life). It has good internal reliability (α = 0.89) (Kohn, Lafreniere, and Gurevich 1990). In this study α = 0.88 for the total scale, 0.76 for developmental challenge, 0.76 for time pressure, 0.78 for academic alienation, 0.67 for romantic problems, 0.66 for assorted annoyances, 0.78 for social mistreatment, and 0.72 for friendship problems.
Procedure
University students were invited to participate via introductory classes across the Social Sciences Department in week one of the first semester, and were provided with
questionnaires to complete in situ. The beginning of the university year was focused on because this represents an important transitional point for all students. Students enrol and have induction, and they experience uncertainty about the year ahead in terms of timetable, workload and the nature of assessments (Struthers, Perry, and Menec 2000). Additionally, surveys/tests located at the beginning of the year are less likely to be influenced by proactive interference. In this context, previous stressors may cause rumination and worry, which produce residual stress. The beginning of the academic year is typically a point when student focus is forward (prospective) rather than retrospective and reactive (Roediger, Putnam, and Smith 2011). The University Research Ethics Committee approved the study. Participants were informed of the study’s purpose, assured of confidentiality, and were debriefed after taking part.
Analysis
Four competing models of the latent factor structure of the PSS-10, based on previous research, were assessed using CFA. Model 1 is a one-factor solution where the 10 items of the PSS-10 load onto a single latent variable of perceived stress. Model 2 is a correlated two-factor model where the two latent variables are represented by Distress (items 1, 2, 3, 6, 9, 10) and Coping (items 4, 5, 7, 8). Model 3 is a correlated three-factor model where the three latent variables are represented by Distress (items 6, 10, 2, 8), Coping (items 5, 4, 7), and Emotional Reactivity (items 1, 3, 9). Model 4 is a bifactor model consisting of three latent factors: a general perceived stress factor (PS Total), Distress, and Coping. Items were constrained to load onto a single factor within models 1 to 3. Within model 4, all items loaded onto PS Total, items 1, 2, 3, 6, 9, 10 loaded onto Distress, and items 4, 5, 7, 8 loaded onto Coping. The labelling of factors as Distress, Coping, and Emotional Reactivity is consistent with previous research (e.g. Bradbury 2013). The superior factor solution was assessed for measurement invariance across gender using multi-group CFA.
considered. The Comparative Fit Index (CFI; Cronbach 1990) and the Tucker–Lewis Index (TLI; Tucker and Lewis 1973) evaluate the extent to which a model fits the data better than a baseline model where the variables are uncorrelated. Values above 0.95 suggest good fit, and values of 0.90 and greater suggest adequate fit (Hu and Bentler 1999). The standardised root-mean-square residual (SRMR; Jöreskog and Sörbom 1981) and the root-root-mean-square error of approximation (RMSEA; Steiger 1990) were also considered, with values less than 0.05 suggesting good fit, and values less than 0.08 suggesting reasonable fit (Hu and Bentler 1999). The 90% confidence interval (CI) was included when reporting RMSEA. Modification indices (MI) were examined to identify parameter misfit. This index reflects the degree to which the model chi-square would decrease if a constrained parameter was freely estimated. Within-item error correlations possessing MI > 20 were examined (ten Klooster et al. 2008). Akaike’s information criterion (AIC; Akaike 1974) was used for model comparison, with smaller values signifying better fitting models.
Through multi-group CFA, three models were tested in relation to the superior factor solution: configural invariance, weak factorial invariance (metric invariance), and strong factorial invariance (scalar invariance). Byrne (2010) emphasises that testing for strict factorial invariance is unnecessary as this is rarely achievable. Testing for configural invariance focuses on the extent to which the same number of factors represents the data of both groups (Byrne 2010). In testing for metric invariance, all factor loadings were
constrained to be equal between the two groups (Hair et al. 1998). Scalar invariance was tested by constraining the intercepts of the 10 items of the PSS-10 to be the same between the two groups. The CFI and chi-square differences between the models were considered. The CFI difference should not exceed 0.02 (Cheung and Rensvold 2002), and chi-square should not significantly differ between models. Satisfaction of these criteria indicates that the PSS-10 is not biased in relation to its factor structure, factor loadings, or intercepts (Milfont and Fischer 2010).
Results
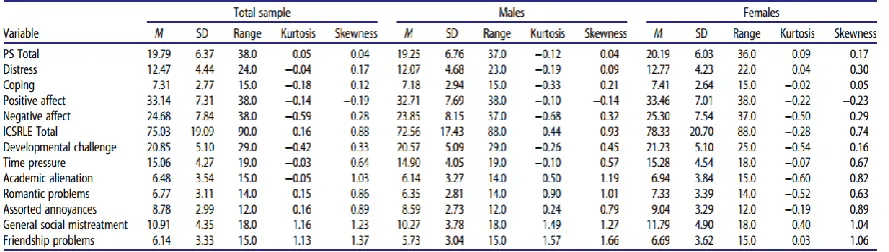
The mean 10 score for the sample was 19.79 (SD = 6.37). No gender difference in PSS-10 total score was found, t(522) = 1.66, p = .09, indicating that women (M = 20.19, SD = 6.03) reported similar levels of perceived stress to men (M = 19.25, SD = 6.76). Participants reported slightly higher positive mood (M = 33.14, SD = 7.31) than negative mood (M = 24.68, SD = 7.84). The mean ICSRLE Total score was 75.03 (SD = 19.09). All skewness and kurtosis values were in the recommended interval between −2 and +2 (Byrne 2010) (see Table 1).
Confirmatory factor analysis
[image:11.595.74.519.241.367.2]The correlated three-factor model suggested a reasonable fit to the data on all indices but RMSEA and TLI: χ2 (32, N = 524) = 200.50, p < .001, CFI = 0.91, TLI = 0.87, SRMR = 0.06, RMSEA = 0.10 (CI of 0.09– 0.11). MI values reported high error covariance for items across factors (items 1 and 2, 7 and 8). These error terms were not allowed to correlate given cross-factor error correlations are discouraged (Byrne 2010). The bifactor model
demonstrated superior fit in comparison with the one-factor, two-factor, and three-factor models: χ2 (25, N = 524) = 45.72, p = .007, CFI = 0.99, TLI = 0.98, SRMR = 0.02, RMSEA = 0.04 (CI of 0.02–0.06). The AIC statistics further confirm the superior fit of the bifactor model, as the AIC is 125.72, which is lower than the factor (AIC = 339.97), the one-factor with correlated errors (AIC = 174.71), the two-one-factor (AIC = 170.21), the two-one-factor with correlated errors (AIC = 129.95), and the three-factor model (AIC = 266.50) (Table 2).
The suitability of the bifactor model can furthermore be determined by its parameter
estimates. All factor loadings for PS Total were positive and statistically significant, and the majority exceeded .4, with the exception being items 7 and 4 (loadings of .39 and .37, respectively) (see Figure 1). Further scrutiny of the loadings for the two subscale factors offers critical information in relation to the appropriateness of incorporating these subscales when scoring the PSS-10. In situations when items load highly onto a general factor, but simultaneously load to a lesser degree onto subscale factors, this indicates that a
negatively (items 6 and 10) which can be a result of the cross-over suppression effect
(Paulhus et al. 2004). These results support the superiority of a single latent factor underlying the PSS-10, and to a lesser extent support the presence of two separate subscales.
Multi-group analysis (gender)
Factorial invariance tests were performed by fitting the superior model (the bifactor solution) to the data for men (n = 224) and women (n = 300). The bifactor model was used as a
baseline for examining a hierarchy of progressively restrictive models (Bollen 1989), beginning with configural invariance, metric invariance, and scalar invariance. Results supported invariance of form (configural invariance) for the bifactor model, indicating good model fit: χ2 (52, N = 524) = 63.32, p = .14, CFI = 0.99, TLI = 0.99, SRMR = 0.03, RMSEA = 0.02 (90% CI of 0.01–0.04).
0.99, metric CFI = 0.99), supporting the conclusion of invariance at configural and metric stages.
The scalar invariance model reported a good fit to the data: χ2 (77, N = 524) = 84.97, p = .25, CFI = 0.99, TLI = 0.99, SRMR = 0.03, RMSEA = 0.02 (CI of 0.01–0.03). A χ2 significance test comparing the scalar model with the metric model supported the presence of strong factorial invariance: χ2 (10, N = 524) = 9.68, p = .46. Comparison of CFI values reported a difference less than 0.02, confirming strong factorial invariance (metric CFI = 0.99, scalar CFI = 0.99). These findings suggest that the PSS-10 is factorially invariant between men and women in relation to the bifactor solution.
Reliability analysis
Internal consistency tests including Cronbach’s alpha often under- or overestimate scale reliability within a latent modelling context, and composite reliability offers a more rigorous assessment of internal consistency (Raykov 1998). The composite reliability of the bifactor scales were investigated with values greater than 0.60 considered acceptable
(Diamantopoulos and Siguaw 2000). Results indicate that the PS Total factor and Coping factor possess satisfactory internal consistency (ρc = 0.88 and ρc = 0.70, respectively). In contrast, composite reliability for the Distress factor was lower (ρc = 0.10).
Convergent validity
To assess convergent validity of the bifactor scales, correlations were computed between PS Total, Distress, and Coping with PANAS subscales (PA; NA) and the ICSRLE (including subscales of developmental challenge, time pressure, academic alienation, romantic
Discussion
This study investigated the latent structure, factorial invariance, internal consistency, and convergent validity of the PSS-10 among a large sample of UK university students.
Participants had relatively high levels of perceived stress (M = 19.79, SD = 6.37) compared with previously established norms with a general population sample aged 18–29 years (M = 14.2, SD = 6.2; Cohen 1994). Based on the fit indices from CFA, the bifactor model,
consisting of PS Total, Distress, and Coping was a closer fit to the data than one-factor, two-factor, and three-factor alternatives. Additionally, greater item loadings were evident for PS Total than Distress and, to an extent, Coping. Such findings suggest that although individual stress and coping factors exist, the PSS-10 is driven by a single underlying dimension of perceived stress. These results are consistent with Wu and Amtmann (2013) and indicate that total scores are usable when assessing UK university students as the PSS-10 is sufficiently unidimensional. This is a significant outcome and provides evidence for the
unidimensionality assumption of the PSS-10, supporting Cohen and Williamson’s (1988) original conclusion as to how the measure should be conceptualised. Furthermore, support for the unidimensionality assumption of the PSS- 10 has recently been established with student samples using alternative psychometric methods. Specifically, Medvedev et al. (2017) used Rasch analysis and confirmed that the PSS-10 possesses an underlying latent factor of perceived stress.
two-factor solution provided a good fit to the data, but none of the fit indices showed an improvement over those observed for the bifactor model. These results conflict with the assertion of Martin, Kazarian, and Breiter (1995) that the PSS measures two facets of stress that are substantially distinct. Furthermore, in contrast with Bradbury (2013), a comparison of three-factor and two-factor models resulted in a superior fit for twofactor conceptualisations of perceived stress. An outcome that needs to be acknowledged, however, is the observation that items maintained relatively high factor loadings on Coping in the bifactor solution. It is unclear why this occurred, but Perera et al. (2016) recently found that the four
positivelystated items which make up Coping can act as a nuisance variable that introduce unwanted variation when scoring the PSS, which may explain the high loadings in this study. Perera et al. (2016) suggest that to obtain total scores and scores based on the positively stated items may help to control for this potential variance when administering the PSS. From factorial invariance testing, configural, metric, and scalar invariance across gender were found in the present study for a bifactor solution, which is new in the literature. This suggests that PSS-10 scores may not be majorly influenced by a bias in how men and women treat the items. Concern regarding potential gender bias resulted from past research reporting that women had a higher probability of endorsing the Distress factor items relative to men (Gitchel, Roessler, and Turner 2011). Yet, similar to this study, Lavoie and Douglas (2012) found no evidence of a gender bias. This disparity among studies may exist because different procedures of assessing measurement bias (e.g. item-response techniques) can produce contrasting results (Millsap 2006). The finding that the structure and factor loadings of the PSS-10 did not vary between men and women has important implications for interpreting mean differences in relation to gender.
Determining the most suitable latent structure of a measure is an important precondition to evaluating its reliability, as to treat a unidimensional scale as multidimensional can lead to inaccurate reliability assessment (Shevlin et al. 2000). Accordingly, following testing for internal consistency using Cronbach’s alpha, the composite reliability of the factors of the best fitting model were assessed to robustly evaluate internal consistency. Composite reliability was satisfactory for PS Total and Coping, but not for Distress. These findings reinforce the notion of a general PS factor in the conceptualisation of the PSS-10.
Further analysis supported the validity of the scale for assessing university student stress, as PS Total, Distress, and Coping significantly correlated with affective well-being. PS Total significantly correlated with total university-based hassles, and PS Total and Distress were associated with developmental challenge and time pressure. Coping, however, only correlated with friendship problems. It is not immediately apparent why low correlations between the PSS-10 and ICSRLE emerged. A possible reason is that the ICSRLE contains study-related stress items specific to a North American population, and perhaps these items did not transfer adequately to a UK student sample. Indeed, Bodenhorn et al. (2007) report that research using the ICSRLE has been largely confined to North American students, and UK-based studies using the ICSRLE tend to use adapted versions of the measure, which was not practiced in this study. Future research may want to consider stress measures that are not confounded by such issues when assessing PSS-10 convergent validity with UK students, such as the Stress subscale of the Depression Anxiety Stress Scale (Lovibond and Lovibond 1995).
Implications and limitations
student’s life situations and their ability to cope. Lowered stress scores throughout treatment can indicate a positive treatment response, and the measure can be used as a parsimonious means of assessing how students are negotiating difficult situations in response to stress management techniques (Roberti, Harrington, and Storch 2006).
Findings should be interpreted in light of several limitations. First, the student sample was relatively homogeneous, limiting the generalisability of the results to samples of varying ages and backgrounds. Replication with more heterogeneous samples is needed. Particularly, the age range was quite restrictive, with only 10% of the sample belonging to the age category of 24–42. Although the age range is consistent with related research (e.g. Smith, Rosenberg, and Haight 2014), future work would benefit from considering more mature students to further evaluate the PSS-10. Additionally, the focus on social science students does not represent the range of subjects at the entire university. Given much research focusing on student stress utilises social science (and specifically psychology) students, this may not represent a serious limitation. Second, the use of self-report data introduces several well-known limitations, such as response bias and shared method variance. Future research would benefit from including additional measures when assessing perceived stress, such as interviews and physiological assessment. Finally, this study did not assess test–retest reliability of the PSS-10. Previous research has, however, established temporal reliability in a variety of populations (see Reis, Hino, and Añez 2010).
Conclusion
Despite the limitations, this study contributes to research literature surrounding the PSS in several ways. Firstly, support for a bifactor model in a large sample of UK university students indicates that, in agreement with Wu and Amtmann (2013), the PSS is best conceptualised as being driven by a single underlying dimension of perceived stress, suggesting that total PSS-10 scores are appropriate to use for assessing UK university student stress. Convergent validity of the PSS-10 implies that this scale accurately surveyed perceived stress among the student sample. Results also indicate that the underlying constructs are interpreted and measured the same way across gender, with configural, metric, and scalar invariance
indications of factorial invariance of a bifactor solution across gender, and presented robust evidence of the reliability of such a conceptualisation. Considering the findings in
conjunction with those of Wu and Amtmann (2013), Taylor (2015), and Lavoie and Douglas (2012) from other samples provides strong evidence for the appropriateness of a bifactor model and gender invariance in relation to the PSS-10.
References
Abdollahi, A., M. Abu Talib, S. N. Yaacob, and Z. Ismail. 2015. “The Role of Hardiness in Decreasing Stress and Suicidal Ideation in a Sample of Undergraduate Students.” Journal of Humanistic Psychology 55 (2): 202–22. doi:10.1177/ 0022167814543952. Adlaf, E. M., A. Demers, and L. Gliksman. 2005. Canadian Campus Survey 2004. Toronto:
Centrefor Addiction and Mental Health. Akaike, H. 1974. “A New Look at the Statistical Model Identification.” IEEE Transactions on Automatic Control 19 (6): 716–23. doi:10.1109/TAC.1974.1100705.
Barbosa-Leiker, C., M. Kostick, Ming Lei, S. McPherson, V. Roper, T. Hoekstra, and B. Wright. 2013. “Measurement Invariance of the Perceived Stress Scale and Latent Mean Differences Across Gender and Time.” Stress and Health 29 (2): 253–60. doi:10.1002/smi.2463.
Blanco, C., M. Okuda, C. Wright, D. S. Hasin, B. F. Grant, S. Liu, and M. Olfson. 2008. “Mental Health of College Students and Their Non-college Attending Peers.”
Archives of General Psychiatry 65 (12): 1429–37. doi:10.1001/archpsyc.65.12.1429. Bodenhorn, N., Y. Miyazaki, K. Ng, and C. Zalaquett. 2007. “Analysis of the Inventory of
College Students’ Recent Life Experiences.” Multicultural Learning and Teaching 2 (2): 65–77.
Bollen, K. A. 1989. Structural Equations with Latent Variables. New York: Wiley. Bradbury, J. 2013. “Modelling Stress Constructs with Biomarkers: The Importance of the
Measurement Model.” Clinical and Experimental Medical Sciences 1 (5–8): 197–216. doi:10.12988/cems.2013.13017.
Byrne, B. M. 2010. Structural Equation Modeling with Amos: Basic Concepts, Applications, and Programming. 2nd ed. New York: Taylor and Francis.
Cheung, G. W., and R. B. Rensvold. 2002. “Evaluating Goodness-of-Fit Indexes for Testing Measurement Invariance.” Structural Equation Modeling: A Multidisciplinary Journal 9 (2): 233–55. doi:10.1207/S15328007SEM0902_5.
Cohen, S. 1994. Perceived Stress Scale. Palo Alto, CA: Mind Garden. Cohen, S., T. Kamarck, and R. Mermelstein. 1983. “A Global Measure of Perceived Stress.” Journal of Health and Social Behavior 24 (4): 385–96. doi:10.2307/2136404. Cohen, S., and G. Williamson. 1988. “Perceived Stress in a Probability Sample of the U.S.”
In The Social Psychology of Health, edited by S. Spacapan and S. Oskamp, 31–67. Thousand Oaks, CA: Sage.
Cronbach, L. J. 1990. Essentials of Psychological Testing. 5th ed. New York: Harper and Row. Denovan, A., and A. Macaskill. 2016. “Stress and Subjective Well-being among First Year UK Undergraduate Students.” Journal of Happiness Studies. Advance online publication. doi:10.1007/s10902-016-9736-y.
Diamantopoulos, A., and J. A. Siguaw. 2000. Introducing LISREL. London: Sage. Farrell, A. M. 2010. “Insufficient Discriminant Validity: A Comment on Bove, Pervan, Beatty, and Shiu 2009.” Journal of Business Research 63 (3): 324–27.
doi:10.1016/j.jbusres.2009.05.003.
Gitchel, W. D., R. T. Roessler, and R. C. Turner. 2011. “Gender Effect According to Item Directionality on the Perceived Stress Scale for Adults with Multiple Sclerosis.” Rehabilitation Counselling Bulletin 55 (1): 20–28. doi:10.1177/ 0034355211404567. Golden-Kreutz, D. M., M. W. Browne, G. M. Frierson, and B. L. Anderson. 2004. “Assessing
Stress in Cancer Patients: A Second-order Factor Analysis Model for the Perceived Stress Scale.” Assessment 11 (3): 216–23. doi:10.1177/ 1073191104267398.
Hair, J. F., R. E. Anderson, R. L. Tatham, and W. C. Black. 1998. Multivariate Data Analysis. 5th ed. Upper Saddle River, NJ: Prentice Hall.
Modeling: A Multidisciplinary Journal 6 (1): 1–55. doi:10.1080/ 10705519909540118.
Jöreskog, K., and D. Sörbom. 1981. LISREL V: Analysis of Linear Structural Relationships by the Method of Maximum Likelihood. Chicago, IL: National Educational
Resources.
Jovanović, V., and V. Gavrilov-Jerković. 2015. “More than a (Negative) Feeling: Validity of the Perceived Stress Scale in Serbian Clinical and Non-clinical Samples.” Psihologija 48 (1): 5–18. doi:10.2298/PSI1501005J.
Klein, E. M., E. Brähler, M. Dreier, L. Reinecke, K. W. Müller, G. Schmutzer, K. Wölfling, and M. E. Beutel. 2016. “The German Version of the Perceived Stress Scale:
Psychometric Characteristics in a Representative German Community Sample.” BMC Psychiatry 16: 167. doi:10.1186/s12888-016-0875-9.
Kohn, P. M., K. Lafreniere, and M. Gurevich. 1990. “The Inventory of College Student’s Recent Life Experiences: A Decontaminated Hassles Scale for A Special Population.” Journal of Behavioural Medicine 13 (6): 619–30. doi:10. 1007/BF00844738.
Lavoie, J. A. A., and K. S. Douglas. 2012. “The Perceived Stress Scale: Evaluating
Configural, Metric and Scalar Invariance Across Mental Health Status and Gender.” Journal of Psychopathology and Behavioral Assessment 34 (1): 48–57. doi:10. 1007/s10862-011-9266-1.
Lazarus, R. S., and S. Folkman. 1984. Stress, Appraisal, and Coping. New York: Springer. Lovibond, P. F., and S. H. Lovibond. 1995. The Structure of Negative Emotional States:
Comparison of the Depression Anxiety Stress Scales (DASS) with the Beck
Depression and Anxiety Inventories.” Behaviour Research and Therapy 33 (3): 335– 43. doi:10.1016/0005-7967(94)00075-U.
Macaskill, A. 2013. “The Mental Health of University Students in the United Kingdom.” British Journal of Guidance & Counselling 41 (4): 426–41.
doi:10.1080/03069885.2012.743110. Martin, R. A., S. S.
Medvedev, O. N., C. U. Krägeloh, E. M. Hill, R. Billington, R. J. Siegert, C. S. Webster, R. J. Booth, and M. A. Henning. 2017. “Rasch Analysis of the Perceived Stress Scale: Transformation from an Ordinal to a Linear Measure.” Journal of Health Psychology. Advance online publication. doi:10.1177/1359105316689603.
Milfont, T. L., and R. Fischer. 2010. “Testing Measurement Invariance Across Groups: Applications in Cross-cultural Research.” International Journal of Psychological Research 3 (1): 111–21. doi:10.21500/20112084.857.
Millsap, R. E. 2006. “Comments on Methods for the Investigation of Measurement Bias in the Mini-mental State Examination.” Medical Care 44 (11): S171–75.
doi:10.1097/01.mlr.0000245441.76388.ff.
Nielsen, M. G., E. Ørnbøl, M. Vestergaard, P. Bech, F. B. Larsen, M. Lasgaard, and K. S. Christensen. 2016.“The Construct Validity of the Perceived Stress Scale.” Journal of Psychosomatic Research 84: 22–30. doi:10.1016/j.jpsychores.2016.03.009.
Örücü, Ç. M., and A. Demir. 2009. “Psychometric Evaluation of Perceived Stress Scale for Turkish University Students.” Stress and Health 25 (1): 103–9.
doi:10.1002/smi.1218.
Paulhus, D. L., R. W. Robins, K. H. Trzesniewski, and J. L. Tracy. 2004. “Two Replicable Suppressor Situations in Personality Research.” Multivariate Behavioral Research 39 (2): 303–28. doi:10.1207/s15327906mbr3902_7.
Perera, M. J., C. E. Brintz, O. Birnbaum-Weitzman, F. J. Penedo, L. C. Gallo, P. Gonzalez, N. Gouskova, et al. 2016. “Factor Structure of the Perceived Stress Scale-10 (PSS) Across English and Spanish Language Responders in the HCHS/ SOL Sociocultural Ancillary Study.” Psychological Assessment. Advance online publication.
doi:10.1037/pas0000336.
Raykov, T. 1998. “Coefficient Alpha and Composite Reliability with Interrelated Nonhomogeneous Items.” Applied Psychological Measurement 22 (4): 375–85. doi:10.1177/014662169802200407.
Reis, R. S., A. A. Hino, and C. R. Añez. 2010. “Perceived Stress Scale: Reliability and Validity Study in Brazil.” Journal of Health Psychology 15 (1): 107–14.
Reise, S. P., T. M. Moore, and M. G. Haviland. 2010. “Bifactor Models and Rotations: Exploring the Extent to Which Multidimensional Data Yield Univocal Scale Scores.” Journal of Personality Assessment 92 (6): 544–59. doi:10.1080/
00223891.2010.496477.
Reise, S. P., J. Morizot, and R. D. Hays. 2007. “The Role of the Bifactor Model in Resolving Dimensionality Issues in Health Outcomes Measures.” Quality of Life Research 16 (1): 19–31. doi:10.1007/s11136-007-9183-7.
Roberti, J. W., L. N. Harrington, and E. Storch. 2006. “Further Psychometric Support for the 10-item Version of the Perceived Stress Scale.” Journal of College Counseling 9 (2): 135–47. doi:10.1002/j.2161-1882.2006.tb00100.x.
Roediger, H. L., A. L. Putnam, and M. A. Smith. 2011.“Ten Benefits of Testing and Their Applications to Educational Practice.” In The Psychology of Learning and
Motivation, edited by J. Mestre and B. Ross, 1–37. Amsterdam: Academic Press. Schiffrin, H. H., and S. K. Nelson. 2010. “Stressed and Happy? Investigating the
Relationship Between Happiness and Perceived Stress.” Journal of Happiness Studies 11 (1): 33–39. doi:10.1007/s10902-008-9104-7.
Shevlin, M. E., J. N. V. Miles, M. N. O. Davies, and S. Walker. 2000. “Coefficient Alpha: A Useful Indicator of Reliability?” Personality and Individual Differences 28 (2): 229– 37. doi:10.1016/S0191-8869(99)00093-8.
Smith, K. J., D. L. Rosenberg, and G. T. Haight. 2014. “An Assessment of the Psychometric Properties of the Perceived Stress Scale-10 (PSS10) with Business and Accounting Students.” Accounting Perspectives 13 (1): 29–59. doi:10.1111/1911- 3838.12023. Stallman, H. M. 2010. “Psychological Distress in University Students: A Comparison with
General Population Data.” Australian Psychologist 45 (4): 249–57. doi:10.1080/00050067.2010.482109.
Steiger, J. H. 1990. “Structural Model Evaluation and Modification: An Interval Estimation Approach.” Multivariate Behavioural Research 25 (2): 173–80.
Struthers, C. W., R. P. Perry, and V. H. Menec. 2000. “An Examination of the Relationship among Academic Stress, Coping, Motivation, and Performance in College.” Research in Higher Education 41 (5): 581–92. doi:10.1023/A:1007094931292.
Taylor, J. M. 2015. “Psychometric Analysis of the Ten-item Perceived Stress Scale.” Psychological Assessment 27 (1): 90–101. doi:10.1037/a0038100.
ten Klooster, P. M., M. M. Veehof, E. Taal, P. L. van Riel, and M. A. van de Laar. 2008. “Confirmatory Factor Analysis of the Arthritis Impact Measurement Scales 2 Short Form in Patients with Rheumatoid Arthritis.” Arthritis Care & Research 59 (5): 692– 98. doi:10.1002/art.23569
Tucker, L. R., and C. Lewis. 1973. “The Reliability Coefficient for Maximum Likelihood Factor Analysis.” Psychometrika 38: 1– 10. doi:10.1007/BF02291170.
Turner, J., D. Bartlett, M. Andiappan, and L. Cabot. 2015. “Students’ Perceived Stress and Perception of Barriers to Effective Study: Impact on Academic Performance in
Examinations.” British Dental Journal 219 (9): 453–58. doi:10.1038/sj.bdj. 2015.850. Vaez, M., M. Kristenson, and L. Laflamme. 2004. “Perceived Quality of Life and Self-rated
Health among First-year University Students. A Comparison with Their Same Age Working Peers.” Social Indicators Research 68 (2): 221–34.
doi:10.1023/B:SOCI.0000025594.76886.56.
Warttig, S. L., M. J. Forshaw, J. South, and A. K. White. 2013. “New, Normative, English-sample Data for the Short Form Perceived Stress Scale (PSS-4).” Journal of Health Psychology 18 (12): 1617–28. doi:10.1177/1359105313508346.
Watson, D., L. A. Clark, and A. Tellegen. 1988. “Development and Validation of Brief Measures of Positive and Negative Affect: The PANAS Scales.” Journal of Personality and Social Psychology 54 (6): 1063–70. doi:10.1037/0022-3514.54.6.1063.
Wongpakaran, N., and T. Wongpakaran. 2010. “The Thai Version of the PSS-10: An Investigation of its Psychometric Properties.” BioPsychoSocial Medicine 4 (6): 1–6. doi:10.1186/1751-0759-4-6.
Zhang, B., X. Yan, F. Zhao, and F. Yuan. 2015. “The Relationship Between Perceived Stress and Adolescent Depression: The Roles of Social Support and Gender.” Social