Jarzabkowski, P and Giulietti, M and Amoo, NA and Oliveira, B (2010) The Use and Value of Strategy Tools in the Different Stages of the Strategy Process. In: The Strategic Management Society (SMS) Special Conference on the Intersections of Strategy Processes and Strategy Practices, 17 March 2010 - 20 March 2010, Finland.
Link to Leeds Beckett Repository record: http://eprints.leedsbeckett.ac.uk/5797/
Document Version:
Conference or Workshop Item
The aim of the Leeds Beckett Repository is to provide open access to our research, as required by funder policies and permitted by publishers and copyright law.
The Leeds Beckett repository holds a wide range of publications, each of which has been checked for copyright and the relevant embargo period has been applied by the Research Services team.
We operate on a standard take-down policy. If you are the author or publisher of an output and you would like it removed from the repository, please contact us and we will investigate on a case-by-case basis.
Stages of the Strategy Process
Paula Jarzbkowski
1, Monica Giulietti
2, Nii Amoo
3and Bruno Oliveira
41
Aston Business School, Aston University, Birmingham B4 7ET, UK,
[email protected], Tel: +44 (0) 121 204 3139
2
Nottingham University Business School, Nottingham NG8 1BB, UK,
[email protected], Tel: +44 (0) 115 8468484
3
Aston Business School, Aston University, Birmingham B4 7ET, UK, [email protected], Tel:
+44 (0) 121 204 3322
4
Aston Business School, Aston University, Birmingham B4 7ET, UK, [email protected], Tel:
+44 (0) 121 236 2589
Abstract
Introduction
Strategy tools such as scenario planning and Porter’s Five Forces have been developed in order to support the strategy work of practitioners and organizations. Indeed, managers invest considerable resources in terms of time, money and intellectual capital, in acquiring and using these kinds of tools (Rigby, 2001; Rigby & Gillies, 2000), both for strategic decision making (Clark & Scott, 1999) and strategic planning activities (Grant, 2003). However, little research has been concerned with the practicalities of using strategy tools. In fact, extant research on strategy tools has typically been grounded in instrumental principles about the way tools should be used (e.g. March, 2006), rather than examining their actual use in practice (Jarzabkowski & Spee, 2009). We therefore need further research to explain how strategy tools are incorporated in the practical, everyday strategy work of organizations (Jarzabkowski & Wilson, 2006; Whittington, 2003; Whittington, 2006).
This paper addresses this gap through a large scale survey of where in the strategy process managers use different strategy tools and what value they accord to that use in different phases. When strategy tools are taught in strategy courses, they are typically presented as more useful for specific phases of the strategy process, such as analysis, choice-making, or implementation. A comparison of both actual use in different phases, and the value attributed to use is important for understanding whether managers are instrumental in using the tools they consider more valuable in any particular phase, or if use and value are not correlated, indicating other, less-instrumental reasons for use. The paper draws upon an empirical database of 1407 usable responses, to show that 1) managers use tools across strategy phases, regardless of their perceived application to a particular phase of the strategy process; and 2) even where tools are highly used in a particular phase, they may not be highly valued; and 3) that there is a sliding scale of both use and value from strategy analysis, to strategy choice to strategy implementation. The paper thus provides insights on the actual use of strategy tools that is counterintuitive to the strategy process literature and the way that such tools are taught.
Theoretical Background
Strategy process research is concerned with the direction of organizations (Rumelt et al., 1994; Tsoukas & Knudsen, 2002; Whittington et al., 2003) and with how they make choices and commitments (Markides, 1999; Porter, 1996; Tsoukas et al., 2002). An inclusive definition suggests that the strategy process is “the pattern of decisions in a company that determines and reveals its objectives, purposes, or goals, produces the principal policies and plans for achieving these goals, and the range of business the company is to pursue, the kind of economic and human organization it intends to be, and the nature of the economic and noneconomic contribution it intends to make to its shareholders, employees, customers and communities” (Andrews, 1971: 18). This very inclusive definition highlights the different activities implied in strategic management. In fact, since its very beginnings diverse strategy researchers and theorist have sought to develop frameworks that illustrate the nature of the strategy process (e.g. Ackoff, 1970; Andrews, 1971; Ansoff, 1965; Dyson & O'brien, 1998). Notwithstanding, there is no agreement in the literature about the stages of the strategy process. While some authors consider that it is possible to distinguish conceptually between stages in the strategy process (e.g. Ansoff, 1965; Ansoff, 1991), others consider that any identification of stages in strategy is artificial and therefore irrelevant (e.g. Mintzberg, 1990).
Hopkins & Hopkins (1997) argue many strategic planning scholars agree that strategic planning consists of three major stages: formulation, implementation and control. Other authors label these stages as formulation, choice and implementation (e.g. Boyd & Reuning-Elliott, 1998). In contrast, there are authors who explicitly or implicitly identify only two strategy stages: formulation and implementation (e.g. Ackoff, 1970; Brews & Hunt, 1999; Hutzschenreuter & Kleindienst, 2006; Learned et al., 1965) or formulation and choice (e.g. Ansoff, 1965).
different stages of the strategy process. This expectation is based on the fact that strategy tools are not designed to answer every possible problem but normally to address specific issues (Grant, 2008).
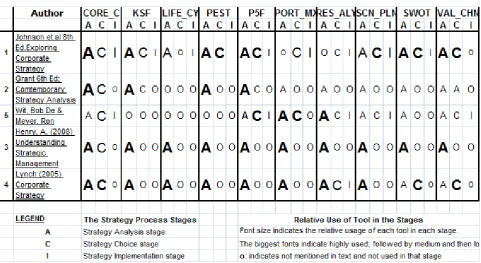
[image:4.595.53.535.248.511.2]We reviewed the five top strategy texts in sales volume as identified by Nielsen BookData, in order to identify in what stage of the strategy process, different strategy tools are typically taught and, hence, expected to be used. Table 1 provides a summary of the different strategy texts reviewed and the stages in which those ten tools that we identified as most frequently used in our survey, were expected to be used according to each text. As Table 1 shows, at least in terms of the way they are taught in leading texts, the majority of the strategy tools analysed in our research are expected to be more used in strategy analysis than strategy choice or implementation (e.g. Resource-analysis, PESTLE, Portfolio Matrix). Nevertheless, some tools are also expected to be used for strategy choice (e.g. Porter Five Forces, Core Competences, Value Chain). Interestingly there is almost no tool which is expected to be used in the strategy implementation stage.
Table 1: Expected Use of Strategy Tools Based on Strategy Texts
If an instrumental view of strategy tools holds then one would expect that, for those managers who have been taught strategic management, the actual use of strategy tools will be aligned with the expected use outlined in strategy texts. Furthermore, an instrumental view would predict that specific strategy tools are used because they add value to specific strategy activities. This specificity of tools to a particular phase of the strategy process should influence their adoption by users. In order to examine whether this instrumental view resembles what really happens in strategy practice this paper addresses the following research questions: a) are particular strategy tools used for specific activities during the strategy process; and b) to what extent does the added value feature of the tools explain patterns of strategy tool adoption? In order to answer these questions, we examined these features in relation to where in the strategy process managers use particular strategy tools and the value that they attribute to those tools in the different strategy stages.
Research Method
Sample and Data Collection
and ultimately the reliability and validity of the research, we took a number of informant competency steps that have been used in previous research (e.g. Katsikeas et al., 2006; Tanriverdi & Venkatraman, 2005), in order to ensure informant quality and response validity. First, we focused on higher-ranked schools because these schools have higher graduate employment, ensuring that respondents are employed in positions where they might reasonably have an opportunity or need to use strategy tools. Second, top business schools in the UK attract a diversified alumni population which gives us a cross-cultural base for our research. Third, we surveyed respondents’ who have had varying and considerable years of job experience, ensuring that they had wide opportunities to use tools in their work activities. Finally, in order to establish a list of tools most typically taught in foundation strategic management courses, a survey of 66 strategy academics in the top 30 business schools was conducted. We found that 11 tools were typically taught by more than 75% of respondents, another 5 were taught by 50-74% and more variation was found below 50%. Using a cut off point of 40%, a list of 20 typically taught strategy tools was established as the basis of our survey. The final list derived for the survey reflects tools that have been used in previous surveys (e.g. Glaister & Falshaw, 1999; Hodgkinson et al., 2006) and so provides confirmation that our study has captured those strategy tools typically taught and, therefore, more likely to be used.
The survey was then administered online to a population of 20,108 domestic and international alumni in a sample of 12 out of the top 30 UK business schools. These schools were selected pragmatically because they were prepared to email our survey link to their alumni databases at this time period. The alumni population parameters of these schools are consistent with those of UK business schools within their league (top 30), insomuch as these figures are known. The specific response rate from our target population (business school alumni who have done a foundation strategy course) is difficult to ascertain, as we do not have figures for non-responsive email accounts and were not able to isolate the datasets to include only those alumni in our target population but had to email to the alumni databases held by the various business schools. However, the response rate from total numbers emailed, without excluding non-responsive emails or non-target population, is 14.2%. The survey was in 4 sections. For the section of the survey that we analyse in this paper, we gained 1407 usable responses for the section of the survey we analyse in this paper.
Measures
We assessed respondents use of strategy tools by asking them to indicate, against each of 20 tools typically taught in foundation strategy courses, which tools: they are currently using; they have used previously but do not use now; they have heard of but do not use; and they never have heard of. From the tools they are currently using we asked them to rank their 3 top tools from that list. From analyzing the frequency count of the tools they are currently using, we conclude that only 10 (which represents 95% usage) of the tools are typically used by our respondents. So in subsequent analyses, we composed a grouping variable of those who indicated that their top 1, 2 or 3 is listed among the 10 top tools from our original list of 20 tools.
1. We assessed their use of the top tool for the following strategy stages by asking our respondents to choose the tool that applies during any of the following strategy stages: a) Strategy analysis and formulation (e.g. Analysing internal and external environment and/or establishing a strategic direction); b) Strategic choice (e.g. Generating strategic options and/or evaluating these options and/or choosing a strategy); c) Strategy implementation (Developing detailed plans; implementing these plans; monitoring, controlling & reviewing strategic performance.
2. We assessed value of that tool during the different strategy stages by asking respondent to indicate on a 5 – point Likert type scale (anchored between adds little value to adds much value) the extent to which the tool adds value to the following strategy stages; “Strategy analysis and formulation”; “Strategy choice”, “strategy implementation.
Results
Table 2: Tool Usage by Percentage
TOP TOOL 1 Frequency Percent
1 SWOT 459 32.6
2 scenario planning 214 15.2
3 Critical (key) success factors 177 12.6
4 value chain 136 9.7
5 Core competences analysis 94 6.7
6 porter's 5 forces 92 6.5
7 PESTLE 74 5.3
8 resource analysis 63 4.5
9 Lifecycle Model 51 3.6
10 portfolio matrices, BCG or
McKinsey 48 3.4
Total 1407 100
A Cross-tabulation procedure was used to show how managers allocated each tool to the different stages of the strategy process.
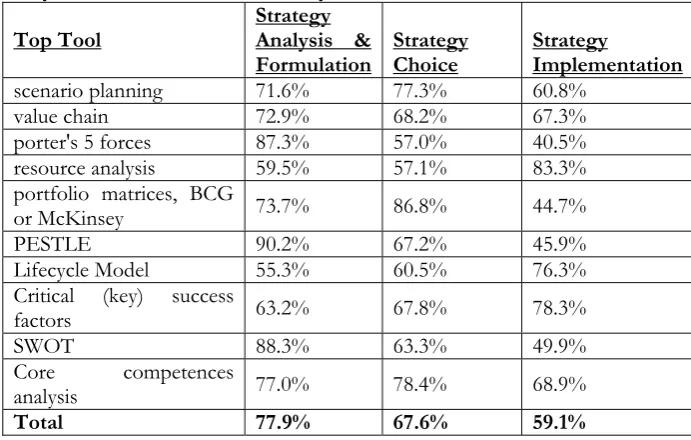
[image:6.595.118.464.412.632.2]Table 3 indicates that, in total, our respondents use the strategy tools more in the strategy analyses and formulation stage (77.9%) than in strategy choice (67,6%) or implementation (59,1%). The results show that certain tools are very prominent in their use during the strategy analysis activity (e.g. SWOT = 88.3%; PESTLE = 90.2%; and Porter 5 Forces = 87.3%), while others stand out in strategic choice (e.g. e.g. Portfolio Matrices = 86.8%; Core Competences = 78,4%; Scenario Planning = 77.3%) or strategy implementation (Resource Analysis= 83.3%; Critical Success Factors = 78.3%).
Table 3: Summary from Cross-Tabulation Analysis
Top Tool Strategy Analysis &
Formulation Strategy Choice Strategy Implementation
scenario planning 71.6% 77.3% 60.8%
value chain 72.9% 68.2% 67.3%
porter's 5 forces 87.3% 57.0% 40.5%
resource analysis 59.5% 57.1% 83.3%
portfolio matrices, BCG
or McKinsey 73.7% 86.8% 44.7%
PESTLE 90.2% 67.2% 45.9%
Lifecycle Model 55.3% 60.5% 76.3%
Critical (key) success
factors 63.2% 67.8% 78.3%
SWOT 88.3% 63.3% 49.9%
Core competences
analysis 77.0% 78.4% 68.9%
Total 77.9% 67.6% 59.1%
These results thus show that our respondents select and use their top tools differently for different stages of the strategy process. We were thus interested to probe this further by examining how the value managers attribute to the tools is related with their levels of usage in each stage. In other words, we investigate if the value attributed to tools influences managers selection of tools as their top 1 tool (from our list of 10 top commonly used tools).
implementation is higher (0.077 or 7.7%) than that for strategy analysis (0.044 or 4.4%) and strategy choice (0.039 or 3.9%).
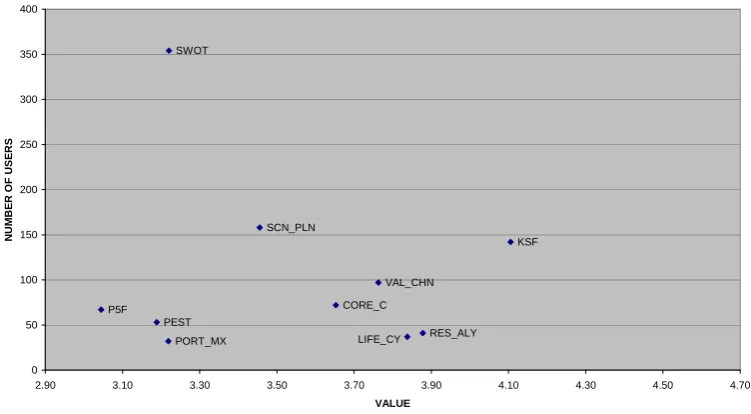
Table 4 indicates that PESTLE (4.47), Core Competences (4.20) and Portfolio Matrices (4.18) are the tools most valued for strategy analysis while Life Cycle (3.50), Resource Analysis (3.74) and Critical Success Factors (3.75) are the least valued tools.
Table 4: Value in the Strategy analysis and formulation Process. -
Eta Squared Measures of Association (Strategy analysis and formulation * toptool_1) = 0.044
toptool_1 Mean N Std. Dev.
PESTLE 4.47 58 0.65
Core competences analysis 4.20 74 0.84
portfolio matrices, BCG or
McKinsey 4.18 33 0.81
value chain 4.16 98 0.87
scenario planning 4.15 163 0.96
porter's 5 forces 4.14 76 0.96
SWOT 4.06 388 0.91
Critical (key) success factors 3.75 135 0.95
resource analysis 3.74 38 0.98
Lifecycle Model 3.50 34 1.26
Total 4.05 1097 0.94
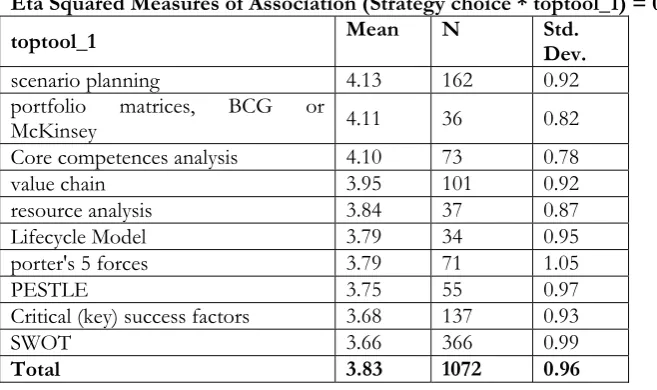
[image:7.595.110.439.489.684.2]Table 5 highlights that Scenario Planning (4.13), Portfolio Matrices (4.11) and Core Competences (4.10) are the tools most valued for strategy choice while SWOT (3.66), Critical Success Factors (3.68) and PESTLE (3.75) are the least valued tools. It is also worth noting that, in general, the value attributed to strategy tools in the strategy choice stage is lower than in strategy analysis.
Table 5: Value in Strategy choice Process
Eta Squared Measures of Association (Strategy choice * toptool_1) = 0.039
toptool_1 Mean N Std. Dev.
scenario planning 4.13 162 0.92
portfolio matrices, BCG or
McKinsey 4.11 36 0.82
Core competences analysis 4.10 73 0.78
value chain 3.95 101 0.92
resource analysis 3.84 37 0.87
Lifecycle Model 3.79 34 0.95
porter's 5 forces 3.79 71 1.05
PESTLE 3.75 55 0.97
Critical (key) success factors 3.68 137 0.93
SWOT 3.66 366 0.99
Total 3.83 1072 0.96
STRATEGY ANALYSIS & FORMULATION
PEST
PORT_MX SWOT
LIFE_CY RES_ALY KSF
SCN_PLN
VAL_CHN
CORE_C P5F
0 50 100 150 200 250 300 350 400
2.90 3.10 3.30 3.50 3.70 3.90 4.10 4.30 4.50 4.70
VALUE
NUMBE
R OF
USE
R
[image:8.595.110.429.93.268.2]S
Table 6: Value during Strategy implementation
Eta Squared Measures of Association (Strategy implementation * toptool_1) = 0.077
toptool_1 Mean N Std.Dev.
Critical (key) success factors 4.11 142 0.96
resource analysis 3.88 41 1.10
Lifecycle Model 3.84 37 1.09
value chain 3.76 97 1.14
Core competences analysis 3.65 72 1.18
scenario planning 3.46 158 1.23
SWOT 3.22 354 1.21
portfolio matrices, BCG or McKinsey 3.22 32 1.24
PESTLE 3.19 53 1.16
porter's 5 forces 3.04 67 1.38
Total 3.49 1053 1.22
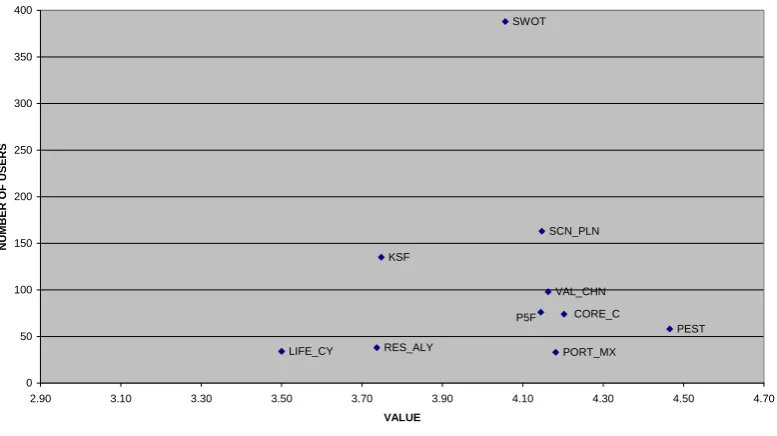
The means in the above tables are also depicted in charts (see Fig 1 to 3) to give a graphical representation of how the tools are dispersed in relationship to their added value. The charts show that in the analysis and choice stages the means added value of the tools are virtually clustered together, while for the implementation stage the mean added values are more spread throughout the value scale, indicating more variability in the perceived value of strategy tools for the implementation stage. These results also indicate that all tools are used for all stages, although the value attributed to them diminishes progressively as one goes from analysis to implementation. Thus, the results highlight that managers attribute different value to tools based on the stage of the process they are used.
[image:8.595.97.486.479.697.2]STRATEGY CHOICE SCN_PLN PORT_MX CORE_C VAL_CHN RES_ALY LIFE_CY P5F PEST KSF SWOT 0 50 100 150 200 250 300 350 400
2.90 3.10 3.30 3.50 3.70 3.90 4.10 4.30 4.50 4.70
VALUE NU MDER OF USERS STRATEGY IMPLEMENTATION KSF RES_ALY LIFE_CY VAL_CHN CORE_C SCN_PLN SWOT PORT_MX PEST P5F 0 50 100 150 200 250 300 350 400
2.90 3.10 3.30 3.50 3.70 3.90 4.10 4.30 4.50 4.70
[image:9.595.108.487.121.325.2]VALUE NU MB ER O F US ER S
Fig 2: Chart of Number of Users and the Mean Added Value during the Strategy Choice Stage
Fig 3: Chart of Number of Users and the Mean Added Value during the Strategy Implementation Stage
[image:9.595.113.489.394.601.2]Table 7: Rank Order
Top Tool Usage by % Strategy Analysis &
Formulation
Strategy
Choice Strategy Implementation
SWOT 1 7 10 7
scenario planning 2 5 1 6
Critical (key) success factors 3 8 9 1
value chain 4 4 4 4
Core competences analysis 5 2 3 5
Porter's 5 forces 6 6 7 10
PESTLE 7 1 8 9
resource analysis 8 9 5 2
Lifecycle Model 9 10 6 3
portfolio matrices, BCG etc 10 3 2 8
Some results of individual tools are interesting to highlight. For example, while 88.3% said they use SWOT (also ranked 1st in terms of % usage) in the strategy analysis stage (see Table 2), it was only ranked 7th in terms of the value it adds to that specific activity. This suggests that some other features of the tool drive its use (ranked 1st by % usage), as its popularity during the analysis stage is not due to the added value; and indeed it is still lowly ranked in the other 2 strategy activities (10th and 7th). Portfolio Matrices seems to confirm this divergence between tool usage and tool value although in the opposite direction. Table 7 shows that it is the lowest ranked tool (10th) in terms of usage but it is highly valued for strategy analysis (2nd) and choice (3rd)
However, this discrepancy between tool usage and tool value does not seem to apply to all tools. For example, it was observed in Table 2 that tools like Resource Analysis and Lifecycle Model are more useful in the strategy implementation stage (83.3% and 76.3% respectively) than in the other two strategy phases. Table 7 suggests that these tools are more useful in the strategy implementation stage because of their added value (ranked 2nd and 3rd respectively; see strategy implementation column of table 7).
[image:10.595.107.421.519.637.2]It was found that managers attribute different value to strategy tools based on which stage of the strategy process they are used. In order to examine if there is any relationship between the value attributed to tools and the stage of the strategy process we did a Spearman’s rho rank correlation coefficient (rs) (Table 8).
Table 8: Rank Order Correlations
Strategy
Analysis Strategy Choice Strategy Implementation
Strategy Analysis 1 0.333 -0.588*
Strategy Choice 0.333 1 -0.006
Strategy Implementation -0.588* -0.006 1
* Correlation significant at the 0.05 (1-tailed)
Discussion and Conclusion
Overall our research produced some interesting findings that enrich our knowledge about the actual use of strategy tools. Firstly, it was found that strategy tools use is not specific to a single stage of the strategy process rather their use spread across all stages. Secondly, it was found that strategy tools use and value are not strongly correlated. In fact, our results showed that some tools are highly used although managers clearly attribute less value to them (e.g. SWOT). This may be an indication that non-instrumental reasons drive the adoption of those strategy tools. Thirdly, the findings highlighted that the use and value of strategy tools decreases progressively as we move from strategy analysis to strategy implementation. This might indicate that few strategy tools are appropriate for strategy implementation where our respondents clearly attributed less value to strategy tools. Nevertheless, this result was somehow expected given that our review of the expected use for strategy tools in strategy texts (see Table 1) demonstrated that no tool was clearly oriented for implementation. It was also interesting that the expected use of the tools (according to strategy texts) not always resembles their actual use. For example, Resource Analysis and Critical Success Factors were clearly considered in strategy text as tools for strategy analysis. However, our results indicate that these tools are most used and valued for strategy implementation. Similarly, Portfolio Matrices were mainly regarded as a analysis tools by strategy texts (see Table 1) but it was found that mangers use them more for choice.
References
Ackoff R. 1970. A Concept of Corporate Planning. Long Range Planning3(1): 2-8 Andrews K. 1971. The Concept of Corporate Strategy. Irwin: Homewood, Ill.
Ansoff I. 1965. Strategy and Structure: An Analytical Approach to Business Policy for Growth and Expansion. McGraw Hill: New York
Ansoff I. 1991. Critique of Henry Mintzberg's 'the Design School: Reconsidering the Basic Premises of Strategic Management'. Strategic Management Journal12: 449-461
Boyd B. K., Reuning-Elliott E. 1998. A Measurement Model of Strategic Planning. Strategic Management Journal 19(2): 181-192
Brews P. J., Hunt M. R. 1999. Learning to Plan and Planning to Learn: Resolving the Planning School/Learning School Debate. Strategic Management Journal20(10): 889-913
Clark D. N., Scott J. L. 1999. Strategic Level Ms/or Tool Usage in the United Kingdom and New Zealand: A Comparative Survey. Asia-Pacific Journal of Operational Research16(1): 35
Dyson R., O'brien F. 1998. Strategic Development: Methods and Models. John Wiley & Sons Inc
Frazer L., Lawley M. 2000. Questionnaire Design & Administration: A Practical Guide. Brisbane. John Wiley & Sons: New York
Glaister K. W., Falshaw J. R. 1999. Strategic Planning: Still Going Strong? Long Range Planning32(1): 107-116 Grant R. 2003. Strategic Planning in a Turbulent Environment: Evidence from the Oil Majors. Strategic Management Journal24(6): 491-517
Grant R. 2008. Why Strategy Teaching Should Be Theory Based. Journal of Management Inquiry17(4): 276-281 Hodgkinson G. P., Whittington R., Johnson G., Schwarz M. 2006. The Role of Strategy Workshops in Strategy Development Processes: Formality, Communication, Co-Ordination and Inclusion. Long Range Planning 39(5): 479-496
Hopkins W. E., Hopkins S. A. 1997. Strategic Planning-Financial Performance Relationships in Banks: A Causal Examination. Strategic Management Journal18(8): 635-652
Hutzschenreuter T., Kleindienst I. 2006. Strategy-Process Research: What Have We Learned and What Is Still to Be Explored. Journal of Management32(5): 673-720
Jarzabkowski P., Spee P. 2009. Strategy-as-Practice: A Review and Future Directions for the Field. International Journal of Management Reviews11(1): 69-95
Jarzabkowski P., Wilson D. C. 2006. Actionable Strategy Knowledge:: A Practice Perspective. European
Management Journal24(5): 348-367
Johnson G., Scholes K., Whittington R. 2008. Exploring Corporate Strategy: Text & Cases, 8th ed. Financial Times/Prentice Hall
Katsikeas C. S., Samiee S., Theodosiou M. 2006. Strategy Fit and Performance Consequences of International Marketing Standardization. Strategic Management Journal27(9): 867-890
Learned E. P., Christensen C. R., Andrews K. R., Guth W. 1965. Business Policy: Text and Cases. Irwin: Homewood, Ill.
March J. G. 2006. Rationality, Foolishness, and Adaptive Intelligence. Strategic Management Journal27(3): 201-214 Markides C. C. 1999. A Dynamic View of Strategy. Sloan Management Review40(3): 55-63
Mintzberg H. 1990. The Design School: Reconsidering the Basic Premises of Strategic Management. Strategic Management Journal11: 171-195
Porter M. E. 1996. What Is Strategy? Harvard Business Review74(6): 61-78
Rigby D. 2001. Management Tools and Techniques: A Survey. California Management Review43(2): 139-160 Rigby D., Gillies C. 2000. Making the Most of Management Tools and Techniques: A Survey from Bain & Company. Strategic Change9(5): 269-274
Rumelt R. P., Schendel D. E., Teece D. J. 1994. Fundamental Issues in Strategy: A Research Agenda. Harvard Bussiness School Press: Boston
Tanriverdi H., Venkatraman N. 2005. Knowledge Relatedness and the Performance of Multibusiness Firms. Strategic Management Journal26(2): 97-119
Tsoukas H., Knudsen C. 2002. The Conduct of Strategy Research. In A Pettigrew, H Thomas, R Whittington (Eds.), Handbook of Strategy and Management: 411-435. Sage Publications: London
Whittington R. 2003. The Work of Strategising and Organising: For a Practice Perspective. Strategic Organisation 1(1): 56-65
Whittington R. 2006. Completing the Practice Turn in Strategy Research. Organization Studies (01708406)27(5): 613-634