EXAMINING THE RELATIONSHIP BETWEEN CUSTOMER LOYALTY AND SERVICE QUALITY OF LIFE INSURANCE COMPANIES
Rachna Agarwal Post Doctorate Fellow (UGC)
Department of Economics, Aligarh Muslim University
Professor Ashok Mittal
Department of Economics, Aligarh Muslim University
Abstract
The objective of present study was to measure the service quality and customer loyalty in life
insurance companies and also to measure the relationship between service quality of
insurance companies and the customer loyalty towards the life insurance companies.
Research was based on primary study. Total 40 branches of insurance companies in
Delhi/NCR region have been surveyed during study and total 314 responses were found to be
correctly filled up by the customers and used for analysis. Researcher has used frequency
tables, bar chart, stepwise regression and correlation in the study. It was found that Insurance
Products and customer benefits, Employees’ Behaviour, Tangibility and Customer services
are the significant predictors of service quality of life insurance companies and service
quality of the life insurance companies has a positive and significant relationship with the
customer loyalty in life insurance companies. The highest contributing variable in the service
quality of the life insurance companies is; Insurance Products and customer benefits and the
least contributing variable in the service quality of the life insurance companies is,
Tangibility. The study is limited to life insurance companies of Delhi/NCR only.
Keywords: Life insurance, Service Quality, Customer Services, Employees’ Behaviour and Brand Value.
International Research Journal of Management and Commerce ISSN: (2348-9766)
Impact Factor- 5.564 Volume 5, Issue 4, April 2018
Website- www.aarf.asia, Email : editor@aarf.asia , editoraarf@gmail.com
Introduction
Life insurance companies offer services which are credibility products or products that can be
sold only with the trust between buyer and seller, with very limited cues to indicate its
quality. It has been proposed that customers generally rely on external indicators of quality
such as; brand image to determine and evaluate quality of insurance products (Gronroos,
1984). This aspect is expressly correct for a “pure” service like insurance products, which has
negligible tangible demonstrations of the quality of its products. Further, the price of the
insurance products cannot be considered as an external indicator of the quality as the price of
the insurance products varies and mainly the products are customized in nature hence the
price cannot be taken as quality indicator in life insurance companies (Crosby and Cowles,
1986). Post purchase evaluation of the insurance products is not possible as the results are
mostly takes time in life insurance and hence it cannot be a criterion for the evaluation of the
service quality of the products. The purchase of life insurance products does not give
satisfaction to customers just after buying a policy. Therefore, the immediate reaction of the
customers is not possible at all (Crosby and Stephens, 1987). This condition is more
deceptive as the upcoming benefits of the “insurance product” bought are problematic to
predict and yield a long time to “demonstrate” its effects. Occasional purchase and “usage” of
such credibility products by customers makes them unable to form any expectations towards
the services and it is very difficult to evaluate the perceive benefits even because of limited
knowledge and understanding with the service or insurance products (Johnston et al., 1984).
Moreover, the customers of life insurance companies believe in creating long term relation
with the insurance companies or the agents as a huge amount of money got invested by the
customers, and they need to build relation to avoid risk or uncertainties, (Richard and
Allaway, 1993; Berry, 1995). The expectations of the customers towards the pure services
like insurance differ from the tangible goods (Toran, 1993). In almost 80 percent of the cases
insurance policies are sold through agent and hence the direct contact between the insurance
company and the customers remains absent (Clow and Vorhies, 1993). Hence, the integrity of
the customers and the knowledge and skills of the agents plays a significant role in the
service quality of the insurance companies, (Zeithamlet al., 1993). Service quality provided
by the agents and the relationship of the customers and the insurance agents either lessen or
exacerbate the perceived risk in buying the life insurance policy. Trust and the integrity of the
agents are the most important factor for selling an insurance product (Slattery, 1989). In life
insurance industry, the high service quality is a rare concept and now a day’s customers are
(1993) emphasized on the quality of the insurance products and stated that it is the core
element of the insurance industry. Various researchers have stated that the customers need to
build better contacts with their agents, effectiveness in the communication, accuracy in the
monetary transactions along with the confidentiality and privacy of the clients, (Pointek,
1992). Performance of the insurance company also affects the loyalty of the customers
towards the insurance companies. Integrity of the agents, quick solution to their problems,
and the reputation or the goodwill of the insurance company is the major factors which are
looked upon by the customers while buying an insurance policy. It is difficult to understand
the expectations of the customers when the services are provided through agents and also to
maintain the service quality when the services are not being directly provided by the life
insurance companies, (Walker and Baker, 2000).
Review of Literature
Researchers have defined customer loyalty in different ways. Some of the studies have
defined loyalty as an attitude (Wong and Zhou, 2006) while some researchers have defined
loyalty as a behavioural aspect (Pritchard and Howard, 1997). While it is also correct to say
that loyalty is a mix of both the attitude and the behavioural aspects of the customers.
Customer loyalty gets affected by the past experiences of the customers, and the perceived
service quality (Jacoby and Keyner, 1973). Loyalty is always reflecting in the behaviour of
the customers, customers who are loyal will come again and again to the same seller and will
do repeated purchase. Loyalty helps in increasing the customer data base of the company,
word of mouth marketing and the easy to charge premium price from the loyal customers.
Hence, it can be measured through the probability of the consumption of existing customers,
future purchases and the increase in the consumption share, (Kumar and Shah, 2008).
Further, it was argued by researchers that the repeated purchase of the products or services
depends on the brand image and the loyalty of the customers towards the brand too. Brand
loyalty is an important aspect to be considered while measuring customer loyalty, (Solomon
et al., 2006). Further, it was argued by researchers that every repeated purchase may not be
called loyalty, hence it can be classified as intentional loyalty or the fake loyalty, (Day,
1969). Loyalty can be expressive, evaluative or the behavioural in nature, (Sheth and Park,
1974). While Oliver (1999) has defined three phases of loyalty namely; intellectual, affective,
and action. Service quality, price of the goods this all comes at first phase and the loyalty is
based on these aspects, while in second phase, loyalty comes because of affection towards the
brand and in third phase loyalty reflects through action of the customers and customer
Numerous research studies are available where researchers have found the impact of service
quality on the customer loyalty. Service quality has a direct impact on the customer
satisfaction and customer satisfaction affects the customer loyalty. Customers who are
satisfied with the service quality will make repeated purchase and will remain loyal towards
the company, (Sudharshan, 1995). Customer loyalty indicates the positive attitude of the
customers towards the services or products quality (Wong and Zhou, 2006).Gounaris and
Stathakopoulos (2004) found that the service quality and customer loyalty are highly
correlated. Higher service quality will help in retaining the customers for long term in the
business. Research study related to gap analysis in Insurance sector confirms that the service
quality which is expected and perceived by the customers differs significantly. Ineffective
Communication, lack of commitment, lack of trust are the major factors which have created
this service gap in insurance sector, (Mahajan, 2013). Siddiqui and Sharma (2010) also
studied the service gap in life Insurance industry and found that the customer expectations are
higher while the actual service quality they perceive is very less. Saha and Dutta (2015)
identified the factors which affect perception of customers towards the service quality of life
insurance companies operating in North-east India. Researchers highlighted total seven
factors through which the quality of insurance services got reflects namely; Empathy to
dependable Receptivity, Tangibility, Service Enactment, Understanding Client requirements,
Reliability, Influencing the Client and Service Assurance. Siddiqui and Sharma (2010) found
total six factors which represent the service quality of the life insurance industry. It was found
that that tangibility, customized services related to finance, brand value, corporate identity
and the assurance are the major factors. Mehta and Lobo (2002) also argued that the
customers of insurance companies mainly look for the customized financial services; the
people who want to get life insurance are risk averse in nature and believe in making
investment to avoid risk of uncertain death or mis-happenings. Here, the knowledge of the
insurance companies’ employees plays a significant role as they need to advise the clients and
to convince them regarding various policies and the premium amount due on the policies, or
the documents required for the insurance policies, procedures to be followed by the
customers for insurance claims etc. Insurance sector is the most information sensitive sector,
any information related to the any company shake the trust of the customers of other
companies too (Sandhu and Bala, 2011). Hence, the communication channel of the life
insurance companies is an important service quality variable. Effective communication can
return. Further, researchers have argued that the insurance sector is a service oriented sector,
hence the performance of the insurance companies and the level of service quality get
affected by the knowledge, skills, attitude and the behaviour of the insurance companies’
employees (Bodla and Chaudhary, 2012). Brand image or the corporate identity is another
important factor in insurance companies. The products of the life insurance companies are
almost same the only difference is of the return, interest rates or the growth rate. Hence, it is
the brand image or the corporate identity which attracts the customer to buy the insurance
products of a specific company. Brand image can be built by company when it provides the
better service quality to its customers as per their expectations consistently. Quershi and Bhat
(2015) stated that the service quality of the life insurance companies directly affects the
customer loyalty towards the insurance companies. Customers of life insurance companies
prefer to purchase the policies for their family members from same insurance companies if
they have positive experience related to their previous policy.
Keeping in view the findings from literature, researchers have conducted a study to measure
the relationship between service quality and customer loyalty in life insurance companies of
India.
Objectives
1. To identify the predictors of service quality in life insurance companies.
2. To study the relationship between service quality and customer loyalty in life insurance companies.
Research Methodology
Research was conducted on the customers of life insurance companies operating in India. A
survey was conducted for duration of the three months to collect the data from the insurance
companies’ customers. Researcher has personally visited the insurance companies’ branches
and gets the questionnaire filled by the customers over there. Total 40 branches of insurance
companies in Delhi/NCR region have been surveyed during study and total 314 responses
were found to be correctly filled up by the customers and used for analysis. Questionnaire
consisted total 25 items five items under each of the five variables used in research namely;
Insurance Products and customer benefits, Employees’ Behaviour, Tangibility, Customer
S.N. Life Insurance Companies Number of customers surveyed
1 ICICI Prudential life Insurance 36
2 HDFC Standard Life Insurance 31
3 PNB Met life Insurance 32
4 Bajaj Allianz Insurance 28
5 IDBI Federal Life Insurance 20
6 Max Life Insurance 18
7 Birla Sun Life Insurance 30
8 Reliance Life Insurance 39
9 Tata AIG 28
10 LIC 53
Total 10 companies 315
Researcher has used frequency tables, bar chart, stepwise regression and correlation in the
study. Researcher has tested the following hypothesis in the current study: The mean value of
each of the five dimensions of service quality namely; Insurance Products and customer
benefits, Employees’ Behaviour, Tangibility, Customer services have been used as
independent variables and customer loyalty has been taken as dependent variable in the study.
H01: There is no significant impact of service quality and its dimensions, on the customer
loyalty among insurance companies’ customers.
Analysis and Findings
Out of 315 respondents 32 percent were male customers and 68 percent were female
customers of the ten life insurance companies surveyed during current study. Majority of the
insurance companies’ customers surveyed were from an age group of 40 to 45 years followed
by customers from an age group of 30 to 35 years while the least percentage of the customers
was less than 25 years. The highest qualification of the insurance customers was
post-graduation and lowest qualification of the customers was recorded below tenth. Majority (68
percent) of the customers of insurance companies were found to have more than one
insurance policies and the highest premium amount paid by the customers was recorded
15000 per month while the lowest premium amount for life insurance companies paid by
customers was 250 per month. Majority (56 percent) of the insurance customers have opted
monthly premium policies while 29 percent of the customers have opted annual and rest of
the 15 percent have opted one-time insurance premium policies.
Reliability of the questionnaire was measured using split half method and the value was
found to be 0.853 for 25 items and it can be said that the questionnaire was reliable and used
Service Quality of Insurance Companies and Customer Loyalty
This section shows the correlation analysis between customer loyalty and the service quality,
and its four dimensions namely; Insurance Products and customer benefits, Employees’
Behaviour, Tangibility and Customer services.
Table 1: Correlation coefficients between Service Quality of Insurance Companies and Customer Loyalty
Correlations Matrix Customer
Loyalty
Employees’
Behaviour Tangibility
Customer services Benefits to customers Overall service quality Customer Loyalty Pearson
Correlation 1
Sig.
(2-tailed)
.000
N 315
Employees’ Behaviour
Pearson
Correlation .523
**
1
Sig.
(2-tailed) .000
N 315 315
Tangibility
Pearson
Correlation .427
**
.349** 1
Sig.
(2-tailed) .000 .000
N 315 315 315
Customer services
Pearson
Correlation .309
**
.278** .352** 1
Sig.
(2-tailed) .000 .000 .000
N 315 315 315 315
Benefits to customers
Pearson
Correlation .314
**
.328** .311** .207** 1
Sig.
(2-tailed) .000 .000 .000 .000
N 315 315 315 315 315
Overall service quality
Pearson
Correlation .562
**
.471** .380** .396** .305** 1
Sig.
(2-tailed) .000 .000 .000 .000 .000
N 315 315 315 315 315 315
Interpretation: It can be interpreted from the correlation analysis that service quality, and its four dimensions namely; Insurance Products and customer benefits, Employees’ Behaviour,
Tangibility and Customer services; were found to be positively and significantly related to
the customer loyalty in insurance industry. The positive correlation shows that if there will be
an increase in the service quality then the customer loyalty will also get increase. Similarly; if
there will be a decrease in the any of the service quality customer loyalty will also decrease.
Thus, in Insurance Industry, the customer loyalty of the people get insurance policies can be
increased if they perceive high level of service quality.
Overall, it can be said that customer loyalty is positively and significantly related to the
service quality, and its four dimensions namely; Insurance Products and customer benefits,
Employees’ Behaviour, Tangibility and Customer services.
Service Quality and Its Four Dimensions as Predictors of Customer Loyalty
Interpretation: Graph 1 shows the mean values of service quality and its four parameters. The Highest mean value was of Employees behaviour and the lowest mean value was of
customer services. It shows that the life insurance companies are having good staff, with
adequate knowledge and skills, deals with the customers in friendly way but the customer
services are not good. Communication channels of life insurance companies are not good
enough, customers don’t get the updates about their premium, the promises are not kept by
the companies, and customers need to face huge problems related to their claims. The overall
service quality was perceived by insurance customers is high and it can be said that the
service quality of life insurance companies is good.
This section discuss the analysis related to the relationship between dependent and
independent variable, where customer loyalty is considered as dependent variable and the
3.8
2.3
1.5
2.9
3.9
EMPLOYEES’ BEHAVIOUR
TANGIBILITY CUSTOMER SERVICES
BENEFITS TO CUSTOMERS
OVERALL SERVICE QUALITY
service quality considered as independent variable. Researcher has used stepwise regression
model to extract the significant predictors of service quality. Following is the conceptual
model tested during current study:
Figure 1: Conceptual Model
Following are the main hypothesis formulated based on the conceptual model, which have
been tested using the regression analysis:
H01# Employees’ Behaviour has no significant impact on the service quality of Life
Insurance companies.
H02# Tangibility has no significant impact on the service quality of Life Insurance companies.
H03# Customer services have no significant impact on the service quality of Life Insurance
companies.
H04# Insurance Products and customer benefits have no significant impact on the service
quality of Life Insurance companies.
H05# there is no significant relationship between service quality and customer loyalty in Life
Insurance companies.
Following regression equation has been framed to test in the current study:
X = α + β1Y1 + β2Y2 + β3Y3 + β4Y4 + Ƹ
Where; α, is the constant term, β1, β2, β3, and β4, is the value of regression coefficients for the
independent variables, Ƹ denotes the error term, X is the dependent variable i.e. Service
Quality and Y1, Y2, Y3,and Y4are the independent variables i.e. Insurance Products and
[image:9.595.71.534.92.282.2]customer benefits, Employees’ Behaviour, Tangibility and Customer services.
Table 2: Regression Results
Model R R Square Adjusted R
square
Std. Error of the estimate
1 .763 .582 .580 .5428
Customer services Tangibility
Insurance Products and customer benefits
Employees’ Behaviour
Interpretation: It was found from the results of step wise regression analysis that out of four independent variables i.e. Insurance Products and customer benefits, Employees’ Behaviour,
Tangibility and Customer services, all the four variables were got entered into the regression
analysis. It was found from the study that the value of R was 0.763, and r-square was found
to be 0.582, which indicates that 58 percent of the variation in the value of service quality is
caused by these four factors only, while remaining 42 percent of the variation is caused due
[image:10.595.70.532.195.284.2]to other factors.
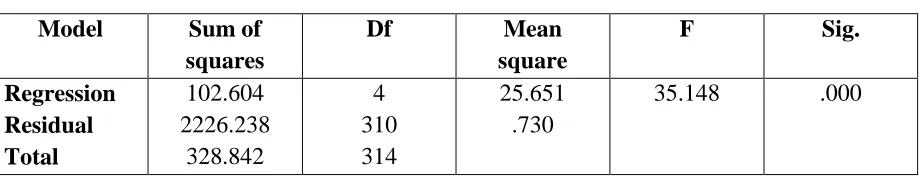
Table 3: ANOVA Results Model Sum of
squares
Df Mean
square
F Sig.
Regression Residual Total
102.604 2226.238
328.842
4 310 314
25.651 .730
35.148 .000
Interpretation: The results of ANOVA given in table 2 shows that the f-value is found to be significant at one percent level of significance. Thus, a significant model has emerged. Null
hypothesis which states that service quality and its dimensions i.e. Insurance Products and
customer benefits, Employees’ Behaviour, Tangibility and Customer services have
significant relationship, got rejected in the study.
Table 3: Regression Coefficients Regression Model Unstandardized
Coefficients
Standardized Coefficients
t Sig. B Std.
Error
Beta
(Constant) 1.607 .254 6.334 .000
Employees’ Behaviour .365 .098 .178 2.48 .014
Tangibility .263 .074 .245 4.94 .000
Customer services .433 .067 .180 3.50 .001
Insurance Products and customer benefits
.483 .091 .206 3.11 .002
Interpretation: Table 3 shows the regression coefficients for all the four independent variables. It was found from the p-values of all the four independent variables that all the four
independent variables have significant relationship with the dependent variable i.e. service
quality. Further, it was found that the value of all the four regression coefficients was positive
thus, it can be said that all the four independent variables used in the regression model were
positively and significantly related to the service quality. The value of regression coefficient
was found of Tangibility i.e. 0.363, while the lowest value of regression coefficient was
[image:10.595.71.527.404.588.2]the service quality among insurance companies’ customers; is Tangibility and the least
contributing variable in the service quality among insurance companies’ customers, is
Customer services. Four dimensions of service quality of insurance companies i.e.
Employees’ Behaviour, Tangibility, Insurance Products and customer benefits and customer
services were found to have positive and significant relationship with the service quality.
Thus, the hypothesis which states that Employees’ Behaviour, Insurance Products and
customer benefits, Customer services, and Tangibility has positive sand significant
relationship with the service quality got rejected in the study.
Regression Equation emerged from the stepwise regression analysis for the service quality
and its four dimensions is as follows:
Regression Equation 1
Service Quality = 1.607 + 0.365 (Employees behaviour) + 0.263 (Tangibility) + 0.433
(Customer services) + 0.483 (Insurance Products and customer benefits)
Further, researcher has measured the relationship between service quality and customer
loyalty in life insurance sector using linear regression method. Results of the study have been
given below:
H05# there is no significant relationship between service quality and customer loyalty in
Life Insurance companies. Regression Equation 2:
[image:11.595.155.444.458.549.2]Customer Loyalty = α + β1. Service Quality + Ƹ
Table 4: Model Summary
Model R R Square Adjusted R
Square
Std. Error of the Estimate
1 .836a .698 .697 .729
F-value = 129.98, p-value = 0.000 a. Predictors: (Constant), Service Quality
Interpretation: It was found from the results of regression analysis that the value of R was 0.836, and r-square was found to be 0.698, which indicates that 69 percent of the variation in
the value of customer loyalty is caused by service quality, while remaining 31 percent of the
variation is caused due to other factors. Further, the results of ANOVA show that the f-value
is found to be significant at one percent level of significance. Thus, a significant model has
emerged. Null hypothesis which states that there is no significant relationship between
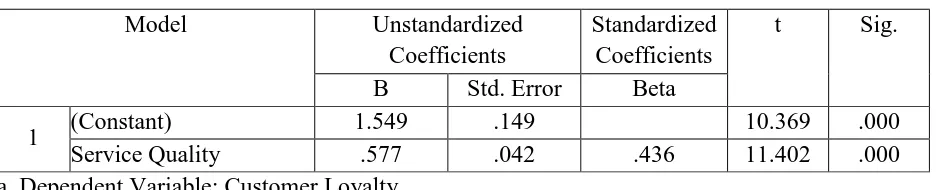
Table 5: Coefficients
Model Unstandardized
Coefficients
Standardized Coefficients
t Sig.
B Std. Error Beta
1 (Constant) 1.549 .149 10.369 .000
Service Quality .577 .042 .436 11.402 .000
a. Dependent Variable: Customer Loyalty
Interpretation: Table 5 shows the regression coefficient for independent variables. It was found from the p-values the independent variable has significant relationship with the
dependent variable i.e. customer loyalty. Further, it was found that the value of the regression
coefficient was positive thus, it can be said that independent variable used in the regression
model was positively and significantly related to the customer loyalty. The value of
regression coefficient was found of 0.577. Thus, the hypothesis which states that there is no
significant relationship between service quality and customer loyalty in Life Insurance
companies, got rejected in the study. It can be said that there is a significant impact of service
quality on the customer loyalty. If the service quality will be higher, then the customer
loyalty will also be higher. Customers who perceive the service quality of the life insurance
companies high they tend to purchase repeated insurance policies from same insurance
companies and also do word of mouth marketing of the company. Hence, it is required to
maintain the services quality to retain the existing customers in the business and attracting the
new customers.
Overall, it can be said that Insurance Products and customer benefits, Employees’ Behaviour,
Tangibility and Customer services are the significant predictors of service quality of life
insurance companies and service quality of the life insurance companies has a positive and
significant relationship with the customer loyalty in life insurance companies.
Conclusion
Life insurance companies are growing at a very fast rate, but still the insurance companies
have not covered the enough market due to the lack of awareness among the people and the
past experiences of the customers related to the claim settlement or the premium amount.
Current study focuses on measuring the service quality of the life insurance companies and its
impact on the customer loyalty. It was found from the study that service quality and the four
dimensions of service quality of life insurance companies i.e. Employees’ Behaviour,
Tangibility, Insurance Products and customer benefits and customer services were found to
positive and significant relationship with the customer loyalty in life insurance companies.
Hence, life insurance companies need to improve their service quality to attract the people to
get insured and to make existing customers to buy other insurance products too.
Limitations and Future Scope
Current study is limited to only life insurance companies. Future researcher may include the
non-life insurance companies in the research. A comparative study of service quality of life
insurance and non-life insurance companies can be done in future. The sample size of the
study is only 315, which is very small if we compare it to the total number of insurance
customers. Further, the data has been collected from the urban areas and in future research
the data from rural areas can also be collected to make a comparative study of urban and rural
insurance customers.
Managerial Implications
The study is useful for the life insurance companies as it highlights the various dimensions of
service quality where the customers are not happy and need to make improvement for these
dimensions. Such as; customer services are very poor in life insurance companies;
communication channels are not effective; hence there is a need to look upon this factors.
Research shows that the customer loyalty gets affected by service quality of the life insurance
companies therefore; life insurance companies need to improve the service quality to increase
the customer loyalty.
References
1. Berry, L. L. (1995). Relationship marketing of services–growing interest, emerging perspectives. Journal of the Academy of Marketing Science, 23 (Fall), 236-245.
2. Bodla, B. S., & Chaudhary, P. (2012). A study of service quality expected and perceived by the customers of ICICI prudential life insurance company. International Journal of
Computing and Business Research. ISSN (Online): 2229-6166.
3. Clow, K. F. & Vorhies, D. W. (1993). Building a Competitive Advantage for Service Firms. Journal of Services Marketing, 7(1), 22-32.
4. Crosby, L. A. & Stephens, N. (1987). Effects of relationship marketing on satisfaction, retention, and prices in the life insurance industry. Journal of Marketing Research,
24(November), 404-411.
5. Crosby, L. A. & Cowles, D. (1986). Life Insurance Agents as Financial Planners: Matter of Role Consensus. Journal of Professional Services Marketing, 1 (Spring), 69-89.
7. Gounaris, S. VeStathakopoulos, V. (2004). Antecedents and Consequences of Brand Loyalty: An Empirical Study. Journal of Brand Management, 11 (4), 283-306.
8. Gronroos, C. (1984). A Service Quality Model and Its Marketing Implications. European Journal of Marketing, 18 (4), 36-44.
9. Jacoby J. And Kyner D.B. (1973). Brand Loyalty vs. Repeat Purchasing Behaviour. Journal of Marketing Research. 10, 1-9.
10. Johnston, E. O., O’Connor, R. J. & Zultowski, W. H. (1984). The personal selling process in the life insurance industry, in J. Jacoby, & C. S. Craig (Eds.), Personal Selling: Theory,
Research and Practice (pp. 136-164) Lexington, MA: Lexington Books.
11. Kumar, V. and Shah, D. (2004). Building and Sustaining Profitable Customer Loyalty for the 21st Century. Journal of Retailing, 80 (4), 317–330.
12. Mahajan Kavita (2013). Gaps I customer services in insurance industry and strategies to close these gaps. International Journal of Marketing, Financial Services & Management
Research, 2 (7), 22-30.
13. Mehta, S. C. & Lobo, A. (2004). MSS, MSA and zone of tolerance as measures of service quality: A Study of the Life Insurance Industry. Second International Services Marketing
Conference, University of Queensland.
14. Oliver, R. L. (1999). Whence Consumer Loyalty, Journal of Marketing, 63, 33-44.
15. Parasuraman, A., Zeithaml, V. A. and Berry, L. L. (1993). Research Note: More on Improving Quality Measurement. Journal of Retailing, 69, 140-147.
16. Pointek, S. (1992). Outside interests: making the move from lip service to real service. National Underwriter, 96 (44), 34.
17. Pritchard, M.P. And Howard, D.R. (1997). The Loyal Traveller: Examining a Typology of Service Patronage. Journal of Travel Research, 35 (4), 2-10.
18. Quershi Z and Bhat A. (2015). An Assessment of Service Quality, Customer Satisfaction and Customer Loyalty in Life Insurance Corporation of India with Special Reference to
Srinagar District of Jammu and Kashmir. Pacific Business Review International, 7 (8),
60-70.
19. Richard, M.D. and Allaway, A.W. (1993). Service quality attributes and choice behaviour Journal of Services Marketing, 7 (1), 59-68
20. Saha S. and Dutta A. (2015). Perception of service quality in the life insurance sector: A case study on North East India. International Proceedings of Management and Economy,
21. Sandhu, D. H., & Bala, M. N. (2011). Customers' Perception towards Service Quality of Life Insurance Corporation of India: A Factor Analytic Approach. International Journal of
Business and Social Science, 2 (18), 123-138.
22. Sherden, W. (1987). The erosion of service quality. Best’s Review, 88 (5), 22.
23. Sheth, J.N. and Park, C.W. (1974). A Theory of Multidimensional Brand Loyalty. Advances in Consumer Research, 1 (1), 449-459.
24. Siddiqui, M. H., & Sharma, T. G. (2010). Measuring the Customer Perceived Service Quality for Life Insurance Services: An Empirical Investigation. International Business
Research, 3 (3), 171-186.
25. Slattery, T. (1989). Special report: Nichols: we’ve forgotten the consumer. National Underwriter, 48 (November), 11.
26. Solomon, M., Bamossy, G., Askegaard, S. and Hogg, M. K. (2006). Consumer Behaviour: A European Perspective” 3rd Edition, Prentice Hall-Financial Times, Harlow.
27. Sudharshan, D. (1995). Marketing Strategy: Relationships, Offerings, Timing and Resource Allocation” Prentice Hall, New Jersey.
28. Toran, D. (1993). Quality service (quality everything!). LIMRA’S Market Facts, 12 (2), 10-11.
29. Walker, J. & Baker, J. (2000). An exploratory study of a multi-expectation framework for services. Journal of Services Marketing, 14 (5), 411-431.