046
THICK FILM PASTE PREPARATION AND CHARACTERIZATION OF BaTiO
3FOR HUMIDITY SENSOR
Wan Suhaimizan Wan Zaki, 1Rahman Wagiran, 1Samsul Bahari Mohd Noor and 2Abdul Halim Shaari
Department of Electronic Engineering, Kolej Universiti Teknologi Tun Hussein Onn, Batu Pahat, Johor
1Department of Electrical and Electronic Engineering, Universiti Putra Malaysia, Serdang, Malaysia. 2Department of Physics, Universiti Putra Malaysia, Serdang, Malaysia.
Email: [email protected]
ABSTRACT
A dielectric material of BaTiO3 powder was prepared using solid state reaction from raw materials; BaCO3 and
TiO2. A study was conducted to prepare the BaTiO3 thick film paste by mixing the organic vehicle and the
sintered powder in ratio of 30:70. The organic vehicle was formed from suspending ethyl cellulose resins into terpineol solvent in a specific ratio. The paste was printing onto ceramic substrate by using DEK J1202 thick film screen printer machine. The recipe and the process in producing BaTiO3 thick film paste was then
established. The electrical properties of screen-printed BaTiO3 were investigated in an interdigitated electrode
pattern. Experimental results show that the smaller gap between two adjacent electrodes gives higher capacitance and lower resistance value, thus provide better response time in detecting capacitor changes for sensor application. An equivalent circuit to represent the dialectic mechanism of the BaTiO3 thick film sample
has also been established.
Keywords: Screen printed sensor, Interdigitated electrode, complex capacitance, electrical resistivity
INTRODUCTION
Thick film is preferred generic description for the field of microelectronics in which specially formulated pastes are applied onto a ceramic or insulating substrate [1]. The deposited paste with a desired pattern is then thermally treated in a furnace at high temperature to produce a set of passive component or sensing element. One common method to produce a thick film is by screen printing technique. This technique is relatively mature technology with a simple and convenient method to produce thicker layers up to 100µm [3] and the thickness of film is controllable. This process is useful to accommodate the demands of miniaturization, circuit complexity, multiplayer assemblers or high frequencies [4]. Besides, it has advantages over other method in term of cost production and complexity of machinery.
In screen printing fabrication, the paste is applied to the screen and the squeegee travels over the screen, pressing it down into contact with the substrate. The paste is force to go through the open areas of mesh-reinforced screen and thus deposited it onto the surface of a substrate [2]. After printing, the substrate is left at the room temperature or drying it with an infra-red drying system to allow the paste adhere to substrate before continuously printing next layer. In drying stage, the organic vehicles, which give the ink viscosity, are also been removed [2]. Next, the film is firing in a furnace at a relatively high temperature to remove remaining organic solvent and to fuse the films to the substrate. This process, which is know as sintering, also play important role for the electrical characteristic and the microstructure of the film by varying the peak firing temperature.
resistance, while interdigitated electrode pattern is to maximize the electrical admittance between two conducting structure.
In this experiment, the primary functional material used is a Barium Titanate (BaTiO3) powder, prepared by
solid state reaction. Through this method, the equimolar of the BaCO3 and TiO2 will be reacting at high
temperature to form the BaTiO3 powder. Next, the organic vehicles composition of terpineol solvent and
cellulose resins is investigated and established. This solvent is used to form the screen printing paste when mixed with BaTiO3 powder in ratio of 30:70 [5]. The paste is then deposited onto a ceramic substrate by screen
printing technique. The electrical properties of the BaTiO3 thick film were investigated.
MATERIALS AND METHODS
Powder Preparation
The stating materials for the BaTiO3 powder are BaCO3 and TiO2. Equimolar amounts of the stating material
were mixed and wet-ball milled in acetone for 24 hours, then dried in oven at 110°C. Next, the mixing powders were intermediate grinding before calcined at 3°C/minute to a temperature of 850°C and held for 24 hours, followed by cooling at 3°C/minute. After this procedure, the mixing powder was grinding to obtain fine grain particle size using pestle and mortal. The fine grain powder then sintered at 1000°C for 8 hours with ramping rate 3°C/minute for heating and cooling [8].
Organic Vehicle and Paste Preparation
A study was conducted to find the best ratio of organic vehicle between terpineol solvent and ethyl cellulose resins. The terpineol solvent was made by stirring α-terpineol (0.5g) into ethanol (30ml). The solution is then mixed with 0.25g of ethyl cellulose resins. A number of samples shown in Table 1 were used to establish the best form of paste. The ethyl cellulose was dissolved into terpineol solvent after one day left at room
temperature. Next, the thick film paste was prepared by drop the organic vehicles wisely into BaTiO3 powder by
[image:2.612.169.442.431.504.2]maintaining the ratio at 30:70. The mixture was mixed thoroughly to form homogenous paste by the 100 rpm magnetic stirrer at 40°C for about an hour.
Table 1: Different ratio of organic vehicle for paste preparation. Samples Ratio of terpineol solvent to ethyl cellulose
1 2 3 4 5
6:1 8:1 10:1 12:1 14:1
BaTiO
3Thick Film Structure Design
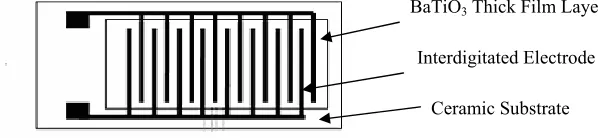
The BaTiO3 thick film structure is a two-layer device printed on a ceramic substrate as shows in Figure 1. The
first layer is silver conductor paint and second layer is the BaTiO3 film layer.
Figure 1: Layout of the BaTiO3 Thick Film Structure
The BaTiO3 film was deposited onto the total area occupied by the intedigited electrode. In general, the purpose
of interdigitated electrode pattern is used to maximize the electrical admittance (capacitance or resistance) of
Interdigitated Electrode [image:2.612.160.459.585.654.2]
material deposited over the electrode. In order to investigate the effect of interdigitated gaps to the dielectric properties of BaTiO3 film, the design of electrode was varied as shows in Table 2. For the purpose of
comparison, the samples were named as El 1, El 2 and El 3 accordingly.
The thick film screen printing was fabricated using DEK J1202RS automatic screen printing machine. First, the interdigitated electrode pattern was printing on the ceramic substrate. The printing electrode then was dried into belt dryer under Infra Red lamp at 150°C for 20 minute to dry the paste before going to the firing process in a furnace. The firing process is set at the peak temperature, 850°C for 10 minutes. Next, the BaTiO3 thick film
[image:3.612.154.458.194.243.2]layer was overprinted onto the substrate with interdigitated electrode pattern. The similar drying and firing process was repeated for the BaTiO3 layer.
Table 2: Design parameter for sample El1, El2 and El3 of screen printed BaTiO3. Samples Gap length (mm) Area of printed dielectric layer (mm2)
El 1 El 2 El 3
0.2 0.6 0.8
48 72 96
Characterization of Thick Film BaTiO
3The characterizations of the BaTiO3 powder was made by Philips X-ray diffractometer (XRD) with Cu Kα
(λ=1.542Å) radiation and the Bragg angle (2θ) ranging from 20º to 80º at room temperature. The electrical properties of the thick film BaTiO3 were carried out in terms of capacitance and dc resistivity. The data for the
complex capacitance analysis is obtained from ac measurement of capacitance, C, and conductance, G, as a function of frequency over the range of 10Hz to 10MHz using LCR meter (Hp 4126). The dc resistivity for the thick film sample was measured by two-point probe, semiconductor Measuring Unit (SMU), model Keithly 4200.
RESULTS AND DISCUSSION
The BaTiO3 powders were produce by solid state chemical reaction based on BaCO3 and TiO2 as raw materials.
The mixtures of raw material are in equimolar relation based on chemical reaction as given as follow [2]:
2 3 2
3
TiO
BaTiO
CO
BaCO
+
→
+
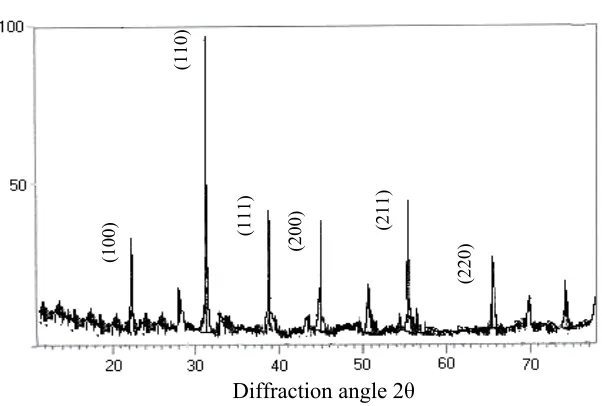
……….(1)The resulting BaTiO3 powder was examined by powder X-ray diffraction analysis with Cu-Kα radiation in the
range 2Ө=10° to 80° (Ө=Brag angle) with a resolution of ∆2Ө=0.03°.
Figure 2: XRD pattern for BaTiO3 powders.
(110)
(100
)
(111)
(200) (211)
(220)
[image:3.612.157.458.501.704.2]From the graph pattern (Figure 2), the highest peak intensity is at 2θ=31.62°. The graphs pattern is almost same as reported by Niepce [9], which indicates that the powder is a BaTiO3. To clearly identify, the plot graph was
compared with the standard XRD stick pattern of Barium Titanate (provide by XRD software database) and show nearly same pattern indicating the BaCO2 and TiO2 are well combined to form BaTiO3 powder.
The ratio of terpineol solvent to ethyl cellulose resins was varying as shows in Table 1. The mixture was pouring in the beaker with certain volume and weighted. The organic vehicles density,
δ
(g/mL) was calculated by following Equation:V
W
/
=
δ
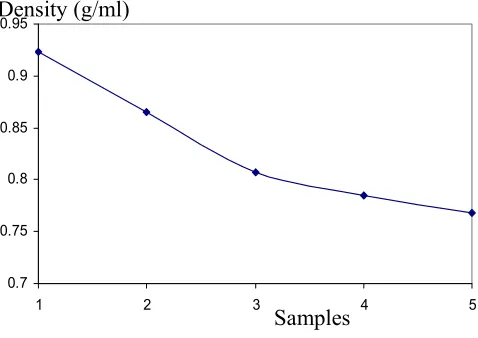
……….(2)Where W is the weight of the organic vehicle in gram and V is the volume of the organic vehicles in milliliter (ml). Figure 3 shows the plotting graph of the organic vehicles density versus samples.
0.7 0.75 0.8 0.85 0.9 0.95
[image:4.612.180.419.216.385.2]1 2 3 4 5
Figure 3: Organic vehicle density for the 5 samples
From Figure 3, sample 1 shows the highest density and the density of the organic vehicles reduces as the ratio of terpineol solvent was increased. The decreases in organic vehicle density made the solution become less viscous. Next, all the 5 samples are mixed with the BaTiO3 powder in the ratio at 30:70 to form thick film paste.
The mixer solution was stirrer by magnetic stirrer to form homogenous paste. After the stirring process, only sample 3, 4 and 5 show diluents properties for thick film screen printing procedure. Sample 1 and 2 were not diluents enough to be used as a thick film paste.
Fabrication of BaTiO
3Thick Film
Samples 3, 4 and 5 pastes were screen printed onto the interdigitated electrode pattern in order to investigate the reliability of the thick film paste. The reliable paste must have properties such as good printing quality, fine line resolution and fast drying rate. The paste for sample number 3 with ratio of 10:1 for terpineol solvent to ethyl cellulose shows the fastest drying rate. The paste easily become dry on screen before screen printing process was made. This behavior makes the paste is not suitable for screen printing based on time factor in printing process. The paste for sample number 4 was better than sample number 3. The paste has been successfully screen printed with a good printing quality and fine line resolution on the interdigitaed electrode pattern. The number 5 sample shows more diluents compare to the sample number 4. Consequently, the drying rate for the sample number 5 becomes slower and the paste not sticks very well with the substrate after the printing process. Therefore, based on this study, the samples number 4 was suitable to be use as a recipe in thick film screen printing technique. The electrical properties of BaTiO3 thick film for sample number 4 will be characterize with
3 different interdigitated electrode structures as shown by Table 2.
Electrical Properties of Thick Film BaTiO
3Complex Capacitance Analysis
It is well known that the dielectric constant of the material is in proportional to the capacitance, so the dielectric property of the material can be investigated by means of the capacitance property. In general, the electrical properties of the material can be representing in complex capacitance, C* with the following relationship:
Density (g/ml)
C* = C’+ jC” (3)
where C’ is the real part of capacitance and C” is the imaginary part of capacitance. The real part of capacitance, C’ is measure how much energy from an external electric field stored in a material. The imaginary part of capacitance, C” is measure how dissipative or lossy a material is to an external electric field and it is related to the dc conduction of the material. The imaginary part of capacitance, C” is given by:
C”=G/ω (4)
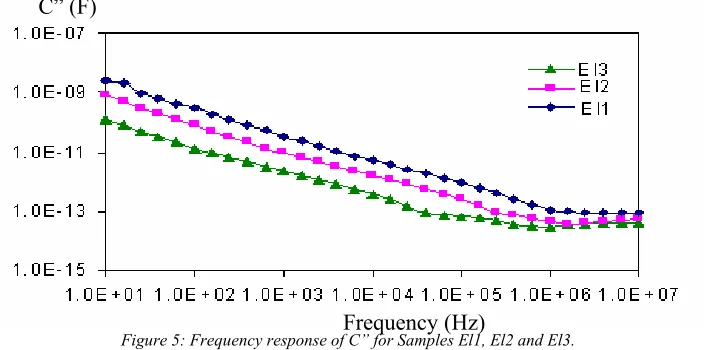
with G, is the conductance (Ω-1) and ω is a frequency in radian (rad/s). Figure 4 and 5 shows the graph of C’
and C” for samples El1, El2 and El3 respectively.
0.0E+00 1.0E-11 2.0E-11 3.0E-11 4.0E-11 5.0E-11 6.0E-11
1.0E+01 1.0E+02 1.0E+03 1.0E+04 1.0E+05 1.0E+06 1.0E+07
[image:5.612.162.449.211.363.2]El1' El2' El3'
Figure 4: Capacitance versus Frequency for Samples El1, El2 and El3.
[image:5.612.132.484.447.622.2]Figure 4 shows that all three samples shows decreases in capacitance value with increases of frequency measurement and become constant at the frequency 10 KHz. This decrease in capacitance was observed with increase in frequency because usually at lower frequency the compound exhibit different types of polarization i.e interfacial, dipolar, atomic, atomic [10]. Sample El1 give higher capacitance and value due to the smaller gap compared to the other two samples, contributes to the higher losses in capacitance as shown by Figure 5.
Figure 5: Frequency response of C” for Samples El1, El2 and El3.
From Figure 5, the losses in capacitance, C” for all samples shows a rapid decrease at lower frequency and becomes slow at the higher frequency. The decrease take places when the jumping frequency of electric charge carriers cannot follow the alteration of applied AC electric field beyond a certain critical frequency [10]. It is normal behavior of ceramics. From the capacitance analysis (Figure 4 and 5), it shows that the higher capacitance value give higher losses in capacitance. It show that the different gap of the interdigitated electrode gives a different result in capacitance measurement with the smaller gap gives higher capacitance compared to the bigger gap.
C” (F)
C’ (F)
Frequency (Hz)
From the concept of universal law, the experimentally observed behavior for different dielectric dispersion can be explain with dipolar, quasi-dc and diffusive mechanism. Based on this concept, an equivalent circuit is constructed in order to explain the dielectric behavior of the BaTiO3 thick film sample. Figure 6 show the
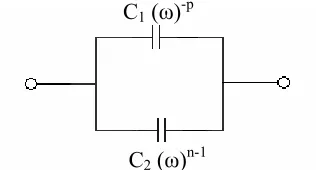
complex capacitance (C’,C”) plotting with the variation of frequency for the El1 sample. In the same Figure, C’ fit and C” fit was plotted for fitting the experiment data based on the equivalent circuit being construct using the concept of universal capacitance as shown by Figure 7. The circuit model consist two element of a quasi-dc mechanism, C1 (ω)-p and C2 (ω)n-1 capacitor in parallel. The mathematical expression from the quasi-dc behavior
is given by following equation [11]:
C1 = C1 (iω)-p ω<< ωc (5)
=
(
)
(
)
(
cos
π
/
2
sin
π
/
2
)
ω
ω
p
j
p
f
C
pc
c
×
−−
C2 = C2 (iω)n-1 ω>>ωc (6)
=
(
)
(
)
1(
sin
π
/
2
cos
π
/
2
)
ω
ω
n
j
n
f
C
nc
c
×
−
−
The parameter n is the measure of the degree of correlation within the cluster and parameter p is the perfection of transport of the effective charge displacement by means of the irregular array [10]. The frequency, fc in this
case defines the rate at which charges escape from one cluster and transfer to another via the weakly conducting bonds and ωc is the frequency rate at which the C’ and the C” was intercept.
1.0E-14 1.0E-13 1.0E-12 1.0E-11 1.0E-10 1.0E-09 1.0E-08 1.0E-07
1.0E+01 1.0E+02 1.0E+03 1.0E+04 1.0E+05 1.0E+06 1.0E+07 c1'
[image:6.612.134.446.337.509.2]c1" c1'fit c1"fit
[image:6.612.228.386.557.642.2]Figure 6: Complex Capacitance versus Frequency for Thick Film Sample
Figure 7: The Circuit Model Represent the Response Mechanism of BaTiO3 Sample.
The value of parameter n and p at the circuit model were determined based on the fitted graph of C’fit and C”fit using the Eq.5 and 6 respectively. The value of p is 0.86 and the value of n is 0.08. It can be observed that the value of p obtained at low frequency close to unity, suggested that the material showed dc conductivity [11]. This mechanism is due to the charge transport between the clusters [10]. The transition frequency fc, is 3980 Hz
C
2(
ω
)
n-1C
1(
ω
)
-pFrequency (Hz)
Capacitance C’, C” (F)
the capacitance value at the transition frequency, C(fc) is 1.33x10⁻¹¹ Farad. Both low and high frequency follow
the universal response, but with much smaller of the exponent of n observed.
Electrical Resistivity
Electrical resistivity is a measure of how strong a particular material opposes the flow of electric current. A high resistivity is an important characteristic for insulating materials, while low resistivity is an important characteristic for conducting material. The SI unit for electrical resistivity is ohm meter (Ωm). The electrical resistivity,
ρ
, of dielectric layer on the interdigitated electrode can be defined asl
A
R
=
ρ
(7)where ρ is electrical resistivity, R is a resistance of the test material, A is total area of opposed electrode, and l is gap between two electrode [1]. The area (A) and the length gap (l) of electrode in each samples were determined from the design mesh, while the resistance (R) value was determined from IV curve measured using Keithly 4200-SCS. Figure 8shows the current versus voltage (IV curve) for sample El1, El2 and El3.
0.0E+00 1.0E-07 2.0E-07 3.0E-07 4.0E-07 5.0E-07
0 2 4 6 8 10 12
[image:7.612.160.451.271.450.2]El 1 El 2 El 3
Figure 8: Current versus Voltage for Sample El1, El2 and El3
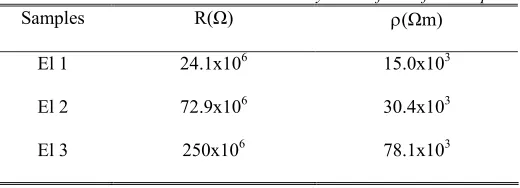
The IV curve for all samples showed a good linearity between current and voltage ranging from 0 to 10 volt. Using the Eq.7, the electrical resistivity, ρ and material resistance, R for each sample were calculated and listed in Table 3.
Table 3: Resistance and electrical resistivity value of thick film samples
Samples R(Ω) ρ(Ωm)
El 1 24.1x10⁶ 15.0x10³
El 2 72.9x10⁶ 30.4x10³
El 3 250x106 78.1x10³
From Table 3, the El 3 sample shows the highest resistance and highest electrical resistivity followed by samples El2 and El1. The highest resistance value was observed in sample El 3 due to the biggest gap between two conducting electrode. Generally, the resistance of the test material is proportional to the length gap of interdigitated electrode as given by Eq.7. As the gap between two conductor increases, the resistance will increase and this is justify with the result obtain as shown by Figure 8.
Current (A)
[image:7.612.173.433.524.618.2]CONCLUSION
In this works, the reliable pastes for dielectric material were successful prepared by mixing the BaTiO3 powder
to organic vehicle in ratio of 70:30. The organic vehicles were form by terpineol solvent and ethyl cellulose resins in ratio of 12:1. The pastes were screen printed on the ceramic substrate have show a good printing quality and has been characterized based on different gap of interdigitated electrode pattern. The measurement results show that the smaller gap between intedigitated electrodes gives higher capacitance value and higher dielectric losses compared to the bigger gap. Based on quasi-dc mechanism, the equivalent circuit for the BaTiO3 thick film was constructed to represent the dielectric behavior of the film with electric field. The dc
resistivity of the material gives ohmic response with the bigger gap of interdigitated electrode show a higher resistance compared to the smaller gap. As a conclusion, the electrical properties of BaTiO3 layer are affected by
the gap of the intedigitated electrode pattern and the design electrode parameter should be optimize when sensitivity issue are important such in thick film sensor fabrication.
REFERENCE
[1] M.prudenziati, “Thick Film Sensors”, Handbook of sensors and actuators, Volume 1, 1994.
[2] Rahman Wagiran, Abdul Rahman Ramli and Burhanudin Yeop Majlis, “Design and Fabrication Technique of Thick Film Circuits”, UPM.
[3] B.D. Stojanovic, C.R. Foschini, V.B. Pavlovic, V.M. Pavlovic, V. Pejovic, J.A. Varela, Barium titanate screen-printed thick, Ceramics International 28, pp.293–298 (2002).
[4] K. Arshaka, K. Twomey, D. Egan, “A ceramic thick film humidity sensor based on MnZn Ferrite”, Sensors, 2002.
[5] N. Jayadev Dayan, S.R. Sainkar, R.N. Karekar, R.C. Aiyer, “Formulation and characterization of ZnO:Sb thick-film gas sensors”, Thin Solid Films 325 pp.254–258 (1998).
[6] Z.M. Rittersma, “ Recent achievement in miniaturized humidity sensor-a review oftransduction techniques”,
Sensor and Actuator A 96 pp.196-210 (2002).
[7] Wenmin Qu, Jorg-Uwe Meyer, “A Novel thick-film ceramic humidity sensor”, Sensor and Actuator B (40), pp. 175-182 (1997).
[8] M. Viviani, M.T. Buscaglia, V. Buscaglia, M. Leoni, P. Nanni, “Barium perovskites as humidity sensing materials”, Journal of the European Ceramic Society 21, pp. 1981–1984 (2001).
[9] Niepce JC. About the mechanism of the solid-way synthesis of barium metatitanate: industrial consequences. Solid State lonics43, pp. 69-76 (1990).
[10] Iftetan, AT. Structural and dielectric properties of substituted stannate compounds. Phd. Thesis. Universiti Putra Malaysia.2003.