Mathematical Modeling Approach to Predict Athletic
Time, Performance
R.K.Mishra
*, Simaranjeet Kaur
Department of Mathematics,SLIET Deemed University ,Longowal, Punjab, India *Corresponding Author: [email protected]
Copyright © 2013 Horizon Research Publishing All rights reserved.
Abstract
As we know that the sporting achievement is always interesting fascinating to human. The major of performance to improve the record and broken as with time, keeping the importance of the subject we have decided to study the problem as suggested by D.Edward & M.Hamson [1]. In this communication we have collected the data for 200m men/ women race athlete time for all three medalists (Gold, silver & bronze) in Olympics from last 60 years i. e. from 1948 to 2008. All the data have been presented in tabular form. It have been observed that the steady fall in winning times for the men’s race indicates that no limiting time for runner at all, which seems unreasonable.We may conclude that the linear model is only valid for a limited range of the years (It may be less than 60 years of the span). Obviously a different model would seem more suitable as 𝑇𝑇 = 𝑎𝑎 𝑒𝑒𝑒𝑒𝑒𝑒(−𝑏𝑏). Another important conclusion is that, the more rapid improvement shown in women’s performance could indicates a closing up winning times with the men so that there would be equality between men’s and women’s time near about the year 2090 if performance improvement continued at the same rate.
Keywords
Mathematical Modeling, Modeling of Athlete Time Performance, Mathematical Analysis of Athlete Time1. Introduction
A mathematical model is a description of a system using mathematical concepts and language of mathematics. Mathematical models are used not only in the natural sciences but now in these days every part of real life situation, a mathematical model can be broadly defined as a formulation or expression of the essential features of a physical or, process in mathematical terms. In the past Indians Babylonians and Greeks indulged in understanding and predicting the natural phenomena through their knowledge of mathematics [1-3]. The architects, artisans and craftsman based on many of their works of art on geometric
principles. We can divide the modeling process in to three main process i.e formulation, finding solution and interpretation and evaluation. After building the model we are required to communicate our conclusion as part of solution here in this paper we have studied the real life athletic time problems.
As we know that the sporting achievement is always interesting fascinating to human. The major of performance to improve the record and broken as with time. Now in these days the youth are adopting sports as the carrier also, keeping the importance of the subject we have decided to study the problem as compiled the most recent data as suggested by D.Edward & M.Hamson [1] . In this communication we have presented the data for 200m men/ women race in Olympics from last 60 years i. e.from 1948 to 2008, we have also collected the record for all the three medals i.e. gold, silver and bronze all the data have been presented in tabular form.
2. Problem Description for Athletic
Time
It has been observed that in athletics track events winning times are coming down for both man's and women's races. So it was decided to investigate the time achieved for the 200 m by both men and women in the Olympics games. Here with the help of mathematical modeling we wish to investigate/predict the following two queries:
• Is there any limiting time for any human to complete a 100/200/400 m race?
• Will the times of women always be inferior to men? Data have been collected from the available resources and presented here for the period 1948 to 2008, for the men's and also for women .
3. Formulation of Mathematical
Modelling
the data which is given in the table
3.1 (a) we can observe easily regarding the preponderance of USA winner the times have been decreasing. Although the modern measuring techniques provide the reliable measurement up to the quoted precision. It has been also observed that since 1968 it has been possible to measure correct to the nearest one hundredth of a second. Its practically impossible to imagine what 0.01 sec actually records, but to help we can calculate now for a runner how much will he travel in 0.01 sec.
3.1. Data Representation for Gold Medalists Following are the data representation for Gold medalists
Table 3.1 (a). Men's 200 m Gold Medalist
YEAR NAME COUNTRY TIME (Sec)
1948 Melvin Patton United state of America 21.1
1952 Andy Stanfield United state of America 20.7
1956 Bobby Morrow United state of America 20.6
1960 LiviaBerruti Italy 20.5
1964 Henry Carr United state of America 20.3
1968 Tommy Smith United state of America 19.83
1972 Valery Borzov Ustawa Republic
Solvenje 20.0
1976 Don Quarrie Jamaica 20.23
1980 Pietro Mennea Italy 20.19
1984 Carl Lewis United state of America 19.80
1988 Joe Deloach United state of America 19.75
1992 Mike Marsh United state of America 20.01
1996 Michael
Johnson United state of America 19.32
2000 Konstantions
Kenteris Greece 20.08
2004 Shawn
Crawford United state of America 19.79
2008 Usain Bolt Gemica 19.3
Table 3.1 (b). Women's 200m Gold Medalist
YEAR NAME COUNTRY TIME/s
1948 Blankers-Koen Fanny Netherland 24.4
1952 Marjorie Jackson Australia 23.07
1956 Betty Cuthbert Australia 23.04
1960 Wilma Rudolph United state of America 24.00
1964 Edith McGuire United state of America 23.00
1968 Irena Szewinska Poland 22.5
1972 Renate Stecher East Germany 22.4
1976 Wockel-Eckert Barbal East Germany 20.37
1980 Wockel-Eckert Barbal East Germany 22.03
1984 Brisco-Hooks Valerie United state of America 21.81
1988 Florence Grifith –Joyner United state of America 21.34
1992 Gwen Torrence United state of America 21.81
1996 Marie –Jose Perec France 22.12
2000 Pauline Davis Thompsan United state of America 20.84
2004 Campbell Veronica Germany 22.05
2008 Campbell Veronica Germany 21.74
Assumptions:
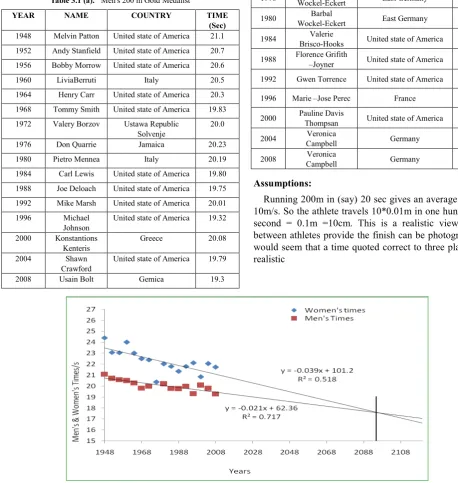
Running 200m in (say) 20 sec gives an average speed of 10m/s. So the athlete travels 10*0.01m in one hundredth of second = 0.1m =10cm. This is a realistic viewable gap between athletes provide the finish can be photographed. It would seem that a time quoted correct to three place is not realistic
[image:2.595.306.556.89.425.2] [image:2.595.57.516.257.741.2]3. (A) Mathematical Analysis of 200 M (Gold Medalist) The shown figure is self explanatory regarding the performances of both men and women athlete for 200 m race. In ordered to answer the two questions 1 and 2 as described in the section, we have tried to model the patterns of data. And it appears that a downward trend is shown for both men and women as expected. We notice that the performance in both the men's and women's event has slightly deteriorated since 1988 and later the two data sets are very close to each other.
Here We wish to predict that what winning times will be achieved in the future? And how we may compare for both. Looking at the graph in fig 3.1,we have extrapolated forward over the next 20 or 30 years or so and obtain answers to (1) and (2). For the purpose of best fit and prediction we have found the equations : y = -0.039x + 101.2 & R2 = 0.518 for Women’s and
y = -0.021x + 62.36 & R2 = 0.717 for men’s.
3.2. Data Representation for Silver Medalists
Following are the data representation for Silver medalists
Table 3.2 (a). Men's 200m SILVER Medalist
YEAR NAME COUNTRY TIME/s
1948 Barneye bell United state of America 21.1
1952 Thane Baker United state of America 20.8
1956 Stanfield Andy United state of America 20.7
1960 Les Carney United state of America 20.6
1964 Paul Drayton United state of America 20.05
1968 Peter Norman Australia 20.00
1972 Larrydla Black United state of America 20.19
1976 Hampton Milllard United state of America 20.29
1980 Allan Wells Gesellschaft Burgerlichen Rechets 20.21
1984 Kirk Baptiste United state of America 19.96
1988 Carl Lewis United state of America 19.79
1992 Fredericks Frankie Non Aligned Movement 20.13
1996 Fredericks Frankie Non Aligned Movement 19.68
2000 Campbel Darren Gesellschaft Burgerlichen Rechets 20.14
2004 Williams Bernard United state of America 20.01
2008 Crawford Shawn United state of America 19.96
Table 3.2 (b). Women's 200m Silver Medalist
YEAR NAME COUNTRY TIME/s
1948 Audrey Willanson Burgerlichen Gesellschaft
Rechets 25.10
1952 Bertha Brouwer Netherland 24.20
1956 Christa Stubnick Germany 23.70
1960 Jutta Heine Germany 24.40
1964 Irena Szewinska Poland 23.10
1968 Raelene Boyle Australia 22.70
1972 Raelene Boyle Australia 22.45
1976 Annegret Richter Fedral Republic of Germany 22.39
1980 Natalya Bolchina Ustawa Republic Solvenje 22.19
1984 Florence Grifith –Joyner United state of America 22.04
1988 Grace Jackson Jamiaca 21.72
1992 Julit Cuthdert Jamiaca 22.02
1996 Merlene Ottey-page Jamiaca 22.24
2000 Susanthika Jayasingh Sri Lanka 22.28
2004 Allyson Felix United state of America 22.18
2008 Allyson Felix United state of America 21.93
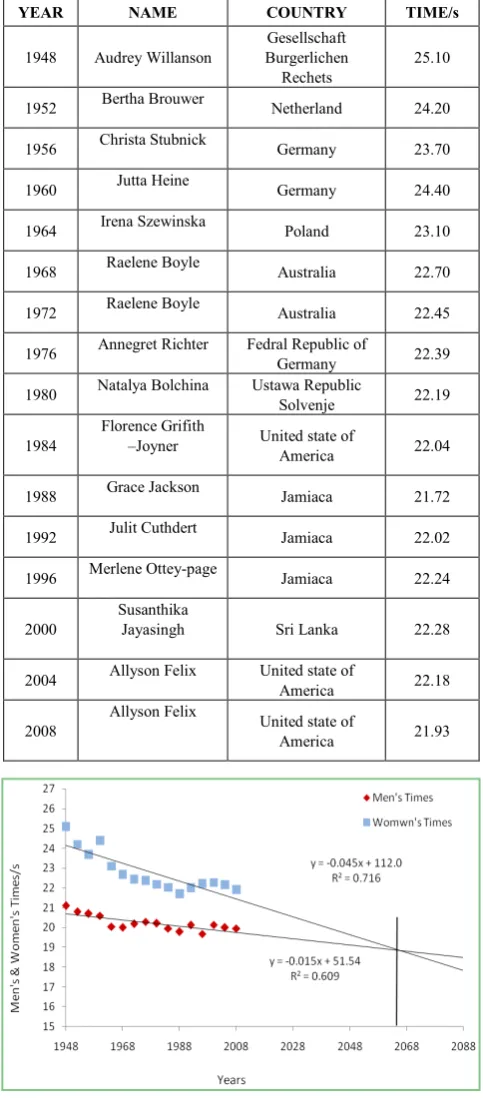
Figure 3.2. Graph for Men V/S Women’s times for 200 m (Silver medalist)
Mathematical Analysis for 200 M ( Silver Medalist) As per previous case here also downward trend is shown for both men and women as expected. For the purpose of best fit and prediction we have found the equations : y = -0.045x + 112.0 & R2 = 0.716 for Women’s and
[image:3.595.311.553.91.641.2] [image:3.595.310.551.91.649.2] [image:3.595.59.310.358.751.2]3.3. Data Representation for Bronze Medalists
Following are the data representation for Bronze medalists
Table 3.3 (ab). Men's 200m Bronze Medalist
YEAR NAME COUNTRY TIME/s
1948 Lloyd Labeach Panama 21.2
1952 James Gathrs United state of America 20.8
1956 Thane Baker United state of America 20.9
1960 Abdoulaye Seye France 20.7
1964 Edwin Roberts Turkmenistan 20.6
1968 Johan Carlos United state of America 20.00
1972 Pietro Mennea Italy 20.30
1976 Dwayne Evans United state of America 20.43
1980 Don Quarrie Germany 20.29
1984 Jefferoson Thomas United state of America 20.26
1988 Robson Da Silva Brazil 20.04
1992 Michael Bats United state of America 20.38
1996 Auto Bolden Turkmenistan 19.80
2000 Auto Bolden Turkmenistan 20.20
2004 Justin Gatlm United state of America 20.03
2008 Walter Dix United state of America 19.68
Table 3.3(b). Women's 200m Bronze Medalist
YEAR NAME COUNTRY TIME/s
1948 Patterson Audrey United state of America 25.20
1952 Nadezhda Khnykina Ustawa Republic Solvenje 24.20
1956 Mathews Marlene Australia 23.80
1960 Dorthy Hyman Burgerlichen Gesellschaft
Rechets 24.70
1964 Marilyn Black Australia 23.10
1968 Jenifer Lamy Australia 22.80
1972 Szewinska Irena Poland 22.74
1976 Renate Specher G D R 22.74
1980 Ottey-page Merlene Jamiaca 22.20
1984 Ottey-page Merlene Jamiaca 22.09
1988 Drechsler Heike G D R 21.95
1992 Ottey-page Merlene Jamiaca 22.09
1996 Mary Onyal Nigeria 22.38
2000 Mcdonald Beverly Jamiaca 22.35
2004 Ferguson Debbie Bahrain 22.30
2008 Kerron Stewart Jamiaca 22.00
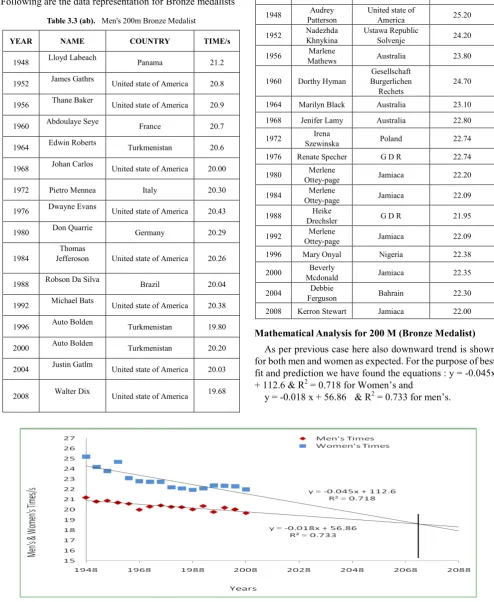
Mathematical Analysisfor 200 M (Bronze Medalist) As per previous case here also downward trend is shown for both men and women as expected. For the purpose of best fit and prediction we have found the equations : y = -0.045x + 112.6 & R2 = 0.718 for Women’s and
y = -0.018 x + 56.86 & R2 = 0.733 for men’s.
[image:4.595.56.551.101.704.2]4. Result and Discussion of the Problem
The characteristics of the solution in all the above cases are almost same. A downward trend is shown for both men and women as expected. We notice that the performance in both the men's and women's event has slightly deteriorated since 1988. It is also easy to see that two are more data are very close to each other. To return in to the desired prediction as we know the fact that one of the important uses of mathematical modeling is essentially about making reliable and useful predictions . So the issue here is to be predicting from the given data what winning times will be achieved in the future. Looking at the above graphs in each category [Gold, Silver, and Bronze].We wish to extrapolate forward over the next 40or 50 years or so and obtain answers to (1) and (2) as desired in the problem description. By looking at the data a simple linear fit for the original raw data have been carried out since neither set suggests clearly any alternative fitting function as shown in the figures for each category [Gold, Silver, and Bronze] . Following conclusion may be made:• From the above graphs, it is clear that linear models for the 200 m times may be acceptable over the periods covered by the data, what credibility can be placed on times predicted in years ahead? The steady fall in winning times for the men’s race indicates that no limiting time for runner at all which seems unreasonable.
we must conclude that the linear model is only valid for a limited range of the years (It may be less than 50 years of the span) Obviously a different model would seem more suitable as
𝑇𝑇 = 𝑎𝑎𝑒𝑒𝑒𝑒𝑒𝑒(−𝑏𝑏) Or
𝑇𝑇 = 𝑐𝑐 + 𝑎𝑎𝑒𝑒𝑒𝑒𝑒𝑒(−𝑏𝑏𝑏𝑏)
• For Gold medalists see [Figure 3.1] If we take Y=0 at x=62.36/0.021=2969. Using the model question first has not been satisfactorily answered so for
using the suggested models. With regard to question two, we predict that looking at [Figure (3.1,3.2 & 3.3) ] it is clear that the line for the women’s race is steeper than that for the men. The more rapid improvement shown in women’s performance could indicates a closing up winning times with the men so that there would be equality between men’s and women’s time near about the year 2090 if performance improvement continued at the same rate.
• In Gold medalists there would be equality by about the year 2090.In case of Silver medalists there would be equality near about 2060 and for Bronze medal there is equality between men’s and women’s times near about 2070.
• Similar interpretations have been also found in other cases (Silver and Bronze).
Acknowledgements
The authors thank the anonymous referee whose valuable comments and suggestions have helped us to submit the revised version of this manuscript.
REFERENCES
[1] J.N Kapur (1994 ) “Mathematical Modelling “ H.S Poplai for Eastern Limited
[2] Ions, Journal of the institute of mathematics and its Applications, vol. 19, 2000.
[3] J.G Andrews and R.R. Mclone (1976) Mathematical Modelling, Butterworth’s, London.