Tracking the PhD Students’ Daily Computer Use
Kwong Nui Sim
1,*, Jacques van der Meer
21Higher Education Development Centre, University of Otago, New Zealand 2College of Education, University of Otago, New Zealand
Copyright © 2015 Horizon Research Publishing All rights reserved.
Abstract
This study investigated PhD students’ computer activities in their daily research practice. Software that tracks computer usage (Manic Time) was installed on the computers of nine PhD students, who were at their early, mid and final stage in doing their doctoral research in four different discipline areas (Commerce, Humanities, Health Sciences and Sciences) at the University of Otago in 2013. These students self-reported as being skilled computer users. Analysis of the data revealed no significant difference in computer use within this cohort of students despite the stage of their PhD and discipline backgrounds. The findings suggest that these PhD students seemed to regard their doctoral research as a full time job but they generally only engaged with basic built-in software applications in their daily research practice.Keywords Actual Practice, E-Learning, Higher Education, Self-report of Practice, Student Learning, Student Study Habits, Monitoring Software
1. Introduction
Our interest was to examine the applications being used by PhD students and the degree (in terms of duration) to which they used their computers to support their daily research practice. Undoubtedly, most PhD students use various computer technologies throughout their research for both generic and specialised purposes, including processes related to the preparation, fieldwork, analysis and write-up phases of their studies. With a high proportion of postgraduate students at the university where this study took place owning computer devices and having access to broadband, we were curious to know how students were actually using them to support their doctoral research.
For too long students’ actual use of computer technology in higher education, especially among the PhD students, has been left unexamined. Much of the discussion about technologies in higher education proceeds from interlocking sets of assumptions (1-3) that doctoral students have access to quality computer devices and can use these devices at a high-level of competency.
This Study
A search of recent publications reveals that most empirical research on postgraduate students’ use of computer technologies has been focused on their e-Literacy (4), communication (5), entertainment use (6), the use of learning management systems (7), library use (8) and knowledge consumption (9). These studies have highlighted a range of aspects including skills in computer use, the variety of ways different technologies have been used for academic practices and students’ self-confidence in the use of technologies. Where the role of PhD students’ use of ICT to support their research processes is concerned, the place of ICT in the research practices and research activities of these students is often limited in the literature. For example, it is not surprising that graduate students are described as “binge” users of e-journals and as having a preference for electronic resources (10-14) during their dissertation writing process. It is also acknowledged that all PhD students will be using computers for their process of doing doctoral research. Depending on the field, major or research theme, some will use software such as SPSS for NVivo for data analysis. Some will use software designed specifically for work in their field of study. Most, if not all, will use widespread applications that facilitate searching references and typing and archiving documents. What is important is that the nature of PhD students use of ICT for the integrated tasks involved in their study, including background research, conducting the research, writing the thesis, and for all other aspects of each of the research phases, is unclear in current literature. In other words, current studies do not offer a clear picture of how PhD students integrate computer technologies into their daily research practices but only report what students use computer technologies for. In order to address the limited explanations of the how, this study captured the ways computer technologies were used by a cohort of PhD student participants in their daily research practices, in a particular context.
resources during their postgraduate study (16). However, the results in some studies suggested that postgraduate students are not even competent at using Office applications such as Excel, Power Point and Access (10). There is also a report stating that students had high levels of ownership of application types they did not frequently use (15). One of the reasons these studies raise different scenarios of postgraduate students’ use of ICT could be that these studies on student use of computers in higher education rely on perception data, often gathered via surveys and questionnaires. Thus, none of these studies can make a claim to knowing what students actually do in practice. This prompted Divaris, Polychronopoulou and Mattheos to state that the “first necessary step of this process is an accurate and realistic assessment of the actual computer skills of the student” (18); while according to Conole, de Laat, Dillon and DeCicco, “more in-depth research is needed to understand the nuances of how students are using technologies to support their learning” (19).
Therefore, we are interested in the extent to which students actually use computer technologies in their daily research practices. The primary endeavour in this investigation was to focus on usage by capturing computer activity generated as it occurred. This required us to locate the data collection as close as possible to the students’ daily academic practices. Naturally occurring computer activities were extracted from the students’ computers (computer activity data) through installing usage monitoring software (Manic Time - http://www.manictime.com/) that tracked date, time and duration of predefined aspects of use (applications and web sites). This paper reports on the analysis of a subset of data of a larger project, that is, on data gathered about computer activities captured using a software programme, ManicTime. It is recognised that, because this was the first set of the findings in a larger project, the investigation raised many questions that still need to be explored. This will be discussed later in this article.
2. Method
A description and an invitation were sent via an email through Graduate Research School, Graduate Residential College, and Division of Humanities as well as via a Facebook post on the private Postgraduate Community Group Page (Otago University Postgraduate Society). Thirty students who replied and showed their interest were invited to undertake a short questionnaire. Participants were selected through an initial self-report questionnaire that aimed to ascertain students’ self-perceptions of their degree of computer use. Nine students who self-reported as skilled computer users and who reflected a balanced distribution of PhD research stages as well as discipline backgrounds, were invited to participate in the study.
Approval was then gained from the participants about the installation of the ManicTime software on their computers to capture their computer activities on programmes used and websites visited, as well as documents accessed, at what
dates, times and for length of use of each, over six months (4368 hours). ManicTime, is known as “Personal time management software for logging and tracking work hours” (20). This software resides in the background of the computer’s operating system, thereby reducing its intrusion on users’ normal computer use. The core benefit of using ManicTime for this study was its function as a personal time-tracking tool, thus providing monitoring at a rudimentary level. ManicTime tracks the software programmes that are being used, the websites visited (through capturing the Uniform Resource Locators - URLs) and the documents that are accessed (e.g., “Discussion_Chapter.doc”).
All the participants were invited to attend a briefing session where the software was explained and training was given on some software functions. These functions included the ability to turn the software on and off as well as to delete any record. The purpose of offering participants these functions was to reduce any anxiety related to ‘being watched’ and allowing students to delete any possibly embarrassing data. All those who were invited, attended the briefing session. The software captured the programmes and web services that students were using on a regular basis. The information was calculated ‘on the fly’ and available for viewing by participants by clicking on an icon on the task bar.
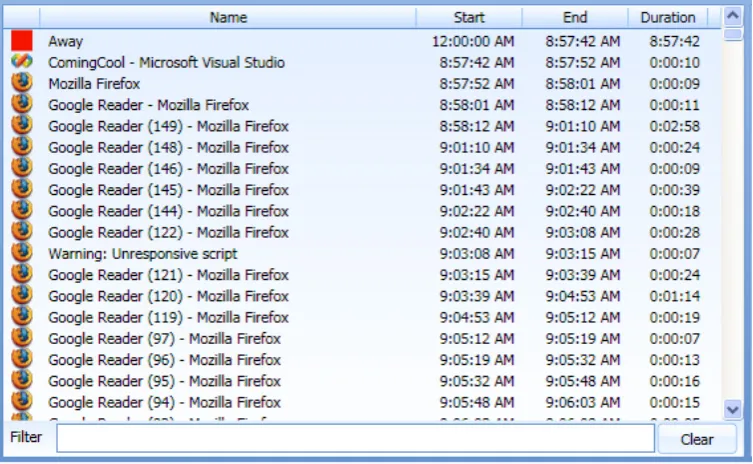
ManicTime is a detailed computer activity tracking application. At the click of an icon situated in the task bar, live data is presented in both tabular and graphical forms. These displays include the top applications used, top documents accessed, and computer usage within a certain duration. An example of the displays is shown in Figure 1.
The idea of gathering data at the source of when it occurred was seen as an appropriate method of identifying application types used and students’ computer technology engagement in daily research practice over half a year period of duration. In this way, we were able to focus on the extent to which software applications and web services were used to support doctoral research practice with computers, and time use patterns.
At the same time, it records the duration of time the students engaged in these activities. The data gathered in this way was not reliant on the students keeping records and thus yielded more reliable information than could be gained from asking students about their computer usage.
Figure 1. The starting and the ending time of each computer activity is recorded(20)
3. Findings
Participants [image:3.595.312.553.362.577.2]The nine participants represented a balanced distribution of discipline backgrounds (Question 1 in the questionnaire) as well as PhD research stages (Question 2 in the questionnaire). Where PhD stages are concerned, ‘Early’ refers to a student who is in the broadly described preparation phase, ‘Mid’ refers to a student who is in the progress of collecting and/or analysing the data for their research, while ‘Final’ refers to a student who may be in the process of writing up their dissertation and nearing the time of submission of their work for examinations. The summary of the distribution of participants in this study is presented in the table below.
Table 1. Distribution of participants
Participants
Distribution Discipline
Backgrounds PhD Research Stages
1 Science Mid
2 Humanities Final
3 Science Early
4 Humanities Final
5 Commerce Early
6 Health Sciences Final
7 Health Sciences Early
8 Commerce Mid
9 Commerce Mid
In the aforementioned initial self-report questionnaire, students were asked how they use their computers for their research work. Table 2 below shows the participants’ self-perception of their computer use expressed in percentages of their total time use.
Table 2. Participants’ self-perception measure of their computer use
Participants Percentage (%)
Task 1 Task 2 Task 3
1 Preparation (10%) Data Collection (45%) Data Analysis (45%)
2 Preparation (50%) Data Collection (50%)
3 Write Up (100%)
4 Write Up (100%)
5 Preparation (100%)
6 Preparation (100%)
7 Preparation (70%) Data Collection (30%)
8 Collection Data Data Analysis (20%) Write Up (70%)
9 Preparation (50%) Data Analysis (50%)
Two of the nine participants felt they had a balanced computer use for their tasks related to their research work (Participants-2 and 9); four of them claimed they used their computers for single tasks related to their research work (Participants-3, 4, 5 and 6), with the other three stating they were more likely to use their computer for one or the other tasks related to their research work in their current PhD research stage (Participants-1, 7 and 8).
[image:3.595.61.295.533.696.2]Figure 2. Generation of categories from the computer activities
Computer Activity Data
The analysis started with the main computer use derived from Top Fifty Applications: client-side software programmes (i.e., Microsoft Word or Window Media Player) and browser-based services (e.g., Wikipedia or Facebook), subcategorised by participants’ discipline backgrounds and PhD research stages (see Figure 2).
The computer activities revealed that the use of client-side applications was considerably higher than browser-based applications (average = 89.40%). The top three client-side applications were categorised as Operating software-related services (average = 42.7%), Microsoft Office (average = 9.5%) and Entertainment applications (average = 8.9%). The Operating software-related services included the use of Windows Explorer, the use of memory stick(s) or the use of hard drive(s) whereas the Entertainment consisted of
Window Media Player, iTunes or other audio and video
applications. Browser-based applications were categorised as Web-browser services (average = 52.8%), Email (average = 22.2%) and Communication (average = 13.9%). Web-browser services comprised Internet Explorer, FireFox
and Chrome while Communication involved Skype, Weibo
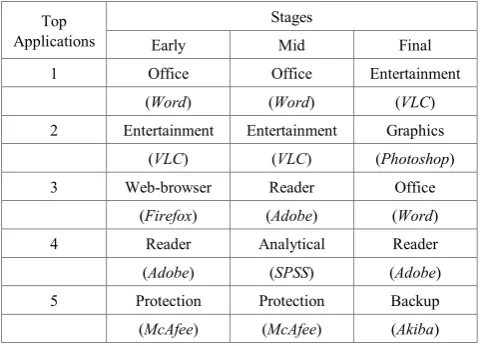
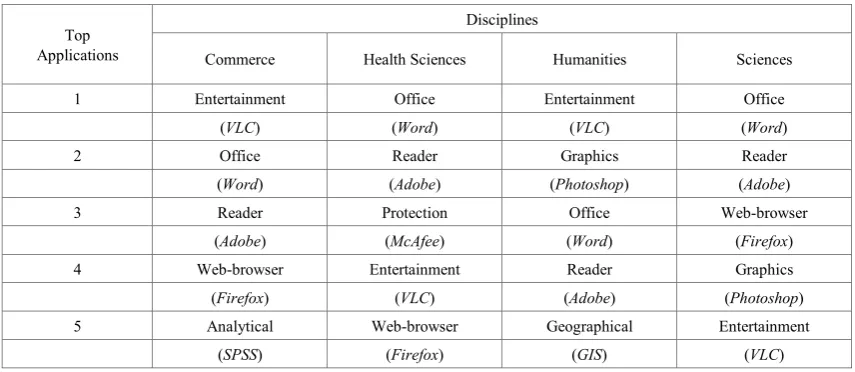
and other means of audio or video communicating channels. At the level of application use (irrespective of client-side or browser-based), however, computer activity data revealed similarities as well as the differences of frequency and popularity of the application use among the participants depending on the stage of their PhD progress as well as across the different disciplines. Table 3 below shows the top five applications used by the participants at different PhD stages and Table 4 presents the top five applications used by the participants across four different disciplines.
These findings highlight the discrepancy between participants’ self-perception responses (Table 3) and computer activity data (Table 4). Discrepancies were found for example, in the data related to participants in their final PhD stage (participants-3, 4 & 8). They reported that they were either fully focussed on writing up their thesis (100%) or had a higher computer technology usage for their writing
(70%). The actual practice (computer activities), however, revealed the opposite. The top two applications used by the participants in their final stage, namely Entertainment and Graphics were less related to their writing up task. When checking with the participants regarding the high use of graphic and entertainment software, it was found that Graphic software (i.e., Adobe Photoshop and Picasa) is generally used for manipulating images and Entertainment applications (e.g., VLC Media Player and Spotify) is broadly used for providing audio and/or visual enjoyment.
Table 3. The top five applications (with examples) used by the participants at different PhD stages
Top Applications
Stages
Early Mid Final
1 Office Office Entertainment
(Word) (Word) (VLC)
2 Entertainment Entertainment Graphics
(VLC) (VLC) (Photoshop)
3 Web-browser Reader Office
(Firefox) (Adobe) (Word)
4 Reader Analytical Reader
(Adobe) (SPSS) (Adobe)
5 Protection Protection Backup
(McAfee) (McAfee) (Akiba)
[image:4.595.312.553.426.599.2]Table 4. The top five applications (with examples) used by the participants in different disciplines
Top Applications
Disciplines
Commerce Health Sciences Humanities Sciences
1 Entertainment Office Entertainment Office
(VLC) (Word) (VLC) (Word)
2 Office Reader Graphics Reader
(Word) (Adobe) (Photoshop) (Adobe)
3 Reader Protection Office Web-browser
(Adobe) (McAfee) (Word) (Firefox)
4 Web-browser Entertainment Reader Graphics
(Firefox) (VLC) (Adobe) (Photoshop)
5 Analytical Web-browser Geographical Entertainment
(SPSS) (Firefox) (GIS) (VLC)
[image:5.595.58.299.350.507.2]Apart from the top applications, the daily computer use of the participants, in hours, was also recorded. Table 5 shows the participants’ average daily computer use over the six-month period.
Table 5. Participants’ Daily Computer Activities (in hours) Participants
Top Applications Daily Computer Activities (Hours)
1 7.70
2 4.01
3 9.64
4 12.41
5 6.74
6 6.45
7 6.16
8 8.54
9 7.80
Mean 8.04
As shown in Table 5, the average time the participants spent on their computers was approximately eight hours each day regardless of their PhD stages and discipline backgrounds.
[image:5.595.311.553.425.610.2]Table 6 below displays the daily starting hour of the participants’ computer activities across their PhD stages. The starting hour of a day was divided into four categories: Early Starters (12:01am – 7:59am), Regular Starters (8am – 10:30am), Late Starters (10:31am – 11:59am) and Very Late Starters (12pm – 12am).
Table 6. Participants’ Daily Starting Hours according to their PhD Stages Division Starting
Time of the Day Early Stage Mid Stage Final Stage Early Starters
(1201–0759 am) 22.2% 7.1% 70.7%
Regular Starters
(0800–1030 am) 21.6% 51.2% 27.2%
Late Starters
(1031–1159am) 43.4% 23.5% 33.1%
Very Late Starters
(1200pm–1200am) 41.1% 22.7% 36.2%
As indicated in this table, the participants’ daily starting hours demonstrated a pattern across their PhD stages in general. The participants in this study who were in their early stage tended to start their day late but the participants in their last PhD stage began their day early.
Table 7 below shows participants’ daily starting hours across discipline backgrounds. It shows that a majority of the participants across disciplines could be categorised as ‘regular’ starters.
Table 7. Participants’ Daily Starting Hours according to their Discipline Backgrounds
Division Starting
Time of the Day
Health
Sciences Humanities Sciences Commerce
Early Starters (1201–0759
am) 17.6% 29.4% 3.1% 0.7%
Regular Starters (0800–1030
am)
28.3% 26.7% 45.4% 59.3%
Late Starters (1031–1159
am) 20.5% 23.0% 46.4% 25.0%
Very Late Starters (1200pm–
1200 am)
33.7% 20.9% 5.1% 15.0%
In summary, the computer activity data revealed:
1. a similar usage of the top-ranked client-side software programmes (Office and Entertainment) among the participants regardless of their PhD stages and discipline backgrounds;
2. a similar usage pattern of daily computer activities hours among the participants (average of eight hours for each participant) regardless of their PhD stages and discipline backgrounds;
[image:5.595.59.299.654.757.2]4. Discussion
Overall, the extent to which students reported on their computer use (via the recruitment questionnaire and then the discussion sessions) was somewhat different from the recorded actual use (computer activity capture). The degree to which this cohort of PhD students utilised their computers for their doctoral research purposes and the extent to which computer use had been adopted for their daily research practices was limited and low. There was also no obvious relationship found when comparing daily computer use hours among these students. In addition, these students’ daily starting hours on their computer was found to be similar as well.
While this may seem a rather unassuming project at the outset, we believe that there is some value in establishing actual findings about the extent and range of computer use by doctoral research students. Much of the literature related to the use of computer technology in supporting learning in higher education is based on perception data and/or post-event recollections of behaviour. It bothered us that many of the claims concerning behaviour were based on these post-event recollections. It was particularly disconcerting to notice how authors, often uncritically moved to asserting findings as if they represented actual behaviour. We argue that post-event recollections and perceptions are not always a valid way to represent actual behaviour. For this reason, we investigated a range of possible ways to gather naturally occurring data. The ability to track computer use as it happened seemed the most obvious. Tracking students’ actual computer use in this way offered us an opportunity to compare actual computer usage data with students’ perceptions. The difference we found between participants’ perceptions of practice compared with usage data from computer activities data highlights the risk of using self-reports to draw conclusions about computer use.
Regarding students’ use of their computers, greater similarities of computer activities among this small cohort of students were found than we anticipated, despite their PhD stages and discipline backgrounds. Other than the use of Office, Entertainment and Reader, participants did not use many specific software programmes that reflected their PhD stages and/or discipline backgrounds. We had assumed, given the self-reported high level of confidence of this cohort with computer technology and their academically advanced stage, that there would be a pattern of computer activities that went along with that stage and/or discipline backgrounds. However, this was not the case with the expected research orientated client-side applications, such as referencing tools (i.e., Endnote) and note-taking software (e.g., OneNote), which were noticeably absent from the captured top five computer uses. It seemed reasonable to assume that these students would be leveraging the benefits of various software applications. However, the results did not support this assumption.
The limited level of the participants’ computer use raises
questions in relation to their knowledge of, or familiarity with, the range of available software applications, and the reasons for non-adoption of these applications to aid their doctoral research. It is interesting to speculate whether these students’ low level of computer use was due to their lack of skill/knowledge with the technology or whether it could be due to a dependence on other approaches while carrying out their research work (i.e., paper-based approaches). The questions that can be asked are: Should low/limited level of computer use be a cause for concern? Are we providing
adequate guidance for PhD students in how they might use
computer technologies in their research practices? Would PhD students be able to optimise their productivity through adoption of suitable software applications? Finally, does the way in which an institution (e.g., supervisors in PhD students’ context) embraces and implements technologies have a bearing on the way in which students engage with technology in their higher education context?
We realise that quantity of time used with software applications does not necessarily equate with the quality of the research outputs. But the hours that the PhD students in this project engaged with their computers daily show that they appeared to carry out their doctoral research as a full time job. Further, they were generally regular starters with an average of eight working hours daily (9am – 5pm). It seems logical then to conceive that the PhD students are embracing computer technologies in their research practices. Nevertheless, the computer activities captured showed that these PhD students only used general applications (Office, Entertainment and Reader) regardless of their PhD stages and discipline backgrounds. Could this suggest that typically these are the only main computer technologies that PhD students use in their doctoral research? Do we accept that such rudimentary computer use is sufficient in doing doctoral research? Or do we have to be concerned that the students might not be aware of what particular technologies are available to support their doctoral research and the level of efficiencies that various computer technologies might offer to them? Given the nature of doing research, why was computer use relatively low among this cohort of PhD students when they were working for long eight hours on computers daily?
that they might be lagging behind realising the affordances of current learning technologies. How, then, might we understand this seeming lagging behind?
Further, data gathered through discussions with participants in other stages of the larger project suggested that some participants felt intimated by academic applications and that they exhibited at times a degree of resistance to using technology. Some saw these applications as ‘heavy weight’ applications that were complex platforms and would require commitment and time to master. Another point that surfaced in these discussions concerned the purpose or motivation to use a certain type of academic application software. So, to what extent have computer technologies really become essential tools within the higher education environment? Another question that surfaced for us is, to what degree were participants aware of the extent of their use of computer technology in their daily academic practices? Some participants, when viewing the computer activity data that was being captured, expressed surprise and stated that they were going to make more of an effort to master research-related software programmes as a result. This newly gained awareness, however, did not appear to change behaviour dramatically, but it did provide a degree of self-awareness regarding their computer usage.
In short, the findings generated from the participants in this study show that there seemed to be no difference in the levels of engagement with computers in relation to the participants’ stage of doctoral research and their discipline backgrounds. These findings, however, will inform the next stages of our study. The next stages will focus on the different contexts in which each of the participants carry out their doctoral research with regards to their computer technologies use.
5. Conclusions
Drawing on actual practice/usage data, we sought to explore the manner in which one group of PhD students integrated technology into their doctoral research, and the ways they used technology to support and develop research practices. At the same time, we sought to explore the potential of methods focused on capturing naturally occurring data in comparison with gathering post-event recollections through student self-reporting. It is hoped that the findings generated from this study thus far will help inform the growing literature on postgraduate student use of computer technology. The findings are relevant to the broader tertiary population in that they will help to engender awareness of a different way to understanding research into student behaviour. Further, the study adds another voice or aspect to the growing interest in the role and impact that computer devices are playing in education.
While the findings from this study are specific to the cohort groups involved and are therefore not readily generalisable, the results do offer some new understandings and insights into the use of computers to support
postgraduate study. Insights from this study serve to inform, as well as to start enhancing our understandings of possible support that could be provided for PhD students. Further research on larger and more diverse groups of students could be considered.
Lastly, authentic and situated behavioural data should be employed more frequently in researching technology use. The difference found between perception and practice data signals the need for a substantial shift in the way we understand and gather data in this emerging field.
Acknowledgements
The study presented in this paper is derived from one aspect of KwongNui Sim’s PhD research project, which will be completed at the University of Otago, New Zealand in 2016. Her supervisors are Dr Sarah Stein, Dr Jacques van der Meer and Russell Butson.
REFERENCES
[1] Smith SD, Salaway G, Caruso JB. The ECAR study of undergraduate students and information technology, 2009 Educause [Internet]. 2009 May 2012 [cited 2012 May 2012]; 6:[130 p.]. Available from:
http://net.educause.edu/ir/library/pdf/ers0906/rs/ERS0906w. pdf.
[2] Jackson M. The Impact of ICT on the Development of Information Literacy by Students in Further Education. Journal of eLiteracy. 2005;2:15-26. Epub 2005.
[3] Onilude OO, Apampa OR. Effects of Information and Communication Technology on Research and Development Activities: The FIIRO Experience. Library Philosophy and Practice 2010; 2010 [cited 2013 June]; Available from: http://www.webpages.uidaho.edu/~mbolin/onilude-apampa. htm.
[4] Blignaut AS, Els CJ. Comperacy assessment of postgraduate students' readiness for higher education. The Internet and Higher Education. 2010;13(3):101-7.
[5] Lawlor B, Donnelly R. Using podcasts to support communication skills development: A case study for content format preferences among postgraduate research students. Computers & Education. 2010;54(4):962-71. Epub May 2010.
[6] McCarthy J. International design collaboration and mentoring for tertiary students through Facebook. Australasian Journal of Educational Technology. 2012;28(5):755-75. Epub 2012. [7] Sultan N. Cloud computing for education: A new dawn?
International Journal of Information Management. 2010;30(2):109-16. Epub April 2010.
academic resources and Google. Library trends. 2005;53(4):539-54.
[10] Dange. Post Graduate Students' Computing Confidence, Computer and Internet Usage at Kuvempu University--An Indian Study. International journal of instruction. 2010;3(2):39-62.
[11] Tenopir C. Use and users of electronic library resources: An overview and analysis of recent research studies. Washington, D.C.: 2003.
[12] Rowlands I, Nicholas D, Jamali HR, Huntington P. What do faculty and students really think about e-books? University College London: School of Library, Archive and Information Studies.; 2007 [cited 2013 August 2013].
[13] Liew CL, Foo S, Chennupati KR. A study of graduate student end-users’ use and perception of electronic journals. Online Information Review. 2000;24(4):302-15. Epub 2000. [14] George CA, Bright A, Hurlbert T, Linke EC, St. Clair G,
Stein J. Scholarly Use of Information: Graduate Students' Information Seeking Behaviour. University Libraries Research. 2006;21:1-27. Epub 2006.
[15] Shaw. A Survey of Graduate Students as End Users of Computer Technology: New Roles for Faculty. Office systems research journal. 2000;18(1):21-40.
[16] Aderibigbe NA, Aramide KA. Institutional factors and perceived usefulness as predictors of internet use by postgraduate students at the University of Ibadan, Nigeria. PNLA Quarterly. 2006. Epub 2006. The official publication of the Pacific Northwest Library Association.
[17] Blignaut S, Els J. Comperacy assessment of postgraduate
students' readiness for higher education. The Internet and Higher Education. 2010;13(3):101-7. Epub June 2010. [18] Divaris K, Polychronopoulou A, Mattheos N. An
investigation of computer literacy and attitudes amongst Greek post-graduate dental students. Dental Education. 2007;11:144-7. Epub 2007. Journal Compilation a 2007 Blackwell Munksgaard.
[19] Conole G, de Laat M, Dillon T, Darby J. ‘Disruptive technologies’, ‘pedagogical innovation’: What’s new? Findings from an in-depth study of students’ use and perception of technology. Computers & Education. 2008;50:511-24. Elsevier.
[20] Mininday TJ. Track your time on the computer with Manictime. 2009 [updated 15 February cited 2012 July 2012]; Available from:
http://www.makeuseof.com/tag/manage-and-monitor-your-a pplication-usage-with-manictime/.
[21] Sim KN, Butson R. To what degree are undergraduate students using their personal computers to support their daily study practices? . IAFOR Journal of Education. 2014;2(1):158-71. Epub 2014. The IAFOR Journal of Education
[22] Sim KN, Butson R. Do Undergraduates Use their Personal Computers to Support Learning? . Procedia - Social and Behavioral Sciences. 2013;103:330-9. Epub 2013. Elsevier. [23] Butson R, Sim KN. The role of personal computers in