Development of Criteria for Analysis of Point-contact
Sensor Characteristics in Complex Gas Media
S.A. Golovko
1, V.A. Gudimenko
1, A.S. Klimkin
1, A.M. Pletnev
1, V.L. Vakula
1, A.S. Zaika
1,
L.V. Kamarchuk
2, I.G. Kushch
2, A.P. Pospelov
3, A.V. Kravchenko
4, G.V. Kamarchuk
1,*1Department for Spectroscopy of Molecular Systems and Nanostructured Materials, B.Verkin Institute for Low Temperature Physics &
Engineering of NAS of Ukraine, Ukraine
2Department of Pediatrics, SI “Institute for Children and Adolescents Health Care” of NAMS of Ukraine, Ukraine 3Department of Technical Electrochemistry, National Technical University "Kharkov Polytechnical Institute", Ukraine
4Department of Chemistry, V. Karazin Kharkov National University, Ukraine
Copyright©2016 by authors, all rights reserved. Authors agree that this article remains permanently open access under the terms of the Creative Commons Attribution License 4.0 International License
Abstract
The electric conductivity of point-contactmultistructured sensors in a complex medium of the human breath gas has been studied. Considering a large number of parameters which characterize response curves of point-contact sensors, we proved the possibility of using a statistical procedure to assess the reproducibility of sensor operation. To select sensors with similar parameters from a studied set of sensors, the method of cluster analysis was employed. As a result, we first propose a criterion for selection of uniform sensors from sample sets based on sensing arrays, each containing over 200 point-contact sensing elements. We demonstrate the effectiveness of the proposed approach for the selection of uniform sensors in experiments with breath gas exhaled by a volunteer. In this case, pairs of random elements from the formed cluster show a good reproducibility of their sensor images. The selected elements are thus proved to be uniform samples which can be used to study complex gas media, for example, in clinical practice to develop methods of noninvasive diagnosis based on breath analysis.
Keywords
Point-contact Sensor, Yanson Point-contactSpectroscopy, Sensor Array, Breath, Cluster Analysis
1. Introduction
An obligatory part of the process of samples creation and their further utilization in Yanson point-contact spectroscopy is selection of suitable ones among a set of prepared point contacts using the accepted quality criteria [1]. Point contacts with reproducible parameters can be produced by using appropriate procedures. These samples are suitable for both investigations of their own properties and study of various physical effects [2]. Such an approach proved to be a very good one at low temperatures (i.e. at liquid helium
temperatures). The discovery of the point-contact gas-sensitive effect [3] has raised a number of new problems which have to be solved in order to enable further progress of the method of Yanson point-contact spectroscopy. One of them is development of new criteria and procedures which could help to effectively characterize point-contact sensitive elements at room temperatures. The fact is that working at room temperatures one is unable to use the criteria [1] any time for the targeted selection of produced point-contact nanosensors. Therefore, there is a vital need for further development of this important procedure in the technology of Yanson point-contact spectroscopy and its application in the area of point-contact gas-sensitive effect at room temperatures.
Another point is that there is also an additional difficulty in sensor investigations of complex gas media. It is connected with the probability of gas mixture state varying with time due to a possible interaction of gaseous components to each other [4]. This problem is of particular importance in the area of human breath gas investigations. The breath gas is a multi-component gas mixture which contains more than 600 volatile organic compounds with a low concentration of active substances (a few ppm or ppb and lower). Many of the breath gas components are markers of certain states of a human organism. This circumstance determines the importance of breath research for medical diagnosis [5, 6]. But interaction of breath components with each other can lead to variations in the gas mixture state at different time periods, i.e. to changes in the breath profile. New compounds resulted from interaction of gas mixture components are able, in turn, to become a catalyst for subsequent chemical reactions inside the gas mixture, thereby having an additional influence on the breath profile.
structure parameters of various point contacts, change in purity of the material in the contact area, etc. Thus, applying the sensor technique to study a breath gas, one should be confident that the obtained variations in a breath profile or changes in the electric conductivity of a sample are due to metabolic processes in the human organism and not to some peculiarities of the transducer behavior. Taking into account the above statements, the aim of this work is to study electric conductivity of point-contact sensors in human breath gas media and statistically analyze the obtained results to find criteria for selection of sensors with reproducible characteristics.
The presented paper consists of four sections. After the introductory section, the second section presents information about the material used for point-contact sensors creation as well as data concerning the advanced method of sensitive samples preparation and the procedure of data registration. The third section describes the results of measurements of electric conductivity of point-contact multistructured sensors in the complex medium of the human breath gas, discusses the obtained data, exhibits the prerequisites to utilization of cluster analysis for evaluation of the degree of similarity of sensor operation among the prepared point-contact samples, and demonstrates the cluster analysis results followed by a selection of uniform sensors from the sample sets based on point-contact sensing arrays. At the end, several conclusions are drawn in section four.
2. Materials and Methods
Creation of supersensitive point-contact transducers for analysis of complex gas media is of great importance for technology development in the emergent area of nanosensor investigations [7, 8]. In this view, we designed laboratory samples of point-contact nanosensors based on an organic conductor. To obtain gas-sensitive elements we used a compound of the known organic conductor 7,7,8,8-tetracyanoquinodimethane (TCNQ) with N-alkylquinolinium cation (N-Alk-iso-Qn). The organic conductor [N-C4H9-iso-Qn](TCNQ)2 was synthesized at the
laboratory of the Chemistry department of V. Karazin Kharkov National University. The procedure of synthesis is described in detail in [9]. It should be noted that purity of the initial substances plays an important role in the process of synthesis and greatly influences the compound parameters. Presence of impurities can lead to irreproducibility of composition and parameters of the synthesized compound. Furthermore, in most cases organic substances degrade during their storage under laboratory conditions. Therefore they need to be purified in order to obtain compounds with predicted characteristics. Cleaning of the TCNQ initial substance was performed using the equipment designed at B.Verkin Institute for Low Temperature Physics & Engineering. The technology of the process is described in [10].
Samples were produced on a dielectric glass-cloth-base
laminate substrate with an area of 5x10 mm2. The substrate
was covered with a copper foil which served as current-feeding electrodes. During the samples preparation, a part of the foil with dimensions of 0.15x5 mm2 was
removed from the substrate to form an interelectrode gap. A point-contact sample of TCNQ compound was manufactured in this gap as a plane mesostructure. To get a gas-sensitive substance we used a saturated solution of the [N-C4H9-iso-Qn](TCNQ)2 salt in an organic solvent with a
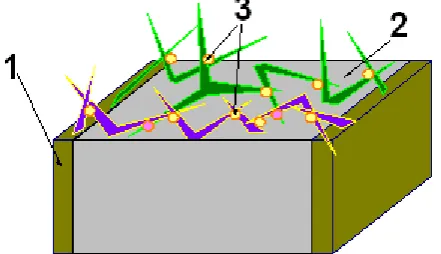
[image:2.595.323.544.373.500.2]high vapor elasticity. That provided for a fast evaporation of the solvent at normal (room) conditions. Sensitive elements were produced using an original electrochemical technology which allowed formation of the mesoscopic point-contact multistructure. The multistructure consists of stable point-contact elements which are built between edges or side surfaces of the needle crystals of TCNQ compound (Figure 1) similarly to the Chubov displacement technique in Yanson point-contact spectroscopy [1, 2]. Each of the point-contact elements is a single point-contact sensor. The created multistructure presents an original version of the point-contact sensor array which realizes the point-contact gas-sensitive effect discovered by our research group [3, 11]. The point-contact sensor array can include up to 200-300 point contacts or more.
Figure 1. General view of a point-contact gas-sensitive element based on
the mesoscopic multistructure of TCNQ compound. 1 – current-feeding electrode, 2 – dielectric substrate, 3 – point contacts between needle-shaped crystals of the TCNQ compound.
Using original preparative and technological approaches, we succeeded in producing multistructure samples of active-type sensors. These samples contain an energy source which makes it possible to record variations in sensor electric conductivity upon gas action without using an external source of current. The energy source of the sensor is formed at the contact interface of copper and the organic conductor during the electrochemical synthesis of the multistructure.
products of electrochemical transformations. The latter are accompanied by a number of attendant effects connected with the inhibition of transport processes in the reaction zone as well as of phase transformations. These transformations are provided with energy of an external electric field. The electrode polarization, i.e. electrode potential bias, is a qualitative expression of the energy consumption. Under certain conditions, the products synthesized during the process of electrolysis can be fixed on the surface of the solid phase of the electrode. In this case, the nature of the electrode gets transformed. This change can be detected by comparing the stationary potentials of the electrode without current before and after electrolysis. Any difference in the values means that new exchange processes are in progress at the interphase boundary, i.e. a new electrode is being created. An electrode potential difference which is stable in time without current is indicative of the presence of an accumulated electric energy. Samples of active-type point-contact sensors designed in such a way are able to operate autonomously without an external source of current. This finding will contribute to the miniaturization of sensor devices developed on the basis of point-contact transducers.
Human breath gas was used in our research as a many-component gas mixture. As it was mentioned above, breath is a composite mixture of gases, which, moreover, have various endogen origins and are secreted in the respiratory passages, gastro-esophagus canal and the mouth cavity [12]. Recently, the problem of exhaled gas analysis has attracted much attention because concentrations of many breath components are dependent on the metabolic state. This property makes it possible to use breath gases as markers of certain states of the human organism and develop noninvasive methods for diagnosis of various diseases. This makes the study of sensor electric conductivity in the human breath media very important. The obtained results will be of high value for the development of portable diagnostic devices.
We studied and tested 49 samples of point-contact sensors based on the conductive compound [N-C4H9-iso
Qn](TCNQ)2. Variations in their electric conductivity were
measured upon the action of a composite gas mixture (human breath gas). The measuring circuit included multimeters Keithley 2000 and Keithley 2100 (USA), and a high-precision model resistors C2-29B-0.125-1M of 1 MΩ (NPO “ERKON”, Russia) which were connected in series with the sample (Figure 2a). The gas action on point-contact sensors caused an increase or decrease in its conductivity and, accordingly, growth or drop of current in the sample circuit, giving rise to a change in voltage bias across the model resistor. The conductivity of the sample and its resistance were calculated from registered values of voltage drop and current flowing through the sample using a resistor with a high percentage accuracy. The procedure of data registration and processing is described in [13]. The conductivity measurements were performed indirectly because of the rather high values of electrical resistivity of
the sensor samples which are almost below the sensitivity threshold of standard multimeters.
[image:3.595.313.552.470.614.2]Along with the application of standard multimetes to our electrical measurements we carried out investigations of sensors’ electric conductivity upon action of a complex gas mixture by means of original portable electronic device designed by our research group (Figure 2b). This device was created for amplification and measurement of the response signal of a sensor interacting with gas media. The device can be used in future as a model for development of a personal portable tool in the noninvasive diagnostics technologies. The measurement circuit of the device contains a model resistor with a high percentage accuracy which operates similarly to the model resistors shown in Figure 2a. To register the sensor response signal U(t) (U – voltage, t – time) a multistructure specimen was put into the holder (Figure 2b) connected to the device. One of the basic parts of the holder is a replaceable expendable mouthpiece. The mouthpiece serves as a cell for interaction of the point-contact multictructure with the breath gas. The device can operate in a two-channel mode. In this case, a holder with two plugs is used. These plugs serve to connect the device and two sensors, which can be put into plugs and studied simultaneously under identical conditions. The process of response signal registration consisted of the following stages. On the request of the researcher, the volunteer put the mouthpiece with an integrated sensor into the mouth, kept it for one minute and then took it out, again, on the request of the researcher. The signal measured by the device was transmitted automatically to the computer. Registration and processing of the results were performed using original software created at B. Verkin ILTPE. The two measurement approaches yielded reproducible results.
Figure 2. a) Electric circuit for measurement of electric conductivity of
point-contact TCNQ-based sensors. 1 – sensor, 2 – sensor holder, 3, 4 – model resistors, 5, 6 – multimeters. b) Portable electronic device (7) with a sensor holder (8) used to record the response signal of point-contact sensors.
3. Results and Discussion
sensors demonstrate response curve upon gas action which consists of a single monotonous extremum. Such dependence can contain nothing more than information about the presence or absence of the substance under study and, in some cases, about its concentration. Thus, conventional sensors operate in the regime of an alarm function only. A point-contact multistructure provides a considerably larger volume of data on the studied gas mixture. Point-contact nanosensors are characterized by a complex response curve which contains spectral information on both the composition of the medium and interaction of its components [14]. This allows point-contact sensors to be used to perform an efficient analysis of the breath gas and develop noninvasive methods for diagnosis of the human organism states [8, 15].
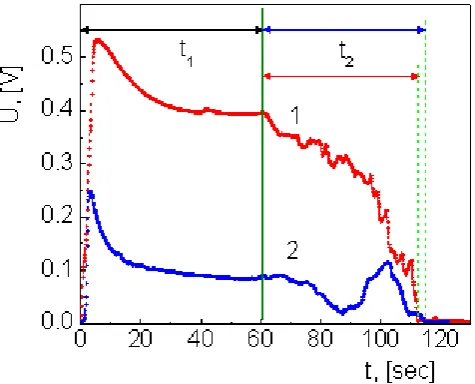
Figure 3 shows time dependences of point-contact sensor voltage drop resulted from interaction of sensors with gas mixture. The curves are registered by two sensors analyzing the breath gas of two volunteers. The left segment of a curve (within the range of 0-60 s) characterizes the time t1
of sensor exposure to the gas exhaled by a volunteer. The right segment is formed after the sensitive element is placed in the ambient air, where the exhaled gas does not interact with the sensor, and corresponds to relaxation of the sensor to its initial state (relaxation time t2). As we can see from
Figure 3, the response curves have a nonmonotonic structure which reflects the individual profile of the exhaled gas mixture (see also [4, 14]). Response curves of point-contact sensors are characterized by a set of parameters which can not only be used to analyze the exhaled gas, but also to provide the criteria to evaluate the reproducibility of the sensor data. The following parameters of a sensor response curve can be considered for this purpose [16]: absolute value of the exposure maximum; absolute value of the relaxation maximum; ordinate of the final segment of the exposure phase (signal value at the end of exposure); ratio of the height of the relaxation maximum above the signal value at the end of exposure to the absolute height of the exposure maximum; ratio of the height of the relaxation maximum above the signal value at the beginning of relaxation to the absolute height of the relaxation maximum; slope of the initial segment of the exposure phase; slope of the initial segment of the relaxation phase; slope of the final segment of the relaxation phase; time of exposure; time of relaxation.
It can be seen from Figure 3 that response curves may have a number of pronounced distinctions. These include, among others, different intensities of point-contact spectra of the exhaled gas profiles, a peculiar character of nonmonotonic features for each curve and different relaxation times. One of the main problems a researcher faces when developing a new method for diagnosing states of the human organism is to ensure reproducibility of properties and parameters of the newly developed sensor samples. Finding a solution to the problem will allow the researcher to be sure that the above-mentioned distinctive features of a response curve characterize the exhaled gas
[image:4.595.314.552.140.332.2]only and not possible variations in properties of the sensor device. In this case, the response curve parameters will accurately reflect the individual profile of the gas exhaled by a specific person and guarantee a high selectivity and specificity of diagnosis of human organism states.
Figure 3. Response curves of the TCNQ compound-based point-contact
nanosensors (two samples) to the action of breath gas of different volunteers.
U – voltage, t – time, t1 – time of exposure, t2 – times of relaxation.
To select samples with similar parameters out of a set of sensors under study we employed a cluster analysis technique. In order to minimize the influence of a possible change in the exhaled gas composition on sensor parameters, we measured our response curves over a short period of time following the measuring technique used for developing methods of medical diagnosis [16]. Response of the sensors to breath gas action was registered after an overnight fast of the subjects in one-minute exposure mode. Reproducibility of results was controlled by recording of a several consequent responses to the action of breath gas.
studied selection of elements. In the extreme case of a very rough estimation of “similarity”, the whole selection can be considered as one cluster, while a very fine estimation may yield no clusters at all. Apart from the degree of “similarity”, the cluster structure of a selection is also determined by how uniform the quantitative indicators of that degree are for the series of elements studied. The role of the degree of uniformity can be fulfilled by an estimated value of dispersion of the quantitative indicators of “similarity”. If the mathematical model considers dispersion as one of the conditions for clusterization, structures can be formed even if the elements are not similar enough.
Cluster analysis is now one of the most efficient tools to process large amounts of data; it is employed wherever computing engineering is used. In this paper, to quantitatively determine the degree of similarity of elements we mapped them into a multidimensional Euclidean space. It was assumed that every characteristic parameter of the sensor image of a metabolic profile corresponds to a certain dimension. To illustrate a cluster analysis procedure, let’s consider a simple example of two sensor samples which can be characterized by two (n=2) parameters: P1 and P2 . For a better visualization, sample numbers i (in our case i=1, 2) are shown as superscripts for each parameter: ( )
1i
P and ( ) 2i P .
As it follows from mathematical statistics [18], to perform our analysis we should reduce the non-uniformly scaled random quantities X, which represent our sensor parameters, to standardized ones by scaling the initial data set. To do this, we need to replace all the random quantities (P1 and P2 ) with their reduced analogs U characterized by a zero mathematical expectation and a unit dispersion: M(U)=0; D(U)=1.
A reduced random quantity is defined as follows: ( )
( ) X M X U
X σ −
= ,
where M X( ) is the mathematical expectation of our random quantity Х, and
σ
( )X is its dispersion.Thus, all our cluster analysis calculations will be made for a two-dimensional Euclidean space of reduced random quantities U1 and U2 related to our selected parameters
1
P and P2 through the following equations: ( )
( ) 1 1 1
1
( i )
i P P
U = σ− and ( ) 2( ) 2 2
2
( i )
i P P
U = σ− ,
where:
(1) 2 (2) 2
( ) ( )
( 1)
j j j j
j
P P P P
n
σ = − + −
− , j = 1 and 2;
and 1 2 2 j j j P P
P = + is the average value of the j-th parameter. At the final stage of the calculation, we only have to find the Euclidean distance between these two elements in the two-dimensional space using the well-known expression for
distances in Euclidean spaces:
(1) (2) 2 (1) (2) 2
1 1 2 2
( ) ( )
d= U −U + U −U .
In the general case, this approach allows one to find a generalized distance between any two elements as a square root of the sum of squared differences of their uniform parameters:
1/2 ( ) ( ) ( ) 2
1
( )
n
ij i j
k k
k
d U U
=
= −
∑
,where dij is the Euclidean distance between the i-th and j-th
elements, ( )i k
U and ( )j k
U are the values of the k-th random variable for the i-th and j-th elements, respectively.
In our case, the elements of the analyzed selection are sensor images of metabolic profiles (the time drift of the exhaled gas composition can be neglected).
The volume N of the array of such distances is, naturally, equal to the total number of all possible pairs of the considered elements and thus given by:
N = n(n - 1)/2
On the basis of the data obtained, we constructed a minimum-length tree two-dimensional projection for the plane of the most significant characteristic parameters. The size of the resulted clusters, defined as a relative number of elements in the structure, provides a qualitative assessment of the level of the technology used. It is evident that the bigger cluster we can individualize in the considered array of elements, the more parameter-wise similar the sensor elements are and, therefore, the higher the level of technological perfection of their manufacturing is.
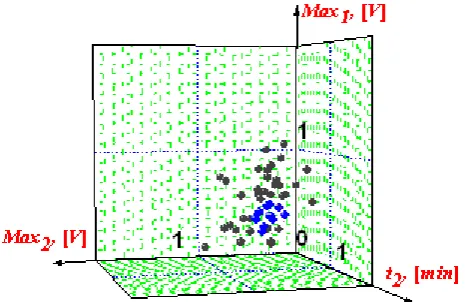
account the natural drift of the parameters determining the experimental conditions, we can conclude that the technological level of the process of manufacturing the point-contact sensors was rather high. At the same time, further improvement of technology requires the level of technological perfection to be evaluated quantitatively. The high demands on the quality of diagnosis methods also imply some additional criteria for selecting sensor samples with the most similar parameters. It is these requirements which are fully met by employing cluster analysis. By using three main characteristics – exposure maximum, relaxation maximum, and relaxation time – we found Euclidean distances between all pairs of the selection, which are necessary to choose the most similar sensors. The sensor samples shown as blue spheres in Figure 4 form a cluster with a limited Euclidean distance 0.27 which consists of 11 samples.
Our calculations demonstrate that the cluster analysis results correlate well with the distribution of the manufactured sensors in the space of real parameters. The ratio of the size of the largest cluster to the volume of the analyzed selection for a given limited Euclidean distance can serve as a quantitative assessment of the degree of technological perfection (the so-called criterial factor, CF, of technological perfection). It is obvious that in an extreme case a set of manufactured sensors can be a monocluster selection with a unit ratio and a zero limited Euclidean distance. Of course, such a singular localization in the space of characteristic parameters is virtually unattainable. For our object, which is a set of sensing elements, CF0.27 =
[image:6.595.314.550.81.275.2]0.225.
Figure 4. Distribution of sensor samples in the three-dimensional space of
exposure maximum (Max1), relaxation maximum (Max2) and relaxation
time (t2).
To assess the effectiveness of the approach, we took two random samples from the cluster and measured their characteristics in the same gas medium, which allows us to make a portable device which was earlier developed by us (see above). The samples were placed simultaneously into the holders of a two-channel apparatus measuring their response signals, and electrical conductivity of the sensors was registered in one and the same medium of gas exhaled by a volunteer. The results of the measurements are
[image:6.595.62.295.450.601.2]presented in Figure 5.
Figure 5. Response signals of two sensors taken from the cluster in Fig. 4
upon the action of an exhaled gas of the same composition.
It turned out that the sensor images of the selected elements display a good convergence within the experimental error. The small differences in the intensities of the curves shown in Figure 5 can be due to variation in power of the internal source of electric energy which is formed in active-type sensing elements, as well as to possible deviations of the current flow regime for different samples from the regime which is optimal for the manifestation of the point-contact gas-sensitive effect. As we know from Yanson point-contact spectrosopy [1, 2], deviations from the ballistic regime of current flow result in a decrease in the point-contact spectrum intensity. Our technology of synthesis of a point-contact multistructure based on TCNQ compounds does not exclude the possibility of some of the sensing matrix point-contacts having an imperfect crystalline structure. This may lead to a deviation from the optimal conditions for current flow and transfer of energy to atoms adsorbed on the surface of the contact upon placing it in a gas medium. A lower effectiveness of the energy aspect of the process of interaction of charge carriers in the contact with atoms of the gas medium can, in turn, lead to a lower contribution of the above processes to the intensity of the sensor response signal, leaving at the same time unchanged the number and position of the features (maxima) in point-contact spectra of the exhaled gas profile. As we can see from Fig. 5, the fine structure of point-contact spectra of the exhaled gas profile remains the same for different samples. It is of special importance that we can observe a complete reproducibility of the sensor response signals as far as relaxation time t2,
which is important for medical diagnosis [8, 14], is concerned. From the viewpoint of Yanson point-contact spectroscopy, this comes without surprise, since the sensor recovery (relaxation) time t2 describes an integrated energy
Similar results were obtained for other pairs of elements from the cluster. This allows us to consider the cluster isolated for the limited Euclidean distance 0.27 as a relevant set of products which can be believed to be uniform and used as sensing elements to study the composition of complex gas media, for example, in clinical practice for a noninvasive diagnosis based on analyzing breath gas exhaled by a patient.
4. Conclusions
In this paper, we first propose a criterion for selection of uniform sensors from sample sets based on sensing arrays, each containing over 200 point-contact sensing elements. We studied electric conductivity of point-contact sensors in a complex multicomponent medium of gas exhaled by a person. Considering a large number of parameters which characterize response curves of point-contact sensors, we proved the possibility of using a statistical procedure to assess the reproducibility of sensor operation. To select sensors with similar parameters from a studied set of sensors, the method of cluster analysis was employed. Using three main characteristics of point-contact sensor response signal which are applied to develop methods of noninvasive medical diagnosis – exposure maximum, relaxation maximum, and relaxation time – we found Euclidean distances for all pairs of the selection and isolated а cluster with the limited Euclidean distance 0.27 consisting of 11 samples. We demonstrated the effectiveness of the proposed approach for the selection of uniform sensors in experiments with breath gas exhaled by a volunteer. In this case, pairs of random elements from the formed cluster showed a good reproducibility of their sensor images. The selected elements were thus proved to be uniform samples which can be used to study complex gas media, for example, in clinical practice to develop methods of noninvasive diagnosis based on analyzing gas exhaled by a patient.
Acknowledgements
This work was partly supported by the NAS and NAMS of Ukraine.
REFERENCES
A. V. Khotkevich, I. K. Yanson. Atlas of Point Contact [1]
Spectra of Electron-Phonon Interactions in Metals, Kluwer Academic Publishers, Boston/Dordrecht/London 1995. Yu. G. Naidyuk, I. K. Yanson. Point-Contact Spectroscopy, [2]
Springer, New York, 2005.
G. V. Kamarchuk, O. P. Pospelov, A. V. Yeremenko, E. [3]
Faulques, I. K. Yanson. Point-Contact Sensors: New Prospects for a Nanoscale Sensitive Technique. Europhys.
Lett., Vol.76, No.4, 575-581, 2006.
G. V. Kamarchuk, A. P. Pospelov, I. G. Kushch. Sensors for [4]
exhaled gas analysis: an analytical review, in Volatile biomarkers: non-invasive diagnosis in physiology and medicine, A. Amann and D. Smith, eds. Elsevier, Amsterdam, 265-300, 2013.
A. Amann, D. Smith, eds. Breath Analysis for Clinical [5]
Diagnosis and Therapeutic Monitoring, World Scientific, Singapore, 2005.
A. Amann, D. Smith, eds. Volatile Biomarkers: non-Invasive [6]
Diagnosis in Physiology and Medicine, Elsevier, Amsterdam, 570, 2013.
K. Iniewski, ed. Smart Sensors for Industrial Applications. [7]
Devices, Circuits, and Systems, CRC Press, 598, 2013. G. V. Kamarchuk, A. P. Pospelov, L. V. Kamarchuk, I. G. [8]
Kushch. Point-Contact Sensors and Their Medical Applications for Breath Analysis: A Review, in Nanobiophysics: Fundamentals and Applications, V.A. Karachevtsev, ed. Pan Stanford Publishing Pte. Ltd., Singapore, 327-379, 2015.
A. V. Kravchenko, V. A. Starodub, A. R. Kazachkov, A. V. [9]
Khotkevich, O. S. Pyshkin, G. V. Kamarchuk. Spectral and electrophysical characteristics of anion-radical salts of TCNQ and methyl-TCNQ with N-alkylpirazinium cations, in
Spectroscopy of Emerging Materials, E.C. Faulques, D.L. Perry, and A.V. Yeremenko, eds. NATO Science Series, Kluwer Academic Publishers, Boston/Dordrecht/London, 319-330, 2004.
O. Pyshkin, G. Kamarchuk, A. Yeremenko, A. Kravchenko, [10]
А. Pospelov, Yu. Alexandrov, E. Faulques. Evidence for sensory effects of a 1D organic conductor under gas exposure, J. Breath Res., Vol.5, No.1, 016005 (9 pp), 2011.
G. V. Kamarchuk, I. G. Kolobov, A.V. Khotkevich, I. K. [11]
Yanson, A. P. Pospelov, I. A.Levitsky, W. B. Euler. New chemical sensors based on point heterocontact between single wall carbon nanotubes and gold wires, Sensors and Actuators B, Vol.134, 1022-1026, 2008.
B. d. L. Costello, A. Amann, H. Al-Kateb, C. Flynn, W. [12]
Filipiak, T. Khalid, D. Osborne, N. M. Ratcliffe. A review of the volatiles from the healthy human body, J. Breath Res., Vol.8, 014001, 2014.
S. A. Golovko, V. A. Gudimenko, A. P. Pospelov, G. V. [13]
Kamarchuk. Electric and gas-sensitive properties of organic conductors-based point-contact sensors, Uzhhorod University Scientific Herald. Series Physics, 95-102, 2014.
I. Kushch, N. Korenev, L. Kamarchuk, A. Pospelov, A. [14]
Kravchenko, L. Bajenov, M. Kabulov, A. Amann, G. Kamarchuk. On the importance of developing a new generation of breath tests for Helicobacter pylori detection, J. Breath Res., Vol.9, No.4, 047109, 2015.
I. Kushch, N. Korenev, L. Kamarchuk, A. Pospelov, Yu. [15]
Alexandrov, G. Kamarchuk. New possibilities in diagnosing helicobacter pylori infection by the non-urease products of its activity, Selected Papers from 8th World Congress of the World Society for Pediatric Infectious Diseases WSPID. November 19-22 2013, MEDIMOND International Proceedings, Cape Town, Bologna, 2014.
Pospelov, Y. L. Alexandrov, G. V. Kamarchuk. Sensors for Breath Analysis: An Advanced Approach to Express Diagnostics and Monitoring of Human Diseases, in Biodefence, S. Mikhalovsky, A. Khajibaev, eds. NATO Science for Peace and Security Series A: Chemistry and Biology, Springer Science+Business Media B. V., 63-75,
2011.
J. N. R. Jeffers. An Introduction to Systems Analysis: with [17]
Ecological Applications, Edward Arnold, London, 1978. A. I. Orlov. Mathematics of Chance: Probability and Statistics [18]