Energy and Environmental Engineering 5(4): 87-92, 2017 http://www.hrpub.org DOI: 10.13189/eee.2017.050401
Environmental Monitoring of
222
Rn Radiations in "Bare
Mode" in Moradabad City of Western Uttar
Pradesh, India
Nikhil Rastogi
*, Indu Singh
Department of Physics, School of Sciences, IFTM University, India
Copyright©2017 by authors, all rights reserved. Authors agree that this article remains permanently open access under the terms of the Creative Commons Attribution License 4.0 International License
Abstract
Evaluation of indoor and outdoor radon and its progenies concentrations and natural background radiation levels of Moradabad city and in the nearby villages were measured by using Solid-state nuclear track detectors (LR-115 type II) in a bare mode. The measurements were carried out in 40 different areas of Moradabad and its nearby villages. Indoor radon concentration was found to vary with building material, ventilation condition and mode of constructions of houses. The indoor radon concentrations were found to vary from 20.3Bq/m3 to 67.2Bq/m3 with an average value of40.8Bq/m3 and the outdoor radon concentration were found
to vary 19.3Bqm-3 to 62.2Bqm-3 with average value
36.6Bq/m3. The mean indoor and outdoor radon
equilibrium equivalent concentrations were found 16.40Bq/m3 and 14.93Bq/m3 respectively. This value is
lower than the ICRP recommended values of 200Bq/m3
and thus are within safe limits. The outdoor radon concentration is usually low and less than average indoor levels. It is also found that, in general, the radon level in ground floors is higher than that in upper ones in all areas.
Keywords
Indoor Radon Concentration, SSNTD’s,Outdoor Radon Concentration, Dosimeter
1. Introduction
Radiations have always been a part of our natural environment. Long-lived radioactive elements such as uranium, thorium and its decay products, such as radium and radon have always been present in the Earth's crust and atmosphere. Human beings have been exposed by radiate since inception. Exposure of ionizing radiation, which cant not been detected by any sense of our body, is injurious to
our health. Radon and its short-lived daughters are the most hazardous source of particles prevailing in our environment, which are probably responsible for causing lungs cancer [1]. In India out of 98% exposure dose from natural radioactive sources, about 52% is due to radon and its progeny. It has been well established that many building materials used in construction work contain radioactive elements such as 226Ra, 232Th and their decay products.
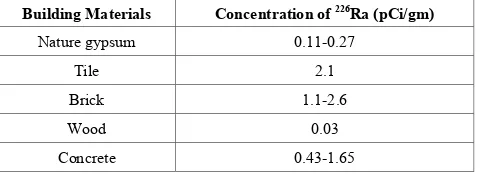
Table 1 shows the typical concentration of 226Ra in various
[image:1.595.303.544.467.554.2]building materials. The radon is more concentrated in the lower levels of the home (that is basement, ground floors and the first floors).
Table 1. Radium concentrations in some building materials
Building Materials Concentration of 226Ra (pCi/gm)
Nature gypsum 0.11-0.27
Tile 2.1
Brick 1.1-2.6
Wood 0.03
Concrete 0.43-1.65
Radon and Thoron are α emitting radioactive gas. It is a daughter product of 226Ra and 230Th decay with a half-life
Figure 1. Uranium Decay Series showing radon thoron and its daughter products Building materials contribute in increasing the natural
radiation in the atmospheric air and poses a health hazards. Therefore measurement of indoor radon, thoron and its progeny in human dwelling is very important for the health physics point of view [3]. As radon is a gas, it is able to diffuse through the soil and other materials around the foundation of houses. Houses tend to operate under a negative pressure, its means that the air pressure outside the house is higher than the air pressure inside. This negative pressure comes from:
The chimney effect, by which the upward flow of warm air inside the house, creates the positive pressure area at the top of the house and a negative pressure area at the bottom of the floor.
A downwind draft effect, which is caused by wind blowing in a home on floors 3 & 4.
A vacuum effect caused by air vented to the outside by exhaust fans, clothes dryers, etc.
The negative pressure differential tends to be strongest in basements and during the winter season. It acts as a vacuum that pulls radon-rich air into the lower areas of the house through any dirt floor areas or unsealed sumps or fissures, pores or cracks, in the building materials. Although numerous factors can influence the radon entry diffusion/convection mechanism (e.g., indoor-outdoor-temperature differentials, atmospheric pressure, rainfall, humidity, and atmospheric pressure) in houses having natural ventilation, the predominant factors influencing radon entry are the indoor-outdoor differential pressure and in some cases of the wind velocity[4]. The variations of radon and thoron concentrations in air depend on the height above ground, place time and on the metrological conditions. The resulting radon thoron and progeny concentrations are also influenced by heating systems and ventilation by architectural style of the building. Building materials that made from stone, sand, and or by products may contain uranium and radium and generate radon. Many of these materials such as brick,
wallboard or concrete are sufficient porous to allow radon to escape in to the air [5, 6].
Most of the houses in the Moradabad city are constructed with soil and stone, so that there are many possibilities of high radon and thoron concentrations inside the houses. This study will enable us to identify the environmental problem concerning radiation hazards.
2. Area for the Measurements
Moradabad City is situated in western part of Uttar Pradesh state in India. Moradabad city forms a part of genetic alluvial plain and lies between 28020’ and 290North
latitudes and 78024’ and 790East longitude covering an
Energy and Environmental Engineering 5(4): 87-92, 2017 89
Figure 2. Map of Moradabad city
The area of the Moradabad city can be divided into two
broad geological unities namely Younger Alluvium and Older Alluvium. Moradabad city is having main two rivers Ram Ganga and Gaga rivers respectively. The ground of the Moradabad city is almost plane but some places are as ups and downs. The River water contains soil, silt and sand in varying proportion. The soil of the Moradabad is mainly silty, clayey and sandy in varying proportions [7]. The houses in study area are well, as well as poorly ventilated. Buildings are constructed of concrete, cement, bricks and blocks. Some houses, having glass doors and glass windows are also included in study.
3. Experimental Measurements
Radon and its progeny concentration were measured by using LR-115 type-II plastic track detector. Detector of small size 2cm x 2cm were used as a passive detectors in a “BARE’’ modes for recording the alpha particles emitted by 222Rn gas present in our ambient air and its short lived
daughter products (218Po , 214Po ) with attach themselves to
the aerosols. The detectors were fixed on glass slide and mounted on the walls at a height of about 2m from the ground with their sensitive surfaces facing the air. The exposure period of three months, the detectors were etched for two hours in 2.5N NaOH solution maintained at 60oC in
constant temperature bath. After etching process, the detectors are removed and washed in distilled water. After drying the detectors are ready to count under an optical microscope for track density measurements. The measured track densities for radon, thoron and progeny were converted into working level (WL) and activity concentrations converted into Bq/m3 by using the
calibration factor[8, 9]
125 tracks.cm-2 d-1 =1WL
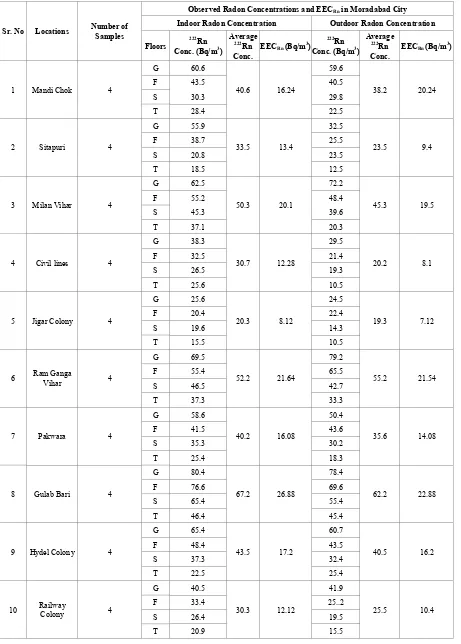
Table 2. 222Rn Concentration and Equilibrium-equivalent Radon Concentration
Sr. No Locations Number of Samples
Observed Radon Concentrations and EECRn in Moradabad City
Indoor Radon Concentration Outdoor Radon Concentration
Floors Conc. (Bq/m222Rn 3)
Average
222Rn
Conc. EECRn (Bq/m
3) 222Rn
Conc. (Bq/m3)
Average
222Rn
Conc. EECRn (Bq/m
3)
1 Mandi Chok 4
G 60.6
40.6 16.24
59.6
38.2 20.24
F 43.5 40.5
S 30.3 29.8
T 28.4 22.5
2 Sitapuri 4
G 55.9
33.5 13.4
32.5
23.5 9.4
F 38.7 25.5
S 20.8 23.5
T 18.5 12.5
3 Milan Vihar 4
G 62.5
50.3 20.1
72.2
45.3 19.5
F 55.2 48.4
S 45.3 39.6
T 37.1 20.3
4 Civil lines 4
G 38.3
30.7 12.28
29.5
20.2 8.1
F 32.5 21.4
S 26.5 19.3
T 25.6 10.5
5 Jigar Colony 4
G 25.6
20.3 8.12
24.5
19.3 7.12
F 20.4 22.4
S 19.6 14.3
T 15.5 10.5
6 Ram Ganga Vihar 4
G 69.5
52.2 21.64
79.2
55.2 21.54
F 55.4 65.5
S 46.5 42.7
T 37.3 33.3
7 Pakwara 4
G 58.6
40.2 16.08
50.4
35.6 14.08
F 41.5 43.6
S 35.3 30.2
T 25.4 18.3
8 Gulab Bari 4
G 80.4
67.2 26.88
78.4
62.2 22.88
F 76.6 69.6
S 65.4 55.4
T 46.4 45.4
9 Hydel Colony 4
G 65.4
43.5 17.2
60.7
40.5 16.2
F 48.4 43.5
S 37.3 32.4
T 22.5 25.4
10 Railway Colony 4
G 40.5
30.3 12.12
41.9
25.5 10.4
F 33.4 25..2
S 26.4 19.5
Energy and Environmental Engineering 5(4): 87-92, 2017 91
[image:5.595.155.442.93.291.2]The measured data table is given in table 2 and the corresponding curve is shown in figure 3.
Figure 3. Observed Radon Concentrations and EECRn in Moradabad City
4. Result and Discussion
[image:5.595.69.528.399.741.2]The results of radon measurements in the different areas of Moradabad city and in the nearby villages are shown in the table 2. Most of the houses in the Moradabad city are constructed of cement bricks, where as in the nearby villages the walls and floors are made of sandstone and rocks with a cement paste.
Table 3. Floor wise 222Rn Concentration in different areas of Moradabad City
Sr.No Location Radon Concentration in (Bq/m3)
Ground Floor(G) First Floor(F) Second Floor(S) Third Floor(T)
1. Mandi Chok 60.1 42.0 30.0 25.3
2. Sitapuri 44.2 32.1 22.2 15.5
3. Milan Vihar Colony 67.4 51.8 42.4 28.7
4. Civil lines 33.9 26.9 22.9 18.0
5. Jigar Colony 25.0 21.4 16.9 13.0
6. Ram Ganga Vihar 74.4 60.5 44.6 35.3
7. Pakwara 54.5 42.6 32.8 21.9
8. Gulabbari 79.4 73.1 60.4 45.9
9. Hydel Colony 63.1 45.9 34.9 23.9
10. Railway Colony 41.2 29.3 22.9 18.2
It is found that the minimum and maximum indoor radon concentration is varying 20.3Bq/m3 to 67.2Bq/m3, where as
for outdoor concentration; vary 19.3Bq/m3 to 62.2Bq/m3
respectively. It is also found that equilibrium-equivalent radon concentration (EECRn) vary from 8.1 to 26.88Bq/m3.
Therefore, it can be explained that indoor radon concentration is higher than outdoor radon concentration and the radon radiation levels in ground floor is much higher than in upper ones in all areas of Moradabad city [curve fig-3].The observed radon concentration in old houses are found more than the new constructed houses with cement and bricks, which are lower than the ICRP, recommended value (200Bq/m3).The old houses are
constructed with soil and stone, which allow more radon to diffuse inside the room from ground floor and walls of the room. While in the other building the flow of radon was protected by the coating of cement on walls and floor of the room. The houses in the nearby villages’ areas have poor ventilation condition with one small window and without ventilation. In the survey of radon concentration it is observed that the radon and thoron concentration decreases with volume for similar ventilation condition and also the upper floor have lower radon and thoron concentration than the ground floor (table-3, figure 4). The international commission on radiation protection [10] has recommended that the action level for radon concentration should be in the range 200-600Bq/m3.The measured radon
concentration values are below the recommended action level.
The resulting concentration of short-lived radon daughters, expressed in term of an equilibrium-equivalent radon and thoron concentration (EEC), is related to the activity concentration (Ac) of radon by the relation [11]
EEC = F. Ac
F = Equilibrium factor (for Indoor air 0.40 and Outdoor air 0.7)
AC = Activity Concentration in Bq/m3
5. Conclusions
Radon concentrations were measured in 40 different areas of Moradabad city and its nearby village of western Uttar Pradesh, India. The significant variations of radon concentrations were found in the different types of houses. The indoor areas of the houses show the maximum radon concentration in compare outdoor radon concentration. These high values may be due the activity concentration of radon, which are largely influenced by the factors such as humidity, atmosphere pressure, topography, temperature, construction of houses, types of building materials and ventilation etc. The measured data in the tables 1, 2 & 3 show that the region of Moradabad city and nearby village, the measurement is taken is in safe limit from the radiation protection point of view.
Acknowledgement
The authors wish to acknowledge the residents of Moradabad city, where the measurements were taken. The authors also wish to acknowledge the research group of Physics Lab, IFTM University for their help in installation of apparatus for readings. The authors also thank to the Vice chancellor of IFTM University, Moradabad for providing the necessary facilities and permission to carry out the research work.
REFERENCES
[1] Ket Min, Annie Tan Soo Lian, and Ng Ti Lik, “Radon review and indoor survey Singapore- Introduction: Natural source of radiation,” from http://home.pacific.net.sg, (1995). [2] Kies A, Biell A, Rowlinson L etal. Investigation of the
dynamics of indoor radon and radon progeny concentration Environ Int. 1996; 22:S889-S904.
[3] Alter H.W. and Fleischer R.L. “Passive integrating radon monitor for environmental monitoring”. Health Physics 40,693 (1981).
[4] Riley W J, Gadgil A J, Bonnefoys YC etal. The effect of steady winds on radon-222 entry from soil into house. Atoms Environ 1996; 30 (7) 1167-1176.
[5] Muramatsu H, Tashiro Y, Hasegawa N et al. Seasonal variations of Rn-222 concentrations in the air of a tunnel located in Nagano city. J Environ Radioact 2002: 60 (3): 263-274.
[6] Rastogi N. & Singh I, Levels of natural radioactivity in environment in residential area of Moradabad District, Western Uttar Pradesh, (Pollution), 3,(1): 1-7, Winter 2017., DOI: 10.7508/pj.2017.01.001, Print ISSN: 2383-451X Online ISSN: 2383-4501.
[7] Verma R.C., (Report 2008-2009) gwb.gov.in/District_Profil e/UP/Moradabad.pdf,p.no.8.
[8] RamolaR.C., Rawat et al.,(1996) Calibration of LR115 Plastic Track detector for environment radon measurement ,Indoor Built Environment,5,364-366.
[9] Eappen K.P. and Mayya Y.S. Calibration factor for LR-115 type-II based radon thoron discriminating dosimeter. Radiation measurement 38 (2004) 5-14.
[10]ICRP (1993) International Commission for Radiation Protection. Protection against rado-222 at home and at work. ICRP Publication No.65 (Pergamon Press, Oxford). [11]ICRP (1987) Lung Cancer Risk for Indoor Exposure to